
 ?Mathematical formulae have been encoded as MathML and are displayed in this HTML version using MathJax in order to improve their display. Uncheck the box to turn MathJax off. This feature requires Javascript. Click on a formula to zoom.
ABSTRACT
Nanomechanics of cytoskeleton is deeply involved in physiology and regulation of cell behavior. Atomic Force Microscopy has been extensively used for quantitative characterization with high-spatial resolution, in particular showing tremendous opportunities in biomechanics by quantifying mechanical parameters related to cytoskeleton organization. In this short review, we highlight recent developments in cell nanomechanics by AFM focusing on methodology and direct application to investigate cytoskeleton restructuration when cells are interacting with nanostructures (surfaces and nanoparticles). In particular, cells can sense the stiffness of environment or internalized particles and AFM can detect the rearrangement of cytoskeleton as one of the responses of mechanotransduction stimuli. Current bottlenecks hindering further progress in technology, such as theoretical models of interpretation will be discussed, in particular we propose a solution for complex system by coupling AFM with finite element simulations to retrieve more quantitative information when heterogeneity and convolution play important roles. Finally, we present recent cutting-edge research directions to explore new techniques and enhance the capabilities of AFM nanomechanics for living cells.
GRAPHICAL ABSTRACT
I. INTRODUCTION
Cell mechanobiology is a discipline that focus on the cellular response and actuation of mechanical forces associated with cell physiology. Mechanical deformability of cytoskeleton and membrane of cells can allow complex and dynamic processes to sense and readapt to biophysical cues encoded in the external environment. Such sensing is one of the factors driving cytoskeleton restructuration manifested as shape modification, motility and internal rearrangement associated with important cellular and subcellular processes. Mechanotransduction is governing numerous cell physiological processes, for instance, embryonic development and tissue homeostasis [Citation1], natural aging process [Citation2,Citation3]. Controlling these mechanotransductive events could lead to several biomedical applications, such as in regenerative medicine and tissue engineering [Citation4,Citation5].
In this framework, mastering a technique to investigate mechanical properties of cytoskeleton of living cells is a hot research topic in mechanobiology [Citation6], prompt by possibility to use mechanical properties quantification for diagnostic purpose [Citation7]. As biomechanics is involved in cell physiology [Citation8], a pathophysiological condition is often correlated with modification in mechanical properties already demonstrated for cancer [Citation9], infection [Citation10–12] and inflammation [Citation13,Citation14].
Investigation of cell mechanical properties is a complex issue, only recently a comparison of different measurement techniques was published, including atomic force microscopy (AFM), magnetic twisting cytometry (MTC), particle-tracking microrheology (PTM), cell monolayer rheology (CMR), and optical stretching (OS) [Citation15]. The quantification of cell mechanical properties mainly depends on the stress-deformation intensity and velocity, the probe–cell contact area and quantification of its geometry, the cell portion analyzed (e.g., whole, localized on nucleus, periphery, or internal), and interaction with environment. In term of versatility, spatial resolution and non-destructive approach, AFM has demonstrated the greatest potentiality.
AFM-based indentation is commonly used to quantify the mechanical properties of spread cells at subcellular resolution in 3D space while achieving piconewton-level force sensitivity. An AFM consists of a probe supported by an elastic cantilever that applies a vertical force at a defined speed on target sample while detecting the reaction force with pN level sensitivity. Mathematical models of contact mechanics between the AFM probe and the cell are required to interpret and quantify data derived from AFM indentation on living cells [Citation16,Citation17]. Indentation at low speed (frequency of events ≈ 1 Hz) is considered quasi-static and providing a wealth of information such as surface positioning, reaction force and probe-surface bonding force, in turn, converted in morphology, Young’s modulus map and adhesion map. For instance, we highlight the significance AFM nanoindentation applied to biological system: classification of different cells and pathologically altered conditions. For example, stages of cancer progression have different biomechanical fingerprint and AFM was used successfully to distinguish cancer line from healthy counterparts [Citation18–20]. Further development of atomic force microscopy techniques and interpretation is always proceeding as a hot topic research line, delivering new means to investigate complex structures such as living cells.
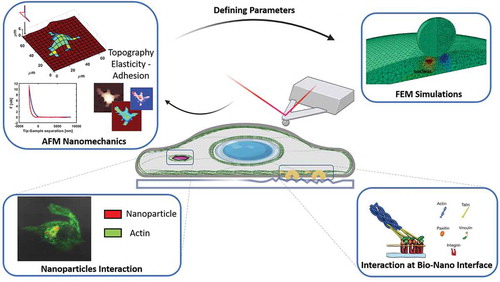
The main objective of this review is to provide a short and exhaustive overview on recent development of AFM nanoindentation methodology applied to investigate selected cell mechanics problems, such as interaction with nanostructured surfaces and internalized nanoparticles. The work is divided in four main sections. The first section is focused on methodology and interpretation of AFM applied to cell mechanics highlighting nanoindentation and the contact mechanics model employed for quantification (first panel in ). In the second section, the coupling of AFM with finite element simulations is presented (second panel in ). The third section is focused on study cases dedicated to detection of cytoskeleton restructuration in response to stiffness and topography of substrate (third panel in ) and upon internalization of nanoparticles (fourth panel in ). In the final section, the perspective and promising future research directions involving AFM for cell nanomechanics are discussed. For further insights in cell nanomechanics, the readers will be addressed to works and reviews that focus on different specific aspects with more detail.
Figure 1. Schematic representation of AFM nanomechanics combined with finite element simulations to investigate interaction with internalized nanoparticles and nanostructured interfaces. Reproduced and readapted with permission from [Citation21] and [Citation22]
![Figure 1. Schematic representation of AFM nanomechanics combined with finite element simulations to investigate interaction with internalized nanoparticles and nanostructured interfaces. Reproduced and readapted with permission from [Citation21] and [Citation22]](/cms/asset/246263c5-1213-49dd-be4f-7b834ef93027/tapx_a_1866668_f0001_oc.jpg)
II. Methodology and Interpretation
The nanomechanical properties of cells are challenging and requiring efforts from scientific community to develop a commonly accepted methodology, as well, to discern the correct contact mechanics theory for data interpretation. The following subsections will describe the most common methodology to obtain mechanical properties of cells, namely, force spectroscopy and the models employed to quantify mechanical descriptors of cells, such as Young’s modulus and viscosity.
Force Curve and Nanoindentation
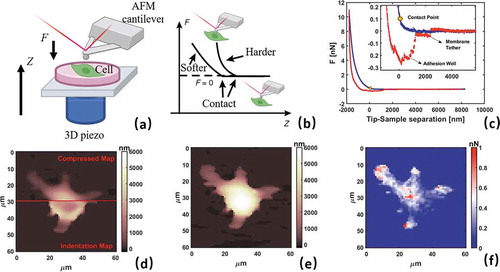
Atomic force microscope is a very sensitive force sensor (accuracy can reach F < 1 pN) with 3D localization. The most common approach of measurements of mechanical properties is obtained by repeating vertical force-distance curves (FCs) on a spatially defined grid to obtained property map (i.e. stiffness and adhesion, see first panel in ) in 1:1 correspondence with morphology. As shown in schematics of , FC is the basic force spectroscopy element obtained by approaching the probe vertically while recording the deflection of cantilever with a laser. For correct quantification, the properties of the probe must be calibrated, finding spring constant k and optical lever sensitivity, briefly, zsens. The importance of zsens (nm/V) is related to the conversion of raw AFM force spectroscopy measurements (Voltage- vs. Piezo displacement-Zpiezo) in Force-F vs. Indentation curves for mechanical and adhesion analysis [Citation23]. Optical lever sensitivity is measured as the slope of contact part on rigid substrate, while spring constant k is measured with thermal noise method [Citation24–26]. Briefly, the power spectral density of natural thermal vibration of AFM cantilever can be integrated and, using the theorem of energy equipartition for single harmonic oscillators and the properties of the Fourier’s transform, the spring constant k can be retrieved.
Figure 2. AFM nanoindentation methodology. a) Schematic of AFM probe approaching vertically a sample b) Schematic representation of typical force curve (FC) c) AFM experimental FC after conversion with EquationEq. 1Eq. 1
Eq. 1 showing with approaching (blue) and retracting (red) and contact point XC. Inset represents a zoom focused on adhesion well d) overlap of compressed map (top) and indentation map (bottom) e) zero force morphology map f) Adhesion force map. c-f panels are representative analysis from 64 × 64 force volume analysis on resting M0 phenotype of RAW 264.7 macrophage cell
For instance, this calibration procedure is the major source of error and discrepancy. A standardized Nanomechanical procedure (SNAP) was recently introduced [Citation27], discussing problematics in nanomechanical measurements experienced in 11 different AFM labs across Europe. The main issue was detected as the error/imprecision during optical lever sensitivity calibration, successively propagated to thermal noise calculation. Through an external, independent measurement of elastic constant of cantilever, SNAP can be used to correct zsens.
Another important issue and source of error to be considered during force spectroscopy is the determination of contact point XC, i.e. the piezo displacement where probe starts to be in contact with sample surface and the origin of indentation axis will be located. Operatively the non-contact part is determined as flat line at zero force, indicating no-interaction between probe and sample. The distribution of force on vertical axis can be weighted to recognize the non-contact part appears as a sharp peak automatically detectable and fitted by a Gaussian distribution. The region of the FC above experimental noise (1 single width σ of the Gaussian distribution) is considered as contact part, defining the positive indentation (δ [nm]) [Citation28,Citation29]. This procedure can be further optimized by executing a fitting procedure using a proper contact mechanics model (see next section) using XC as free parameter [Citation30]. Such precise approach can reach errors in the range of , considering the complexity of the probe/cell contact region smaller error would unreasonable. In summary, the relations used to convert raw AFM in Force (F [nN]) vs. Indentation (δ [nm]) can be summarized as in EquationEq. 1
Eq. 1
Eq. 1 :
where D, ,
,
and XC represent the cantilever deflection (nm), deflection (V), indentation (nm), piezo displacement and contact point coordinate.
A typical example of FC on living macrophage RAW264.7 is presented in , in particular showing approaching (blue), retracting (red) curve and highlighting contact point position XC. In Force Volume measurement, XC is also used to correct the morphology recorded at maximum applied force (trigger point, where probe inverts motion and starts to withdraw). As shown in , the indentation values (bottom) must be added to compressed morphology (top) to retrieve the ‘real’ morphology at zero force (). Morphology at zero force is also necessary to apply finite thickness correction (FTC) as explained in the next section.
FCs can be used directly to measure the adhesion force between probe and cell surface by retracting the probe after force application. Using functionalization protocols on AFM probe it is possible to perform functional imaging and detect specific targeting forces along with morphology (currently reviewed in [Citation31,Citation32]). Interestingly, adhesion force can be used to retrieve information on actin cytoskeleton organization below cell membrane [Citation33]. Generally, without functionalization and working in liquid environment, the probe-cell adhesion is relatively small and negligible in comparison with applied vertical forces. An example is shown in the inset of , the complex adhesion well, including jumps and plateau, is indicative of membrane pulling and tethering formations [Citation33]. Adhesion analysis can be performed for all FCs obtaining adhesion map in (substrate is masked using morphology and artificially set at zero). Quantitative analysis form shows an average adhesion force of FAD = 0.3 ± 0.1 nN, around 4–5% of maximum indentation force considered from mechanical analysis. This is a crucial point for the validity of contact mechanics model used for data analysis. We wish to point out that the procedure of force curve cleaning and conversion, as well extraction of morphological and mechanical maps as described in next section, are not easily accomplished. For this reason, beside built-in software of AFM instrument, we mention free alternatives such as AFMechSuite [Citation28], OpenFovea [Citation34], and AtomicJ [Citation35] helping AFM researchers to openly access functional platforms for data analysis and interpretation.
Contact Mechanics Model
The data interpretation after AFM measurement and conversion, is a crucial point to extract nanomechanical information of cells, i.e. Young’s Modulus. We mentioned before how to retrieve force vs. indentation, while now we explain how to deal with the contact part depending on contact mechanics model, i.e. geometry, material properties and boundary conditions of probe and sample.
For instance, the selection of best probe geometry has been extensively debated in scientific community, highlighting the most general choices as sharp pyramidal tips or large spherical micrometric probes, in turn determining the contact models to be used. Sharp probes have a reduced curvature radius, in principle, granting high-spatial resolution (as explained in the section ‘Perspectives | High Resolution’) but adding drawbacks in nanomechanical investigation, such as large local pressure (causing non-linearities or even damage), poor geometrical definition and sensitivity to nanoscale heterogeneity [Citation30]. In turn, micrometric spherical probes have intrinsically less spatial resolution but alleviating previous drawbacks in nanomechanics. In literature, several methodological works are dedicated to this issue, in particular comparing with other techniques, sharp probes are overestimating the Young’s modulus of living cells [Citation29].
In , a selection of most common contact mechanics models is presented as Eq. 2–7 to interpret F vs. d and extract Young’s modulus E by fitting the AFM experimental data. Several reviews are focused on the selection of correct contact mechanics model (interested readers can retrieve extensive information in [Citation17,Citation36,Citation37]), here we want to focus on the operational routine to extract Young’s Modulus, addressing its justification and pointing the direction to alternative models if needed.
Table 1. | Selection of contact mechanics models for sphere geometry. The parameters are F force, indentation, E Young’s modulus, R probe radius,
Poisson’s ratio, a contact area radius, FAD adhesion force, h thickness of sample and
FTC correction parameter
For spherical probes, the most used is Hertz model of Eq. 2 [Citation38], relative to a hard sphere indenting a semi-infinite elastic plane. This model is affected by harsh limitations to be carefully considered upon application on living cells: sample material should be linear elastic, homogeneous, isotropic, showing negligible viscosity and adhesion, thickness of sample must be large compared with indentation , while same indentation must be small in comparison with probe radius
.
The model developed by Sneddon in Eq.3 for a sphere is not expressed in closed analytical form [Citation39], it can be used for large indentation and reassimilated to Hertz in the limit . A comparison is shown in where Hertz and Sneddon (sphere) models are used to describe different indentation levels in function of sphere radius for 3 different applied forces and considering linear elastic sample with E = 200 Pa and Poisson’s ratio = 0.5. The relative discrepancy between two models can reach 10% considering R = 5 μm and force F = 10 nN, while milder conditions cause a negligible discrepancy considering the experimental error.
Figure 3. Contact mechanics models for Young’s modulus. a) Comparison of Hertz and Sneddon models for a 200 Pa sample varying force, indentation and probe radius. Reproduced with permission from [Citation30]. b) Young’s modulus map from same RAW264.7 cell of obtained with Hertz model (Eq. 2) c) Example of indentation curves with FTC fit for cell body and periphery d) Histogram of Young’s modulus values from Hertz and FTC model e) Young’s modulus map from same RAW264.7 cell of obtained with Hertz model f) example of stiffness tomography of a line in panel (e) dividing indentation in 100 intervals
![Figure 3. Contact mechanics models for Young’s modulus. a) Comparison of Hertz and Sneddon models for a 200 Pa sample varying force, indentation and probe radius. Reproduced with permission from [Citation30]. b) Young’s modulus map from same RAW264.7 cell of Figure 2 obtained with Hertz model (Eq. 2) c) Example of indentation curves with FTC fit for cell body and periphery d) Histogram of Young’s modulus values from Hertz and FTC model e) Young’s modulus map from same RAW264.7 cell of Figure 2 obtained with Hertz model f) example of stiffness tomography of a line in panel (e) dividing indentation in 100 intervals](/cms/asset/40ff3699-85a2-4a82-b66b-4c8945743ddf/tapx_a_1866668_f0003_oc.jpg)
As shown in , the adhesion between probe without functionalization is small compared with applied force for most of cell lines, therefore it can be safely neglected. If high adhesion is encountered Derjaguin–Müller–Toporov (DMT [Citation40], Eq. 4) and Johnson–Kendall–Roberts (JKR [Citation41], Eq. 5) models can be used, respectively, in cases of small and large adhesion.
The Hertz’s approximation based on sample thickness much larger than indentation and radius is critical for measurement on cells, especially for thin peripheral region of cell. An example in shows the Young’s modulus map obtained using Hertz model of Eq. 2, highlighting periphery with large modulus, while single force curves are depicted in . As in this case, the condition of infinite thickness is not satisfied, and the influence of a rigid substrate is misleading the quantitative results of Young’s modulus. The finite thickness correction (FTC) is used to introduce an approximation dependent on thickness, probe radius and indentation, as polynomial expansion of FTC correction parameter , and considering sample bound to substrate (Eq. 6) or free to move (Eq. 7) [Citation42]. Generally, cells use dynamic focal adhesion points to adhere to substrate, therefore cells are in an intermediate boundary conditions and coefficients of Eqs. (6) and (7) can be averaged to obtain the most suitable model [Citation30]. The final fit using this approach is shown in , while, the comparison of Young’s moduli histograms from results of simple Hertz and FTC are shown in . Clearly, FTC is essential and irregular distributions collapse in one single peak after removing the influence from substrate allowing the correct use of a large area of the cell ( shows the FTC corrected map). Notice that for large h and shallow indentation, finite thickness correction can be assimilated to Hertz. Finite thickness correction was also designed for sharp indenter [Citation43,Citation44], while, recently, a general theory to consider finite thickness effect in force-indentation experiments was developed and validated with finite element simulations [Citation45].
It should be pointed out that the selected model and corrections should be always contextualized within the biophysical experiments in consideration: viscosity, anisotropy, non-linearity can play very important role and more complex contact mechanics model is required when necessary. The first clue to understand the correct deployment of contact model is the fitting quality on experimental AFM data. Unfortunately, deviances on interpretation model can be subtle, leading to hardly detectable shifts of absolute values.
An example is viscosity, often neglected in force spectroscopy because slow loading forces are applied. While indenting through the matrix of cortical actin cytoskeleton, the liquid viscous cytoplasm is displaced leading to deviation from perfectly elastic behaviour. The effect of viscosity is becoming more visible at higher speed and the separation between approaching/retracting curve is increasing as indication of viscoelastic effect.
A methodology and contact model to obtain viscoelastic mechanical parameters of cells using AFM nanoindentation experiments was recently proposed [Citation46]. Using power-law rheology (PLR) relaxation model, several cell lines were analyzed, for example, highlighting malignant cancer cells softer and more viscous than benign counterparts. Implementing the finite thickness correction on rheological model [Citation47], Garcia et al. developed an analytical model to describe the viscoelastic nature of living cells on a rigid support [Citation48], showing the viscoelasticity parameters of fibroblasts dependent with indentation speed. Fractional Kelvin-Voigt model in the form of double power law rheology was also used as theoretical model of slow and fast relaxation components of cell cytoskeleton under time-dependent stress [Citation49]. Highlighting the correlation between cell nanomechanics and biological function, it was evidenced that collective cells’ migration speed and their invasive rate are inversely proportional with cell stiffness.
Finally, relative to the vertical heterogeneity of living cells we point out the so-called stiffness tomography obtained by sectioning the indentation curve and fitting the modulus with standard contact models, evidencing the presence of stiffer cytoskeletal bundles beneath cell surface [Citation50–52]. Contrast by stiffness tomography was used to visualize and obtain mechanical feedback about mitochondria and Golgi apparatus without specific staining [Citation53]. Rheological model was applied on stiffness tomography for fibroblast cells localizing actin bundle fibers under cell surface or nucleoli within nucleus structure from the contrast of different hydrodynamic drag [Citation54]. This interesting approach can visualize mechanical properties of materials with different phases at micro-nano level even at ultralow stiffness [Citation55], still the mathematical interpretation is ill-defined, in fact, the convolution of elastic response of different phases must be considered for a correct quantification [Citation28]. A different approach is required to quantify the vertical heterogeneity in living cells.
III. Coupling with Finite Element Simulations
As mentioned in the previous section, the Young’s Modulus of internal parts in heterogeneous system is one of the most difficult things to achieve in contact mechanics experiments. Complex geometry and convolution of different material properties are the main obstacles to achieve internal modulus in a quantitative way. When highly complex mathematical problems cannot be converted in analytical solutions, computational methods, such as finite element models (FEM), represent a viable and useful alternative [Citation56].
Finite element models (FEM) have been widely used to simulate AFM indentation on biological specimen to resolve convolution and quantify the Young’s Modulus of heterogeneous materials system [Citation57–59]. The process of finite element modelling usually includes defining the geometry and material properties of the system, applying boundary conditions and external forces, calculating load-displacement relations. When constructing finite element models, there are many aspects to consider for revealing the underlying complication associated with AFM indentation, for instance, the constitutive parts (from homogeneous to heterogeneous model), the constitutive model of elements (linear elastic v.s. viscoelastic and hyperelastic) and finally model symmetry (2D model v.s. 3D model and material anisotropy).
A single cell consists of many heterogeneous parts; therefore, simplifications of models are used to group elements with similar elasticity. Most simplified numerical models treat the living cells as homogeneous continuum with special geometry [Citation59,Citation60], while other models treat the living cell as a three-phase structure (cell membrane, cytoskeleton and nucleus) [Citation57], or a two-phases by grouping cell membrane and cytoskeleton [Citation21]. Such simplification is allowed because membrane and cortical cytoskeleton are both spread through the whole topological surface of the cell, as opposed to the cell nucleus, which is spatial sensitive.
McGarry et al [Citation58]. included cytoskeleton, cytoplasm, nucleus and membrane components in their finite element model for investigating the influence and contribution of various cellular components on overall stiffness and cellular stability. Material properties for each cell comportments are not universally known or easy to achieve and need estimation by various approaches. Caille et al [Citation60]. has reported the contribution of the nucleus to the mechanical properties of endothelial cells by performing compression tests on individual endothelial cells and separated nuclei. The measurement of the uniaxial force applied to the cell and the resulting deformation allow them to compute precisely the mechanical properties of the cell and those of the nucleus. The possibility to build a model with well-defined constitutive laws for every mesh element allows the exploration of elastic properties of living cell in terms of viscous and hyperelastic behaviour. A semi-empirical model was proposed to determine the viscoelastic properties of spherical living cells at large deformation, in turn demonstrating improved consistency between model and AFM experimental data [Citation46,Citation59]. The proposed models have proven to enable a more consistent and accurate determination of the viscoelastic properties of the cells with the mechanical responses of the cells from experiments. Surpassing the concept of ideal linear elasticity, it was ascertained that living cells under stress-strain conditions share characteristics like hyperelastic (neo-Hookean) [Citation56,Citation57]. Also models considering both viscoelastic and hyperelastic behaviours were considered to improve the constitutive elements model [Citation61].
In this framework, the accuracy of a model is established by the ability to reproduce AFM experimental data, i.e. the force vs. indentation curves. The model is therefore built using geometry of cell directly extract from AFM cell morphology, while mechanical parameters and boundary conditions (sliding/friction of different interfaces) are only estimated by AFM and optimized by FEM. This coupled optimization is performed by performing a series of finite element simulation variating parameters (such as material properties and internal geometries) and minimizing the difference with AFM experimental data [Citation21]. An inverse-optimization method is also popular in experiment/simulation coupling studies, in which the value of Young’s modulus of cell components were adjusted by comparing with experimental data in each step thus finally converge to the optimized results [Citation56,Citation61].
As an example of this process, we show the deconvolution of mechanical properties of metastasis cancer cell MDA-MB-231 in . High malignancy is reflected by a highly dynamic cytoskeleton appearing disordered and softer than less malignant cell lines, therefore granting a good compromise in heterogeneity: ‘homogeneous’ cell body and stiffer nucleus. For this reason, the difference between the cell body and nucleus is very visible during indentation, and FEM simulations can be designed effectively.
Figure 4. Results of mechanical analysis for MDA-MB-231. (a) Morphology map at zero force. (b) Force vs indentation curves for points 1 and 2, comparing AFM results and FEM simulations. (c) Young’s modulus map on a logarithmic scale at high indentation. (d) Apparent Young’s modulus vs indentation for points 1 and 2, comparing AFM results and FEM simulations. (e) Symmetric (up) and asymmetric (down) normal stress fields for FEM simulations on top and near nucleus region. Reproduced with permission from [Citation21]
![Figure 4. Results of mechanical analysis for MDA-MB-231. (a) Morphology map at zero force. (b) Force vs indentation curves for points 1 and 2, comparing AFM results and FEM simulations. (c) Young’s modulus map on a logarithmic scale at high indentation. (d) Apparent Young’s modulus vs indentation for points 1 and 2, comparing AFM results and FEM simulations. (e) Symmetric (up) and asymmetric (down) normal stress fields for FEM simulations on top and near nucleus region. Reproduced with permission from [Citation21]](/cms/asset/6b6ca889-4977-4672-9cdc-45b5a6ead11d/tapx_a_1866668_f0004_oc.jpg)
The mechanical map at high indentation (70−100%) shown in shows only an increase in the Young’s modulus at +50% compared to the cell body, and after mechanical deconvolution through FEM/AFM simulation, this highlights an increase of up to +200%. Final examples of force curves and E vs indentation on body cell and nucleus, overlapping the FEM simulation with optimized parameters, are shown, respectively, in . In particular, after fixing geometry and material properties in the model, 3D-FEM visualized (confirmed by AFM) lateral displacement of nucleus upon indentation on non-axisymmetric point. In this way, every force curve from the AFM map could be simulated accurately by explicitly taking into account its position within the cell.
As we will present in the next section, AFM and FEM can be combined to investigate cell nanomechanics and cytoskeletal restructuration when interacting with nanostructures (substrate and internalized nanoparticles).
IV. Case studies: nanomechanics of cells interacting with nanostructures
Interaction with Substrate
An exciting research direction of cells nanomechanics is devoted to the interaction of cells with extracellular matrix (ECM). Most cells in multicellular organisms are embedded in tissues composed of other cells or extracellular matrices with well-defined elastic moduli [Citation62]. The composition of ECM defines its biophysical configuration determining specific mechanical and structural properties [Citation63,Citation64]. Cells mechanical properties and cytoskeleton reorganization on hard and flat substrates (such as glass/plastic petri dish) are different from cells in natural micro environment having peculiar roughness and elasticity. For example, naive mesenchymal stem cells (MSCs) are very sensitive to tissue elasticity expressing different phenotypes [Citation65]. Soft ECMs mimicking brain tissue drive neuronal phenotype, intermediate stiff matrices that mimic muscle express myoblasts, and hard ECMs express osteoblasts by mimicking bone tissue. Through mechanotransduction processes, cells can perceive the physical-chemical clues of environment and convert such stimulus biologically, for instance reorganizing the cytoskeleton and regulating cell behaviour [Citation66]. Therefore, the possibility to regulate cells microenvironment by changing its physical-chemical properties is increasingly important to produce biomaterials encoding the proper characteristics to mimic in-vivo ECMs [Citation67]. Roughness and stiffness are important parameters synergically able to promote mechanotransduction pathway, for example, driving osteogenic differentiation of MSCs on hydrogels with controlled stiffness and roughness [Citation68].
For this reason, AFM-based technology was used to elucidate the mechanical basis of the cellular structure during interaction with the ECM including cell to cell interaction is a hot research topic (see for example [Citation69–72]). ECM has a critical role in regulating tumour cell properties and behavior. For example, the mechanotransduction event was discovered to be responsible in triggering the promotion to metastasis, greatly enhancing migration, invasivity and mobility [Citation73–75]. Considering the nanotopography of substrate, AFM nanomechanics of MDCK cells on different nanopatterned PDMS surface (1D ridges and 2D pits) showed a decreased organization of F-actin and lower Young’s modulus than counterpart on flat surface [Citation76]. Focal adhesion regions were mainly found on top of nanopatterned, influencing spreading and morphology of cytoskeleton, in turn, leading to less density of F-actin fibres aggregation.
Another interesting example involves the activation/differentiation of immune system cells, such as macrophages, by mechanotransduction events derived physical properties of ECM. For example, phenotype M2 in macrophages has elongated linear shape, involved in the resolution of inflammation, tissue regeneration, angiogenesis but also promotion of tumour microenvironment [Citation77,Citation78]. Constraining undifferentiated M0 phenotype in 1D linear geometries by ridges micropatterning was demonstrated to promote M2 phenotype polarization without the need of chemical stimuli [Citation79,Citation80].
As practical example where AFM was used to understand the effect of nanotopography and stiffness of substrate, we present case studies on neuronal cells. Integrin-mediated interaction with ECM has important role with neuron plasticity. For example, neuronal cells natural microenvironment has typical rigidity of brain (E < 1 kPa) therefore artificial substrate mimicking this feature are promoting viability and neuronal maturation and development [Citation81,Citation82]. Seemingly, the ECM topography is playing an important role and influencing the focal adhesion where cells are adhering. Integrin adhesion complexes (IAC) are responsible to transduce the mechanical-topographical features in force transmission through reorganization of cytoskeleton and actomyosin network. For instance, ‘molecular clutch’ model is considering the coupling of adaptor protein talin with actomyosin motor for transmission of force. For higher tension, talin can unfold binding vinculin, in turn recruiting components and reinforcing IAC formation [Citation83–85]. Indeed, AFM nanomechanics can be used successfully to quantify the reconfiguration of cytoskeleton induced by mechanotransduction events. For example, PC12 cells were cultivated on flat () and disordered cluster-assembled nanoporous () zirconia showing, respectively, a decrease of Young’s modulus (comparing ) [Citation66]. This finding was supported and confirmed by fluorescence microscopy analyzing IAC points staining vinculin with green as marker of focal adhesion points and actin cytoskeleton in red. Flat surface induces large focal adhesion regions (green colour and white arrows in ) and large recruitment of f-actin fibres (red colour and white asterisks in ). Conversely, on nanostructured zirconia only few and small size focal adhesion regions are visible () and marked reduction of f-actin fibres () as main responsible of decreased Young’s Modulus.
Figure 5. Elasticity of neuronal cells on nanostructured substrate. AFM topography (a) and correspondent Young’s Modulus map (b) of living PC12 cells after 24 h seeding on flat zirconia. TIRF microscopy image of fixed PC12 with vinculin staining (c) and f-actin staining in epifluorescence. White arrows show focal adhesion regions and white asterisks f-actin bundles. Using the same order of images, PC12 cells seeded on rough zirconia (e-h). Average Young’s Modulus (i) for PC12 on flat and rough zirconia and on glass covered by poly-l-lysine with/without NGF. Reproduced with permission from [Citation66]
![Figure 5. Elasticity of neuronal cells on nanostructured substrate. AFM topography (a) and correspondent Young’s Modulus map (b) of living PC12 cells after 24 h seeding on flat zirconia. TIRF microscopy image of fixed PC12 with vinculin staining (c) and f-actin staining in epifluorescence. White arrows show focal adhesion regions and white asterisks f-actin bundles. Using the same order of images, PC12 cells seeded on rough zirconia (e-h). Average Young’s Modulus (i) for PC12 on flat and rough zirconia and on glass covered by poly-l-lysine with/without NGF. Reproduced with permission from [Citation66]](/cms/asset/13855c1f-36df-4ebd-912e-4f816a10863b/tapx_a_1866668_f0005_oc.jpg)
As evinced by a neurite outgrowth was detected even in absence of chemical stimulus (nerve growth factor NGF), suggesting that nanoscopic architecture is driving neuronal maturation though a different pathway involving the sensing of environment through mechanotrasductive events. This was confirmed by extensive proteomic analysis, highlighting different regulation in the proteins involved in the IAC points [Citation66,Citation86,Citation87].
Similar mechanotransduction event on nanotopography was experimented on hippocampal neurons cultured on cluster-assembled surfaces, in turn, showing enhanced ability to maturate and reach functionality [Citation87]. This research may imply neurodegenerative disease, especially when aberrant ECM is influencing the correct neuronal development. Finally, we highlight a recent AFM development in this field by reversing the investigation approach by using large micrometric probes covered by nanostructured film [Citation88]. Analysis of spatiotemporal adhesion dynamics during AFM force spectroscopy allowed to follow early mechanotransduction events between cell and nanostructured probe surface, highlighting excessive force loading, in turn decreasing the number of adhesion sites.
Interaction with nanoparticles
Another interesting topic where nanomechanics can make a difference in understanding the biophysics of cells will be dedicated to the interaction of macrophages with nanoparticles. Macrophages are professional cells of immune system mainly involved to clean foreigner bodies by internalization through endocytosis or phagocytosis. Such processes are relying on biomolecular signalling in close relation with restructuration of cytoskeleton acting as motor [Citation89–91]. The investigation of mechanical properties of cytoskeleton is functional to understand its correlation with morphological changes and fulfil their physiological functions.
Another important aspect is the connection of modified mechanical properties of macrophages with the occurrence of pathological status. For example, dysregulation of mechanical properties is involved in the initial steps of atherosclerosis [Citation79,Citation92], and activation of immune system [Citation93,Citation94], while the influence of ECM on macrophages is involved in tumorigenesis [Citation95–97].
The modification of mechanical properties of macrophages to achieve their physiological functions is usually regulated by cytoskeleton reorganization. When using lipopolysaccharide (LPS, major component of the outer membrane of Gram-negative bacteria) to trigger the inflammatory M1 phenotype differentiation, an increase in the elastic modulus of macrophage is observed [Citation98,Citation99]. Xi Chen. et al. discovered that human monocyte-derived macrophage THP-1 cells exerted up to approximately 360 kPa on exotic capsules during internalization [Citation100], indicating a mechanical variation inside macrophage caused by particle. The mechanical signals during such mechanical activity were reported to be transmitted by cytoskeletal filaments such as actin and microtubules, routed by rearrangements of the cytoskeletal network, and transduced into biochemical signals by force-sensitive proteins [Citation101]. Macrophages upon infection undergo restructuration of actin cytoskeleton [Citation102,Citation103]. Chen et al. used exosomes from colorectal cancer (CRC) to stimulate tumoricidal macrophages, highlighting the importance in restructuration of cytoskeleton during proteome transport [Citation104].
Considering inorganic nanoparticles, internalized silver nanoparticles caused cytoskeleton stiffening upon low to medium uptakes, while high uptake disintegrated the actin network resulting in cytotoxicity [Citation105]. It was also reported that macrophages interacting with ZnO nanoparticles showed a decrease in cytoskeleton stiffness [Citation106,Citation107]. In general, nanoparticles cytotoxicity is initiated by increased oxidative stresses, followed by protein redox modifications such as actin filaments disassembly and inflammatory cascade leading to cell death pathways [Citation108]. Nevertheless, the restructuration of cytoskeleton triggered by nanoparticles below toxicity level is not well understood, especially which mechanisms responsible for the change in cell elasticity.
Actin fibres are constantly recruited and reabsorbed dynamically to allow phagocytosis machinery. Mechanical property of internalized organic fibers induced the redistribution of actin filament inside macrophage, in turn, the redistributed actin compressed the nanofibers resulting in their deformation [Citation109]. Interestingly, such actin redistribution can be detected by atomic force microscopy (AFM) nanomechanical investigation [Citation110]. Fluorescent PLGA-PEG nanofibers were fed to RAW 264.7 macrophages and colocalized by performing optical () and fluorescence () microscopy in combination with AFM morphology () and Young’s modulus () measurements. Increase of stiffness was colocalized by fluorescence microscopy showing presence of internalized nanofibers in macrophage cell. The nanofiber induced local increase of stiffness clearly visible in the Young’s modulus map but hidden in standard morphology. Moreover, confocal laser scanning microscopy (CLSM) revealed a thickening of actin filaments around nanofibers during internalization process. Following geometry and mechanical properties by AFM, finite element model simulation model was built to obtain additional information. FEM predicted the inclusion of additional wrapping layer around nanofiber, identified as actin mesh network, to achieve similar reaction force of AFM experiments, consistent with confocal observation [Citation110].
Figure 6. PLGA-PEG nanofibers internalized by RAW264.7 macrophage. (a) optical transmission image, (b) fluorescence image, (c) AFM height image, (d) Young’s Modulus mapping. White circle highlights position of nanofiber. (e) Confocal laser scanning microscopy (CLSM) images of fixed cells showing nanofibers and actin distribution (Scale bar: 10 µm. Blue: DAPI for nuclei, green: Phalloidin for actin, red: Nile Red for nanofibers, white arrow shows actin wrap around nanofiber). f) Normal stress field plot for FEM indentation of nanofiber wrapped by 500 nm layer. d) AFM force curves on top of nanofiber (blue triangles) and on cell body (black circles), overlapped with FEM simulations of cell body (purple-dotted line), cell with nanofibers (red-dashed line), and cell with nanofibers wrapped by actin (green solid line). Reproduced with permission from [Citation110]
![Figure 6. PLGA-PEG nanofibers internalized by RAW264.7 macrophage. (a) optical transmission image, (b) fluorescence image, (c) AFM height image, (d) Young’s Modulus mapping. White circle highlights position of nanofiber. (e) Confocal laser scanning microscopy (CLSM) images of fixed cells showing nanofibers and actin distribution (Scale bar: 10 µm. Blue: DAPI for nuclei, green: Phalloidin for actin, red: Nile Red for nanofibers, white arrow shows actin wrap around nanofiber). f) Normal stress field plot for FEM indentation of nanofiber wrapped by 500 nm layer. d) AFM force curves on top of nanofiber (blue triangles) and on cell body (black circles), overlapped with FEM simulations of cell body (purple-dotted line), cell with nanofibers (red-dashed line), and cell with nanofibers wrapped by actin (green solid line). Reproduced with permission from [Citation110]](/cms/asset/59313737-2cc1-4973-b935-d03345e6fb01/tapx_a_1866668_f0006_oc.jpg)
Prospective investigations may focus on mechanotransduction events upon mechanical modulation of internalized nanoparticles. For example, using nanoparticles having bending modulus near typical values of actin matrix stiffness (1000–2000 Pa) is expected to drive detectable deformation of nanoparticle within the cytosol. The deformation triggered by cytoskeleton can be used in principle as the mechanism for specific release of drugs. For these advanced problems, the application of combined AFM, FEM and CLSM is essential to deconvolve the stress-deformation curves on composite heterogeneous systems and, finally, highlight the dynamics involved during reorganization of cytoskeleton.
V. Perspective and Future
High Resolution
A well-known drawback of Young’s modulus determination by AFM nanoindentation is the slow speed of investigation, for instance, a typical 64 × 64 force volume imaging can take 20–40 minutes, depending on the frequency of force curve (usually f < 10 Hz).
Interestingly, developments of AFM technology allow to perform nanomechanical experiments at higher speed. High-resolution mapping of mechanical properties is a valuable tool when investigating phenomena such as cell migration, division or evolution. The faster, higher resolution mapping made allows more detailed mapping of these processes as they occur. The limited duration of these processes and cell lifetime make speed of acquisition a critical component of many experiments. For instance, PeakForce Quantitative NanoMechanics (PF-QNM) can work 3–4 order of magnitude faster producing high-resolution maps of mechanical properties in correlation with morphology. In PF QNM continuous sinusoidal force curves are performed at higher frequency (f ≈ 1 KHz) while probe is scanning the surface. show an example of morphology and Young’s modulus map of living human umbilical vascular endothelial cells (HUVECs) with high spatial resolution [Citation111]. Actin stress fibres at cell periphery and nuclear region can be easily detected from topography. Mechanical features at subcellular level in heterogenous cells can be resolved and different mechanical properties can be distinguished and quantified [Citation54]. For example, applying small forces, the surface structure of living kidney cells were observed evidencing microvilli consisting in plasma membrane-covered actin bundles stabilized by crosslinking proteins [Citation112].
Figure 7. Mechanical properties of cells at high resolution and combined with optical microscopy. Representative PF QNM mapping images of HUVECs cells showing a) topography and b) Young’s modulus overlapped to 3D morphology. Reproduced with permission from [Citation111]. Multi-harmonic imaging of a live rat fibroblast cell scanned using a Lorentz force excited microcantilever showing c) topography, d) static deflection, e) amplitude of first harmonic, f) phase shift of first harmonic, g) storage modulus, h) loss modulus. Reproduced with permission from [Citation118]. AFM mechanics with correlative light-sheet fluorescence microscopy (LSFM) showing i) schematic representation of AFM bead approaching macrophage and h) side view from LSFM imaging of macrophage attempting to engulf the AFM probe. Reproduced with permission from [Citation127]
![Figure 7. Mechanical properties of cells at high resolution and combined with optical microscopy. Representative PF QNM mapping images of HUVECs cells showing a) topography and b) Young’s modulus overlapped to 3D morphology. Reproduced with permission from [Citation111]. Multi-harmonic imaging of a live rat fibroblast cell scanned using a Lorentz force excited microcantilever showing c) topography, d) static deflection, e) amplitude of first harmonic, f) phase shift of first harmonic, g) storage modulus, h) loss modulus. Reproduced with permission from [Citation118]. AFM mechanics with correlative light-sheet fluorescence microscopy (LSFM) showing i) schematic representation of AFM bead approaching macrophage and h) side view from LSFM imaging of macrophage attempting to engulf the AFM probe. Reproduced with permission from [Citation127]](/cms/asset/3b0a457b-97cf-4b8b-be68-2183232427f5/tapx_a_1866668_f0007_oc.jpg)
Another interesting approach to achieve higher resolution is bimodal AFM by simultaneously exciting the cantilever with two harmonics. While the first harmonic is frequency-locked and used to measure morphology as in standard tapping mode, the second harmonic is amplitude locked and used to retrieve mechanical properties (such as Young’s modulus) observing frequency shift and using appropriate contact mechanics model. This mode locking is a special case of bimodal AFM called AM-FM where Young’s modulus map with high-spatial resolution can be achieved in 1:1 correspondence with topography. This methodology is currently well-developed in material science (hard surfaces, polymers) [Citation113–115], only recently explored in biology. The instability of conventional tapping mode in liquid environment by piezoelectric driving was a stumbling block and different actuation mechanism such as photothermal or magnetic excitation are now available. The majority of biological AFM bimodal investigation were performed on biomolecules and thin layers, only few works are dedicated to living cells [Citation116–119]. As example we present fast quantitative nanomechanical properties maps of rat fibroblasts cells in , showing, respectively, topography, static deflection, amplitude and phase of first harmonic and storage and loss modulus (proportional to Young’s modulus and viscosity) [Citation118]. Fine details of subsurface features such as actin filament bundles (stress fibers) and the nuclear complex are clearly displayed in the physical property maps.
In spite of the advantages in high-speed mechanical mapping, there are several open issues to be clarified when applying PF QNM and AMFM modes. These techniques provide high-resolution Young’s modulus of cells with quantification several times larger than quasi-static (force vs. indentation) approach. Cellular viscoelasticity is playing an obvious effect when probe is applying stress to cell with high-frequency excitation, inducing cell stiffening. Moreover, poor definition of contact mechanics on small indentation length can cause non-negligible deviations. Interestingly a comparison between AFM indentation and dynamic AFM was performed by Cartagena et al [Citation119]. rising awareness in interpretation of measurements considering frequency and indentation to retrieve mechanical properties of living cells. We are confident that prospective studies using high-resolution AFM will always be compared with standard and well-accepted methods, while providing solutions to quantification issues, for example choosing special cantilever and probes and using new interpretation models.
AFM Combined with Advanced Optical Imaging
The versatility of AFM in biology and ability to work in liquid with alive cells open the possibility to integrate the technique with optical microscopy to achieve correlative microscopy. In this framework, mechanical properties by AFM and biological characterization by fluorescence labelling can be colocalized. An example of colocalization AFM-optical-fluorescence is already shown in , while in this section we want to give a perspective of innovative application of advanced optical imaging with AFM nanomechanics. A recent review summarized advanced optical microscopy solutions in combination with AFM [Citation120]. Beside low speed, an inherent drawback of AFM is the lack of specificity often requested in biology to visualize and follow the dynamics of intracellular molecules and organelles. While standard fluorescence microscopy (such as confocal laser scanning microscopy, CLSM) can hardly achieve molecular resolution because of diffraction limit, super-resolution techniques such as stimulated emission depletion (STED), stochastic optical reconstruction microscopy (STORM) or Super-Resolved Structured Illumination Microscopy (SR-SIM) [Citation121], overcome this limitation. For example, Diaspro et al. correlated AFM topography with super-resolution fluorescence STED [Citation122]. STED allowed high-resolution monitoring simultaneously with nanomanipulation by AFM for example cutting single filaments of the cytoskeleton [Citation123,Citation124]. Moreover, it was found STED reveals only selected configurations of -amyloid fibrillar aggregates labelled with fluorophores, while AFM revealed all aggregate by without specificity [Citation125].
Along with optical microscopy, other associated technique involving laser light application can be implemented on AFM platform. This is the case Raman spectroscopy, that in combination with electric field enhancement by sharp metallic probe, can achieve the so-called, tip-enhanced Raman spectroscopy (TERS). This technique was applied to living cells while scanning with AFM, highlighting potentiality to distinguish Raman spectra of different biomolecules within a living cell [Citation126].
So far, the combination of cell nanomechanics with advanced optical microscopy is still in infancy and we want to raise awareness to biomechanical modification when fluorophores and laser light are applied to living cells. In this framework, Nelsen et al [Citation127]. designed a coupling of high-resolution, volumetric imaging by light-sheet fluorescence microscopy (LSFM) with time-correlated force measurements. As shown in a RAW264.7 macrophage was approached by an AFM probe, and subsequently measured while attempting to engulf it. LFSM was employed to capture the evolution of actin during the engulfing process while AFM was measuring the force applied by cell (). The force exerted by phagocytic cup was detected as maximum of 4 nN force was detected correspondent to 70 Pa of surface stress. Increase of actin intensity was colocalized in the region of phagocytic cup formation in correlation with the necessary engulfment forces. Moreover, complex whole-cell fluctuation of actin was detected during mechanotrasduction events in phagocytosis.
Although correlative AFM is extremely powerful especially in life science field, we want to highlight the current bottlenecks in the development. Considering advanced optical systems, the integration with AFM represents a technical hurdle, especially designing the optical path while maintaining low noise required by AFM requires great care. Another open issue is to improve colocalization between AFM and super-resolution microscopy, requiring metrology of well-calibrated objects in the two techniques and strong computation efforts in post-data analysis. For instance, automatic image recognition by deep neural networks (described in next section) is expected to deliver faster and automatic solutions for this issue.
Deep Neural Networks and Artificial Intelligence
AFM experiments in form of force spectroscopy on regular matrix can access to an enormous quantity of data most of which is usually discarded due to complexity in the mathematical model representation. For example, the raw data output can be represented by a 3D matrix (also called hyperspectrum of force) usually between 60 and 600 Mbytes, definitely in Big Data field. One of the best methods to extract useful information from big datasets is definitely Deep Neural Networks (DNNs) thanks to their performance (using parallel computing) to achieve dimensionality reduction and classification. The use of DNN is expected to retrieve more reliable mechanical biomarkers and deliver classification results for diagnostic with high speed and precision.
Despite these advances in the application of neural networks in biomechanics, there are limited works applied to AFM image in biology. A work from Solokov et al [Citation128]. represents a novel strategy using neural networks in biological AFM to classify prostate cancer. In contrast to the standard analyses, they applied neural networks not to each image directly but to the sets of surface parameters (e.g., roughness, directionality, fractal properties, etc.) derived for each image. The considered parameters are used in engineering to describe material surfaces. The use of the parameters instead of images substantially decreases the dimension of the data space, and therefore allows avoiding the problem of bigdata analysis, the need for a large size of the training set. The approach is interesting but applied only to morphological features.
Concerning the mechanical properties of cells, Nyberg et al [Citation129]. used single-cell microfluidic method, focused on quantitative deformability cytometry, to measure several physical biomarkers including elastic modulus, cell fluidity, transit time, cell size, and maximum strain. By training a machine learning algorithm, they demonstrate that multiparameter analysis of physical phenotypes enhances the accuracy of classifying cancer cell lines compared to single parameters alone (). As unexplored gold mine, we prospect mechanical biomarkers by combining DNN technology to AFM nanoindentation methodology will prompt the development of a new direction in diagnostic imaging.
Figure 8. Deep Neural Networks coupled with cell biomechanics. (a) Methodology schematic of collection, sample preparation and detection analysis of prostate cancer cells by . (b) Optical image showing AFM probe and cell before imaging. The morphology of cell surface
by sub-resonance tapping mode is shown for normal (c) and cancer (d) specimens. Adapted with permission from [Citation128]. Confusion matrices showing the performance of the DNN algorithm for (c) cell transit time
, and (d) a set of parameters: elastic modulus
, transit time
, cell size
, and maximum strain
. Rows represent the true cell line; columns represent the predicted cell line. Colour scale denotes the proportion of cells predicted as each cell type. Adapted with permission from [Citation129]
![Figure 8. Deep Neural Networks coupled with cell biomechanics. (a) Methodology schematic of collection, sample preparation and detection analysis of prostate cancer cells by AFM+DNN. (b) Optical image showing AFM probe and cell before imaging. The morphology of cell surface 10 × 10 μm2 by sub-resonance tapping mode is shown for normal (c) and cancer (d) specimens. Adapted with permission from [Citation128]. Confusion matrices showing the performance of the DNN algorithm for (c) cell transit time δ, and (d) a set of parameters: elastic modulus E, transit time TT, cell size Dcell, and maximum strain εmax. Rows represent the true cell line; columns represent the predicted cell line. Colour scale denotes the proportion of cells predicted as each cell type. Adapted with permission from [Citation129]](/cms/asset/c52703a3-e06a-4d57-ac32-d2e7b374f640/tapx_a_1866668_f0008_oc.jpg)
VI. CONCLUSION
The investigation of mechanical properties of living cells by atomic force microscopy have attracted tremendous interest in the past few years. According to this, in this review, we highlight the latest developed or developing methods to achieve this goal, including the traditional mechanical data obtained by AFM’s nanoindentation and the interpretation of their corresponding force curve by different models, which are also combined with finite element simulations for better accuracy. In particular, case studies give examples and verify the application of such methods, study in deep of the interaction between cells and intercellular/intracellular micro environment in the mechanical aspect, revealing the drawbacks of current research and some sophisticated solution to be developed. Herein, it is worth to develop future AFM that is used as a combination of different operation modes, optical microscopy, and deep neural networks. It will help to simultaneously investigate the mechanics and morphology in versatile means, and intelligently interpret the obtained data.
Acknowledgments
Authors acknowledge the financial support from the National Natural Science Foundation of China (No. 21950410518 and 32071318), Shenzhen Basic Research Project (No. JCYJ20190807163007525), SIAT Innovation Program for Excellent Young Researchers (No. Y8G032) and Chinese Academy of Sciences President’s International Fellowship Initiative (No. 2019PM0006).
Disclosure statement
No potential conflict of interest was reported by the authors.
Additional information
Funding
References
- Li M, Xi N, Wang Y, et al. Advances in atomic force microscopy for single-cell analysis. Nano Res. 2018;12:p. p. 703–718.
- Harris MJ, Wirtz D, Wu PH. Dissecting cellular mechanics: implications for aging, cancer, and immunity. Semin Cell Dev Biol. 2019;93:p. p. 16–31.
- Phillip JM, Aifuwa I, Walston J, et al. The mechanobiology of aging. Annu Rev Biomed Eng. 2015;17:p. p. 113–141.
- Engel E, Michiardi A, Navarro M, et al. Nanotechnology in regenerative medicine: the materials side. Trends Biotechnol. 2008;26:p. p. 39–47.
- Markert CD, Guo X, Skardal A, et al. Characterizing the micro-scale elastic modulus of hydrogels for use in regenerative medicine. J Mech Behav Biomed Mater. 2013;27:p. p. 115–127.
- Pollard TD, Cooper JA. Actin, a central player in cell shape and movement. Science. 2009;326:p. p. 1208–12.
- Plodinec M, Loparic M, Monnier CA, et al. The nanomechanical signature of breast cancer. Nat Nanotechnol. 2012;7:p. p. 757–65.
- Crick SL, Yin FC. Assessing micromechanical properties of cells with atomic force microscopy: importance of the contact point. Biomech Model Mechanobiol. 2007;6:p. p. 199–210.
- Suresh S. Biomechanics and biophysics of cancer cells. Acta Biomater. 2007;3:p. p. 413–38.
- Dragovich MA, Fortoul N, Jagota A, et al. Biomechanical characterization of TIM protein-mediated Ebola virus-host cell adhesion. Sci Rep. 2019;9:p. 267.
- Kwon S, Lee D-H, Han S-J, et al. Biomechanical properties of red blood cells infected by Plasmodium berghei ANKA. J Cell Physiol. 2019;234:p. p. 20546–20553.
- Suresh S, Spatz J, Mills JP, et al. Reprint of: connections between single-cell biomechanics and human disease states: gastrointestinal cancer and malaria. Acta Biomater. 2015;23 Suppl:p. S3–15.
- Kim M-Y, Kim J-H, Cho JY. Cytochalasin B modulates macrophage-mediated inflammatory responses. Biomolecules & Therapeutics. 2014;22:p. p. 295–300.
- Patel NR, Bole M, Chen C, et al. Cell elasticity determines macrophage function. PLoS One. 2012;7:p. e41024.
- Wu PH, Aroush DR, Asnacios A, et al. A comparison of methods to assess cell mechanical properties. Nat Methods. 2018;15:p. p. 491–498.
- Butt H-J, Cappella B, Kappl M. Force measurements with the atomic force microscope: technique, interpretation and applications. Surf Sci Rep. 2005;59:p. p. 1–152.
- Garcia R. Nanomechanical mapping of soft materials with the atomic force microscope: methods, theory and applications. Chem Soc Rev. 2020;49:5850–5884.
- Lekka M, Laidler P, Gil D, et al. Elasticity of normal and cancerous human bladder cells studied by scanning force microscopy. Eur Biophys J. 1999;28:p. p. 312–6.
- Zemla J, Danilkiewicz J, Orzechowska B, et al. Atomic force microscopy as a tool for assessing the cellular elasticity and adhesiveness to identify cancer cells and tissues. Semin Cell Dev Biol. 2018;73:p. p. 115–124.
- Alibert C, Goud B, Manneville JB. Are cancer cells really softer than normal cells? Biol Cell. 2017;109:p. p. 167–189.
- Tang G, Galluzzi M, Zhang B, et al. Biomechanical heterogeneity of living cells: comparison between atomic force microscopy and finite element simulation. Langmuir. 2019;35:p. p. 7578–7587.
- Case LB, Waterman CM. Integration of actin dynamics and cell adhesion by a three-dimensional, mechanosensitive molecular clutch. Nat Cell Biol. 2015;17:p. p. 955–963.
- Cappella B, Dietler G. Force-distance curves by atomic force microscopy. Surf Sci Rep. 1999;34:p. p. 1–3, 5-104.
- Butt HJ, Jaschke M. Calculation of thermal noise in atomic force microscopy. Nanotechnology. 1995;6:p. p. 1–7.
- Sader JE, Lu J, Mulvaney P. Effect of cantilever geometry on the optical lever sensitivities and thermal noise method of the atomic force microscope. Rev Sci Instrum. 2014;85:p. 113702.
- Pirzer T, Hugel T. Atomic force microscopy spring constant determination in viscous liquids. Rev Sci Instrum. 2009;80:p. 035110.
- Schillers H, Rianna C, Schäpe J, et al. Standardized nanomechanical atomic force microscopy procedure (snap) for measuring soft and biological samples. Sci Rep. 2017;7:p. 5117.
- Galluzzi M, Tang G, Biswas CS, et al. Atomic force microscopy methodology and AFMech Suite software for nanomechanics on heterogeneous soft materials. Nat Commun. 2018;9:p. 3584.
- Galluzzi M, Biswas CS, Wu Y, et al. Space-resolved quantitative mechanical measurements of soft and supersoft materials by atomic force microscopy. Npg Asia Mater. 2016;8:p. e327.
- Puricelli L, Galluzzi M, Schulte C, et al. Nanomechanical and topographical imaging of living cells by atomic force microscopy with colloidal probes. Rev Sci Instrum. 2015;86:p. 033705.
- Shan Y, Wang H. The structure and function of cell membranes examined by atomic force microscopy and single-molecule force spectroscopy. Chem Soc Rev. 2015;44:p. p. 3617–3638.
- Dufrene YF, Pelling AE. Force nanoscopy of cell mechanics and cell adhesion. Nanoscale. 2013;5:p. p. 4094–104.
- Mescola A, Vella S, Scotto M, et al. Probing cytoskeleton organisation of neuroblastoma cells with single-cell force spectroscopy. J Mol Recognit. 2012;25:p. p. 270–7.
- Roduit C, Saha B, Alonso-Sarduy L, et al. OpenFovea: open-source AFM data processing software. Nat Methods. 2012;9:p. p. 774–5.
- Hermanowicz P, Sarna M, Burda K, et al. AtomicJ: an open source software for analysis of force curves. Rev Sci Instrum. 2014;85:p. 063703.
- Krieg M, Fläschner G, Alsteens D, et al. Atomic force microscopy-based mechanobiology. Nat Rev Phys. 2019;1:p. p. 41–57.
- Guz N, Dokukin M, Kalaparthi V, et al. If cell mechanics can be described by elastic modulus: study of different models and probes used in indentation experiments. Biophys J. 2014;107:p. p. 564–575.
- Borodich FM. The hertz-type and adhesive contact problems for depth-sensing indentation. Adv Appl Mech. 2014;47:p. p. 225–366.
- Sneddon IN. The relation between load and penetration in the axisymmetric boussinesq problem for a punch of arbitrary profile. Int J Eng Sci. 1965;3:p. p. 47–57.
- Derjaguin BV, Muller VM, Toporov YP. Effect of contact deformations on the adhesion of particles. J Colloid Interface Sci. 1975;53:p. p. 314–326.
- Johnson KL, Kendall K, Roberts AD. Surface energy and the contact of elastic solids. Proc R Soc A. 1971;324:p. p. 301–313.
- Dimitriadis EK, Horkay F, Maresca J, et al. Determination of elastic moduli of thin layers of soft material using the atomic force microscope. Biophys J. 2002;82:p. p. 2798–2810.
- Gavara N, Chadwick RS. Determination of the elastic moduli of thin samples and adherent cells using conical atomic force microscope tips. Nat Nanotechnol. 2012;7:p. p. 733–6.
- Santos JAC, Rebêlo LM, Araujo AC, et al. Thickness-corrected model for nanoindentation of thin films with conical indenters. Soft Matter. 2012;8:p. p. 4441–4448.
- Garcia PD, Garcia R. Determination of the elastic moduli of a single cell cultured on a rigid support by force microscopy. Biophys J. 2018;114:p. p. 2923–2932.
- Efremov YM, Wang W-H, Hardy SD, et al. Measuring nanoscale viscoelastic parameters of cells directly from AFM force-displacement curves. Sci Rep. 2017;7:p. 1541.
- Garcia PD, Garcia R. Determination of the viscoelastic properties of a single cell cultured on a rigid support by force microscopy. Nanoscale. 2018;10:p. p. 19799–19809.
- Garcia PD, Guerrero CR, Garcia R. Nanorheology of living cells measured by AFM-based force-distance curves. Nanoscale. 2020;12:p. p. 9133–9143.
- de Sousa JS, Freire RS, Sousa FD, et al. Double power-law viscoelastic relaxation of living cells encodes motility trends. Sci Rep. 2020;10:p. 4749.
- Roduit C, Longo G, Benmessaoud I, et al. Stiffness tomography exploration of living and fixed macrophages. J Mol Recog. 2012;25:p. p. 241–246.
- Longo G, Rio LM, Roduit C, et al. Force volume and stiffness tomography investigation on the dynamics of stiff material under bacterial membranes. J Mol Recog. 2012;25:p. p. 278–284.
- Roduit C, Sekatski S, Dietler G, et al. Stiffness tomography by atomic force microscopy. Biophys J. 2009;97:p. p. 674–677.
- Janel S, Popoff M, Barois N, et al. Stiffness tomography of eukaryotic intracellular compartments by atomic force microscopy. Nanoscale. The Royal Society of Chemistry (London, UK); 2019;11:p. p. 10320-10323.
- Guerrero CR, Garcia PD, Garcia R. Subsurface imaging of cell organelles by force microscopy. ACS Nano. 2019;13:p. p. 9629–9637.
- Schulte MF, Bochenek S, Brugnoni M, et al. Stiffness tomography of ultra‐soft nanogels by atomic force microscopy. Angew Chem. 2020; 132:p. p. 2-9.
- Nguyen N, Shao Y, Wineman A, et al. Atomic force microscopy indentation and inverse analysis for non-linear viscoelastic identification of breast cancer cells. Math Biosci. 2016;277:p. p. 77–88.
- Liu Y, Mollaeian K, Ren J. Finite element modeling of living cells for AFM indentation-based biomechanical characterization. Micron. 2019;116:p. p. 108–115.
- McGarry JG, Prendergast PJ. A three-dimensional finite element model of an adherent eukaryotic cell. European Cells and Materials. 2004;7:p. p. 27–33. [ discussion 33–4]
- Chen J, Lu G. Finite element modelling of nanoindentation based methods for mechanical properties of cells. J Biomech. 2012;45:p. p. 2810–6.
- Caille N, Thoumine O, Tardy Y, et al. Contribution of the nucleus to the mechanical properties of endothelial cells. J Biomech. 2002;35:p. p. 177–87.
- Wang L, Tian L, Zhang W, et al. Effect of AFM nanoindentation loading rate on the characterization of mechanical properties of vascular endothelial cell. Micromachines (Basel). 2020;11:p. 562.
- Levental I, Georges PC, Janmey PA. Soft biological materials and their impact on cell function. Soft Matter. 2007;3:p. p. 299–306.
- Chighizola M, Dini T, Lenardi C, et al. Mechanotransduction in neuronal cell development and functioning. Biophys Rev. 2019;11:p. p. 701–720.
- Schulte C. Cluster-assembled nanostructured materials for cell biology. In: Cluster beam deposition of functional nanomaterials and devices. Frontiers of Nanoscience (Elsevier, Netherlands); 2020. ;p. p. 271–289.
- Engler AJ, Sen S, Sweeney HL, et al. Matrix elasticity directs stem cell lineage specification. Cell. 2006;126:p. p. 677–89.
- Schulte C, Rodighiero S, Cappelluti MA, et al. Conversion of nanoscale topographical information of cluster-assembled zirconia surfaces into mechanotransductive events promotes neuronal differentiation. J Nanobiotechnology. 2016;14:p. 18.
- Garcia-Abrego C, Zaunz S, Toprakhisar B, et al. Towards mimicking the fetal liver niche: the influence of elasticity and oxygen tension on hematopoietic stem/progenitor cells cultured in 3D fibrin hydrogels. Int J Mol Sci. 2020;21:p. 6367.
- Hou Y, Yu L, Xie W, et al. surface roughness and substrate stiffness synergize to drive cellular mechanoresponse. Nano Lett. 2020;20:p. p. 748–757.
- Alcaraz J, Otero J, Jorba I, et al. Bidirectional mechanobiology between cells and their local extracellular matrix probed by atomic force microscopy. Semin Cell Dev Biol. 2018;73:p. p. 71–81.
- Gimenez A, Uriarte JJ, Vieyra J, et al. Elastic properties of hydrogels and decellularized tissue sections used in mechanobiology studies probed by atomic force microscopy. Microsc Res Tech. 2017;80:p. p. 85–96.
- Jorba I, Beltran G, Falcones B, et al. Nonlinear elasticity of the lung extracellular microenvironment is regulated by macroscale tissue strain. Acta Biomater; 2019;92:p. p. 265-276.
- Jorba I, Uriarte JJ, Campillo N, et al. Probing micromechanical properties of the extracellular matrix of soft tissues by atomic force microscopy. J Cell Physiol. 2017;232:p. p. 19–26.
- Mouw JK, Yui Y, Damiano L, et al. Tissue mechanics modulate microRNA-dependent PTEN expression to regulate malignant progression. Nat Med. 2014;20:p. 360.
- Rianna C, Kumar P, Radmacher M. The role of the microenvironment in the biophysics of cancer. Semin Cell Dev Biol. 2018; 73:p. p. 107- 114.
- Lu P, Weaver VM, Werb Z. The extracellular matrix: A dynamic niche in cancer progression. J Cell Biol. 2012;196:p. p. 395–406.
- Mollaeian K, Liu Y, Bi S, et al. Investigation of the effect of substrate morphology on MDCK cell mechanical behavior using atomic force microscopy. Appl Phys Lett. 2019;115:p. 063701.
- Ginhoux F, Schultze JL, Murray PJ, et al. New insights into the multidimensional concept of macrophage ontogeny, activation and function. Nat Immunol. 2016;17:p. p. 34–40.
- Wynn TA, Chawla A, Pollard JW. Macrophage biology in development, homeostasis and disease. Nature. 2013;496:p. p. 445–455.
- McWhorter FY, Davis CT, Liu WF. Physical and mechanical regulation of macrophage phenotype and function. Cell Mol Life Sci. 2015;72:p. p. 1303–16.
- McWhorter FY, Wang T, Nguyen P, et al. Modulation of macrophage phenotype by cell shape. Proc Natl Acad Sci U S A. 2013;110:p. p. 17253–8.
- Shao XY, Sørensen MH, Xia X, et al. Beading of injured axons driven by tension- and adhesion-regulated membrane shape instability. J Royal Soc Interface. 2020;17:p.168.
- Faroni A, Mobasseri SA, Kingham PJ, et al. Peripheral nerve regeneration: experimental strategies and future perspectives. Adv Drug Deliv Rev. 2015;82-83:p. p. 160–167.
- MacKay L, Khadra A. The bioenergetics of integrin-based adhesion, from single molecule dynamics to stability of macromolecular complexes. Comput Struct Biotechnol J. 2020;18:p. p. 393–416.
- Orre T, Rossier O, Giannone G. The inner life of integrin adhesion sites: from single molecules to functional macromolecular complexes. Exp Cell Res. 2019;379:p. p. 235–244.
- Kechagia JZ, Ivaska J, Roca-Cusachs P. Integrins as biomechanical sensors of the microenvironment. Nat Rev Mol Cell Biol. 2019;20:p. p. 457–473.
- Maffioli E, Schulte C, Nonnis S, et al. Proteomic dissection of nanotopography-sensitive mechanotransductive signaling hubs that foster neuronal differentiation in pc12 cells. Front Cell Neurosci. 2018;11:p. 417.
- Schulte C, Ripamonti M, Maffioli E, et al. Scale invariant disordered nanotopography promotes hippocampal neuron development and maturation with involvement of mechanotransductive pathways. Front Cell Neurosci. 2016;10:p. 267.
- Chighizola M, Previdi A, Dini T, et al. Adhesion force spectroscopy with nanostructured colloidal probes reveals nanotopography-dependent early mechanotransductive interactions at the cell membrane level. Nanoscale. The Royal Society of Chemistry (London, UK); 2020;27:p. p. 1-33.
- Vorselen D, Labitigan RLD, Theriot JA. A mechanical perspective on phagocytic cup formation. Curr Opin Cell Biol. 2020;66:112–122.
- Jain N, Moeller J, Vogel V. Mechanobiology of macrophages: how physical factors coregulate macrophage plasticity and phagocytosis. Annu Rev Biomed Eng. 2019;21:p.p. 267–297.
- Li J, Li Y, Gao B, et al. Engineering mechanical microenvironment of macrophage and its biomedical applications. Nanomedicine (Lond). 2018;13:p. p. 555–576.
- Liu XY, Yan F, Niu LL, et al. Strong correlation between early stage atherosclerosis and electromechanical coupling of aorta. Nanoscale. 2016;8:p. p. 6975–6980.
- Van den Bossche J, Saraber DL. Metabolic regulation of macrophages in tissues. Cell Immunol. 2018;330:p. p. 54–59.
- Murray PJ. Macrophage polarization. Annu Rev Physiol. 2017;79:p. p. 541–566.
- Hoffmann EJ, Ponik SM. Biomechanical contributions to macrophage activation in the tumor microenvironment. Front Oncol. 2020;10:p. 787.
- Kim H, Ishibashi K, Okada T, et al. Mechanical property changes in breast cancer cells induced by stimulation with macrophage secretions in vitro. Micromachines. 2019;10:p. 738.
- Kakoschky B, Pleli T, Schmithals C, et al. Selective targeting of tumor associated macrophages in different tumor models. Plos One. 2018;13:p. e0193015.
- Pi J, Li T, Liu J, et al. Detection of lipopolysaccharide induced inflammatory responses in RAW264.7 macrophages using atomic force microscope. Micron. 2014;65:p. p. 1–9.
- Zhao Y, Mahajan G, Kothapalli CR, et al. Sialylation status and mechanical properties of THP-1 macrophages upon LPS stimulation. Biochem Biophys Res Commun. 2019;518:p. p. 573–578.
- Chen X, Cui J, Ping Y, et al. Probing cell internalisation mechanics with polymer capsules. Nanoscale. 2016;8:p. p. 17096–17101.
- Yusko EC, Asbury CL, Bement W. Force is a signal that cells cannot ignore. Mol Biol Cell. 2014;25:p. p. 3717–25.
- Russell DG, Huang L, VanderVen BC. Immunometabolism at the interface between macrophages and pathogens. Nat Rev Immunol. 2019;19:p. p. 291–304.
- Weavers H, Evans IR, Martin P, et al. Corpse engulfment generates a molecular memory that primes the macrophage inflammatory response. Cell. 2016;165:p. p. 1658–1671.
- Chen Z, Yang L, Cui Y, et al. Cytoskeleton-centric protein transportation by exosomes transforms tumor-favorable macrophages. Oncotarget. 2016;7:p. p. 67387–67402.
- Liu YX, Karsai A, Anderson DS, et al. Single-cell mechanics provides an effective means to probe in vivo interactions between alveolar macrophages and silver nanoparticles. J Phys Chem A. 2015;119:p. p. 15118–15129.
- Pati R, Das I, Mehta RK, et al. Zinc-Oxide nanoparticles exhibit genotoxic, clastogenic, cytotoxic and actin depolymerization effects by inducing oxidative stress responses in macrophages and adult mice. Toxicol Sci. 2016;150:p. p. 454–472.
- Zimmer CC, Liu YX, Morgan JT, et al. New approach to investigate the cytotoxicity of nanomaterials using single cell mechanics. J Phys Chem A. 2014;118:p. p. 1246–1255.
- Zhang T, Gaffrey MJ, Qian WJ, et al. Oxidative stress and redox modifications in nanomaterial–cellular interactions. in: Bonner JC, BrownJMeditors. Interaction of nanomaterials with the immune system. Springer International Publishing: Cham; 2020;p. p. 127–148.
- Zhang B, Zhu M, Li Z, et al. Cellular fate of deformable needle-shaped PLGA-PEG fibers. Acta Biomater. 2020;112:p. p. 182–189.
- Zhou G, Zhang B, Wei L, et al. Spatially resolved correlation between stiffness increase and actin aggregation around nanofibers internalized in living macrophages. Materials (Basel). 2020;13:p. 3235.
- Hu J, Chen S, Huang D, et al. Global mapping of live cell mechanical features using PeakForce QNM AFM. Biophysics Reports. 2020;6:p. p. 9–18.
- Schillers H, Medalsy I, Hu S, et al. PeakForce Tapping resolves individual microvilli on living cells. J Mol Recog. 2016;29:p. p. 95–101.
- Benaglia S, Amo CA, Garcia R. Fast, quantitative and high resolution mapping of viscoelastic properties with bimodal AFM. Nanoscale. 2019;11:p. p. 15289–15297.
- Kocun M, Labuda A, Meinhold W, et al. Fast, high resolution, and wide modulus range nanomechanical mapping with bimodal tapping mode. ACS Nano. 2017;11:p. p. 10097–10105.
- Labuda A, Kocuń M, Meinhold W, et al. Generalized Hertz model for bimodal nanomechanical mapping. Beilstein J Nanotechnol. 2016;7:p. p. 970–982.
- Raman A, Trigueros S, Cartagena A, et al. Mapping nanomechanical properties of live cells using multi-harmonic atomic force microscopy. Nat Nanotechnol. 2011;6:p. p. 809–14.
- Efremov YM, Cartagena-Rivera AX, Athamneh AIM, et al. Mapping heterogeneity of cellular mechanics by multi-harmonic atomic force microscopy. Nat Protoc. 2018;13:p. p. 2200–2216.
- Cartagena-Rivera AX, Wang WH, Geahlen RL, et al. Fast, multi-frequency, and quantitative nanomechanical mapping of live cells using the atomic force microscope. Sci Rep. 2015;5:p. 11692.
- Cartagena A, Raman A. Local viscoelastic properties of live cells investigated using dynamic and quasi-static atomic force microscopy methods. Biophys J. 2014;106:p. p. 1033–1043.
- Zhou L, Cai M, Tong T, et al. Progress in the correlative atomic force microscopy and optical microscopy. Sensors (Basel). 2017;17:4:p. 938.
- Gómez-Varela AI, Stamov DR, Miranda A, et al. Simultaneous co-localized super-resolution fluorescence microscopy and atomic force microscopy: combined SIM and AFM platform for the life sciences. Sci Rep. 2020;10:p. 1122.
- Chacko JV, Canale C, Harke B, et al. Sub-diffraction nano manipulation using STED AFM. Plos One. 2013;8:p. e66608.
- Chacko JV, Harke B, Canale C, et al. Cellular level nanomanipulation using atomic force microscope aided with superresolution imaging. J Biomed Opt. 2014Journal of Biomedical Optics. 2014;19:p. 105003
- Chacko JV, Zanacchi FC, Diaspro A. Probing cytoskeletal structures by coupling optical superresolution and AFM techniques for a correlative approach. Cytoskeleton (Hoboken). 2013;70:p. p. 729–740.
- Cosentino M, Canale C, Bianchini P, et al. AFM-STED correlative nanoscopy reveals a dark side in fluorescence microscopy imaging. Sci Adv. 2019;5:p. eaav8062.
- Shibata T, Furukawa H, Ito Y, et al. photocatalytic nanofabrication and intracellular raman imaging of living cells with functionalized AFM probes. Micromachines (Basel). 2020;11:p. 495.
- Nelsen E, Hobson CM, Kern ME, et al. Combined atomic force microscope and volumetric light sheet system for correlative force and fluorescence mechanobiology studies. Sci Rep. 2020;10:p. 8133.
- Sokolov I, Dokukin ME, Kalaparthi V, et al. Noninvasive diagnostic imaging using machine-learning analysis of nanoresolution images of cell surfaces: detection of bladder cancer. Proc Natl Acad Sci U S A. 2018;115:p. p. 12920–12925.
- Nyberg KD, Bruce SL, Nguyen AV, et al. Predicting cancer cell invasion by single-cell physical phenotyping. Integr Biol (Camb). 2018;10:p. p. 218–231.