
 ?Mathematical formulae have been encoded as MathML and are displayed in this HTML version using MathJax in order to improve their display. Uncheck the box to turn MathJax off. This feature requires Javascript. Click on a formula to zoom.
ABSTRACT
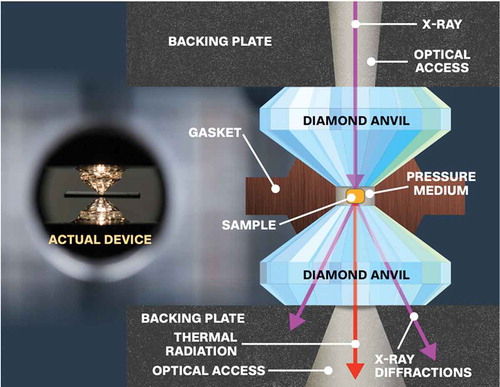
Hydrogen is the simplest molecule in nature. One of the key problems and challenges in condensed matter physics is to understand the phases, properties, and structure of hydrogen as a function of pressure and temperature. Over 80 years ago Wigner and Huntington predicted that if solid molecular hydrogen was sufficiently compressed, it would transform to an atomic metal. Later, a second pathway emerged; it was predicted that if heated to high temperatures under pressure it would transform to liquid atomic hydrogen; this form of metallic hydrogen makes up ~90% of the planet Jupiter. The prediction of high temperature superconductivity of solid atomic metallic hydrogen stimulated the experimental community to produce this material . For decades hydrogen defied the experimental efforts to transform it. Using diamond anvil cells, metallic hydrogen has recently been produced at a pressure of ~5 million atmospheres, significantly greater than the pressure at the center of the earth. Liquid atomic metallic hydrogen has been produced at temperatures of a few thousand degrees Kelvin in diamond anvil cells, as well as in dynamic experiments. We review the seemingly simple, but actually complex properties of this quantum solid and metal and the decades of development and progress to achieve this important fundamental result.
Graphical abstract
1 Introduction
The past several years have been an exciting period in the study of the properties of hydrogen at high pressure or high density. In 1935 Wigner and Huntington predicted that under a sufficient pressure, solid molecular hydrogen would transition to atomic Metallic Hydrogen (MH) [Citation1]. MH can be produced at low temperature, or at high temperature as liquid atomic hydrogen. MH has recently been observed in the laboratory at Harvard University at low temperature and ~5 megabars [Citation2]; this is the phase predicted by Wigner Huntington and we shall call this WHMH. In order to understand the challenges, the complex nature of the problem, and the high-pressure phase diagram, in this introduction we first discuss many of the properties of hydrogen and its isotopes, generally at ambient pressures and conditions.
The hydrogen atom is composed of a single electron in an orbital s-state, bonded to the proton by Coulomb forces. H is the lightest of all elements with mass 1 amu and may seem conceptually simple. A gas of H atoms at ambient conditions is unstable and via collisions combine to form molecular hydrogen, H2 with mass 2; H2 is also conceptually simple. However, in the condensed phase, due to the light mass, the relatively weak intermolecular pair interaction, and large zero-point energy, as well as spins on the electrons and nuclei, the many-body problem is one of the more complex ones in condensed matter physics. The goal of producing MH has been a challenge for both experimentalists and theorists for over 80 years.
1.1 The hydrogen molecule; ortho and para-hydrogen
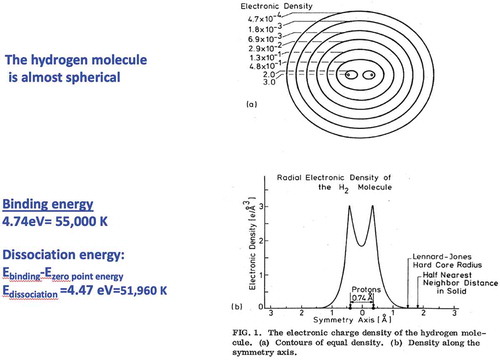
Hydrogen is the most abundant element in the universe; on earth we find it mostly bonded to oxygen as H2O. In its pure form it is easily available as gaseous molecular H2, two protons tightly bound by covalent bonds of the two electrons with antiparallel spins in a singlet spin state. Due to the Pauli principle, requiring antisymmetric wavefunctions under particle inversion, both electrons are in orbital s states (with antiparallel spins) and can overlap. The electronic density is highest between the protons, shown in ; the bonding of the two protons is due to strong Coulomb forces. The experimental value for the binding energy of hydrogen is 4.746 eV while the dissociation energy (binding energy minus zero-point energy, ZPE) is 4. 4775 eV (51,960 K in temperature units); for deuterium these values are 4.747 and 4.5557 eV, respectively. Since metallization to atomic MH depends on the dissociation energy, deuterium should require a slightly higher pressure for metallization, as its dissociation energy is larger than that of hydrogen. If the electron’s spins are aligned parallel in the triplet spin-1 state, to satisfy the Pauli principle the orbital states must be antisymmetric with zero density at the center of the molecule. For this state, the binding energy is only several degrees K and there are no bound states when ZPE is taken into account (see ref [Citation3] for more details).
Figure 1. The electronic charge density of the hydrogen molecule. a) Contours of equal density. b) Density along the symmetry axis
Molecular hydrogen is a gas at room temperature (RT); cooling to 20.4 K, hydrogen condenses to a molecular fluid at 1 atmosphere pressure (useful pressure units: 1 atm = 1.013 bar; 1 bar = 1x10⁵ Pascal; 100 GPa = 1 megabar). Upon further cooling to ~14 K, it solidifies into a molecular solid with a hexagonal close-packed (HCP) structure. Hydrogen has two isomers: ortho with nuclear spins in a triplet state and para with nuclear spins in a singlet state. In Table I we enumerate the spin states, noting that they are quite different for hydrogen and deuterium, as the proton has a spin ½ and the deuteron spin 1.
The ortho-para concentrations have a profound effect on the low pressure phase diagram, as we shall see. Although the spin–spin interactions are very small, symmetry requirements impose requirements on the rotational states. For example, if molecules are in the J = 0 spherically symmetric state (para-H2, or ortho-D2) there are no anisotropic interactions, whereas ortho-H2 and para-D2 with the corresponding state J = 1(non-spherically symmetric rotational states), have strong anisotropic interactions. The boiling and melting temperatures of hydrogen depend weakly on the ortho/para concentration [Citation3]. At room temperature, thermodynamic equilibrium hydrogen is 25% para and 75% ortho (this is called normal hydrogen), while at 20.4 K it is 99.8% para, and in the T = 0 K limit it is pure para. Conversion between ortho and para is very slow (about 2%/hour in the low temperature solid at zero pressure); a rapidly cooled and condensed sample of a room temperature equilibrium g as can take days to achieve equilibrium (). Gases of hydrogen isomers have been prepared with concentration of 99% ortho to essentially pure para [Citation3].
Table 1. The nuclear spin states of H2 and D2. The left-hand side gives the wave function in terms total spin for the molecular system. The right-hand side provides the wave function in terms of the spin on the individual atoms. The symmetry of the exchange is evident from the right hand side wave functions
The ortho/para consideration is extremely important for understanding the phase diagram, especially at lower pressures [Citation3]. In the zero-pressure solid the nearest-neighbor distances are ~3.8 angstroms (compare this to a solid like copper with an atomic separation of 2.5 angstroms). As a result the molecules in the solid are almost in the free-rotor states of an isolated molecule, as there is little steric hindrance. The low-lying single-molecule energy modes of excitation are rotational and vibrational (ignoring lattice vibrations or phonons of the solid, for the present). In the solid, many-body molecular excitations are called rotons and vibrons. The molecular wavefunction (WF) is a product of the electronic, the rotational wavefunction, the vibrational WF, and the nuclear spin WF. Due to the requirements of symmetry of the wavefunction, para states with antiparallel nuclear spin states have rotational states characterized by the rotational quantum number J that can only be even, so J = 0,2,4…, whereas ortho with total nuclear spin 1 states correspond to odd J = 1, 3, 5…
The energies of the rotational states of the hydrogen isotopes are very large. The Hamiltonian for the free-rotor is
1.1–1
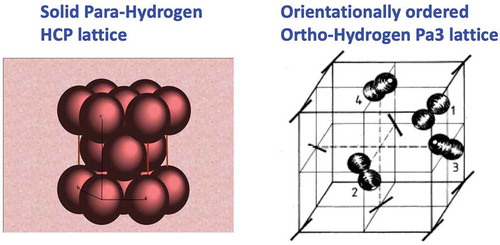
For hydrogen B=59.34 cm−1; deuterium B=29.91cm−1 where B is the rotational constant, inversely proportional to mass (1 cm−1 =1.4388 K). The wavefunctions are spherical harmonics, where J is the rotational quantum number and M is its projection. This large energy spacing of rotational levels has an important impact on the thermal properties and phase diagram. For example, in the fixed frame of the molecule, the hydrogen molecule has an electric quadrupole moment Q. However, in the lattice frame with para hydrogen in the spherically symmetric ground state J =0, the quantum average of Q is zero; whereas in the ortho state with J =1, Q has a finite value and molecules have an intermolecular electric quadrupole–quadrupole (EQQ) interaction. As a consequence, the lattice structure of para H2 remains HCP in the low temperature limit, whereas ortho-H2 undergoes a transition to a phase with structure Pa3 with orientational order of the molecules on a face-centered cubic (FCC) lattice, shown in . At high pressures when orbital wavefunctions are no longer spherical harmonics, different structures of molecular hydrogen exhibit orientational order.
Figure 2. Low pressure structures of ortho and para hydrogen. The Pa3 ortho hydrogen structure provides an example of orientational order that occurs in higher pressure solids with different lattice structures
1.2 Hydrogen isotopes and quantum solids
Atomic hydrogen has two isotopes: deuterium (mass 2, nuclear spin 1) with a neutron in the nucleus and tritium (mass 3, nuclear spin 1/2) with two neutrons. Collectively the isotopes are referred to as the hydrogens. Because of the nuclear spin of 1, the nomenclature for the isomers of molecular deuterium differ from those of H2 (see Table I). Tritium, with the same spin as hydrogen, is quite rare and thus is seldom studied under pressure as it is radioactive and can contaminate apparatus. Tritium will not be further considered, only H2, D2, and HD. Because of their light masses the hydrogens have large zero-point energy and zero-point motion (ZPM).
The hydrogens are classified as quantum solids. In a classical solid, nearest-neighbor particles sit at the minima of their interaction pair potentials. Quantum mechanically the large ZPM excursions from the equilibrium position would result in a large average overlap of the electronic charges of the neighboring molecules, resulting in an increased ground state energy. The quantum lattice expands substantially to reduce this overlap and the ground state energy: the particles are no longer at the minima of the pair potentials. The usual harmonic approximation breaks down and potentials need to be renormalized. Quantum solids are highly compressible at low pressure; they are classified by the de Boer quantum parameter (see Ref [Citation3].). In this classification, helium is the most quantum of all stable atoms and does not solidify in the T =0 K limit; molecular hydrogen is next with a solidification temperature of ~14 K. Isotope effects are large: deuterium with a larger mass (and smaller ZPM) melts at approximately 19.2 K and boils at 24.2 K.
2. Phase Transitions And Theoretical Predictions Of Metallization And Superconductivity
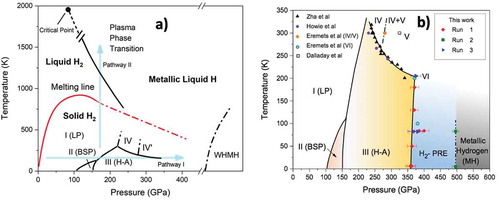
We shall first discuss the putative phase diagram of hydrogen shown in , after Ref [Citation4]. This phase diagram is a combination of observed and predicted transitions, as believed around the year 2010. A goal in the study of the hydrogens is to understand the phase diagram as a function of pressure P and temperature T, for the isotopes. This implies the study of phase transitions, including understanding the crystal structure and electro-magnetic properties, i.e. electrical conductivity or resistance and magnetic properties.
Figure 3. a) The high-pressure phase diagram of para-hydrogen showing two pathways, I and II, to the metallic phase and some of the predicted transitions. b) An expansion of the phase diagram along Pathway I with recent experimental data. These phases will be discussed in the text
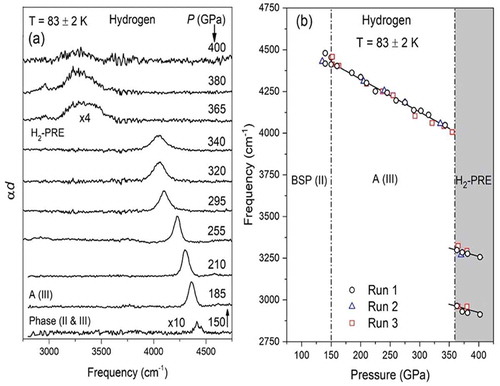
Observation of structural phase transitions is best done by X ray or neutron scattering. Unfortunately, these techniques are challenging for hydrogen that has weak scattering signals due to the small scattering cross sections of light elements, the unusually small sample sizes in DACs, or the very short observation times for dynamic (shock) measurements. As a result, most studies have been carried out using optical techniques or in some cases, NMR. The main optical techniques have been Raman scattering and infrared or optical absorption. Observations can best be understood in terms of the Landau theory of phase transitions (PTs) which is based on the symmetry of the particle distributions in a lattice. This symmetry is characterized by the temperature dependence of an order-parameter which is continuous for a second-order transition and usually discontinuous for a first-order transition. Light can interact and be absorbed or scattered by excitations in the sample such as rotons, vibrons, and phonons. Creation of excitations by this interaction are either allowed or disallowed, depending on the symmetry of the lattice. Thus, in most cases where the symmetry of the lattice changes, a phase transition can be observed by the onset or disappearance of, for example, absorption of light due to an excitation. An example for the observation of a transition from the H-A phase (or III) to H2-PRE is shown in . These changes can be studied as a function of pressure or temperature to map the phase lines separating phases.
Figure 4. Infrared absorption in hydrogen. On the left is the absorption coefficient times the thickness. With increasing pressure, the vibron line shifts to lower frequency and disappears between 340 and 365 GPa implying a phase transition P-T point, plotted on the right
In their study of metallization of hydrogen Wigner and Huntington predicted the dissociation of the molecules and a transition to a solid atomic metallic phase at a certain density. As pressure is increased the density increases; eventually the intermolecular separation becomes. comparable to the interatomic spacing in a molecule. At some density solid molecular hydrogen can lower its free energy by molecules dissociating to form an atomic solid. The solid has a half-filled energy band so that it is a metal. This is shown as Pathway I in . Recent advances along Pathway I are discussed ahead in Section 4.
In theoretical studies of PTs, one studies structural properties as a function of density, but in experiments it is the pressure that is applied to vary the density. The equation of state (EOS), or pressure vs molar volume or density, is determined afterwards, either by calculation or use of an experimental EOS. In 1935, the EOS of hydrogen was unknown, so Wigner and Huntington used the zero-pressure compressibility of hydrogen for all pressures and predicted a transition pressure of 25 GPa (0.25 megabar). Since hydrogen is a quantum solid and highly compressible, this gave a grossly incorrect transition pressure, still high enough to be rather challenging in terms of the experimental capabilities available at the time, so it could not be easily tested.
2.1 Current theories of the metallization pressure
Most modern theories use density functional theory (DFT) to predict phase diagrams of solids, but for hydrogen this gave inconsistent predictions [Citation5]. DFT does not include ZPE and results depend on the form of the functional used in the DFT [Citation6]. Theories such as Diffusion Monte Carlo (DMC) [Citation7,Citation8] or Path Integral Monte Carlo (PIMC) and coupled electron-ion Monte Carlo (CEIMC) [Citation9] overcome many of the problems of DFT, but are calculationally intensive. They predict structures with the transition pressure in the range of 400–500 GPa for WHMH, or almost 20 times the early prediction of Wigner and Huntington. Recent theories predict the structure of solid atomic MH to be the I41/amd, a structure close to the free-electron model [Citation10].
The calculated theoretical free energies between different phases are quite small and it is up to experiment to determine the true phase diagram. Some theories predict that MH may be a liquid in the zero temperature limit due to the large atomic ZPE; they also predict that MH may be a metastable material, that is, it remains in the metallic phase as the pressure is reduced below the transition pressure [Citation11]. If MH is a liquid it may have a complex structure with both superfluid and superconducting phases [Citation12].
Ramaker, Kumar, and Harris [Citation13] first predicted that as the pressure was increased on the molecular solid, the electronic bandgap would close and the molecules ionize to become a molecular metal at a pressure a little over 2 megabars. Friedli and Ashcroft [Citation14] made a similar observation for about the same pressure. Cudazzo et al. [Citation15] predicted a high superconducting transition temperature, Tc, for the predicted molecular metal.
2.2 The high temperature-high pressure phases of liquid metallic hydrogen
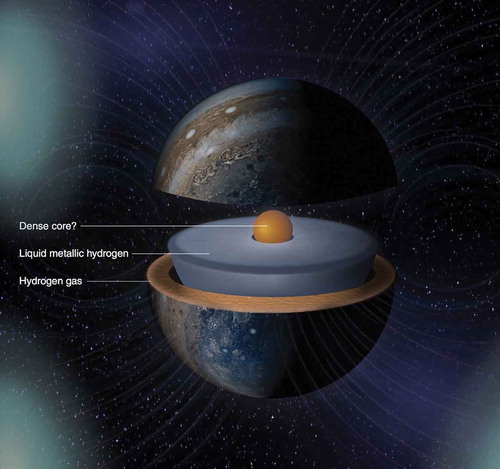
If the isotopes of hydrogen are at an intermediate pressure of order 100 GPA so that the density is relatively high, and the sample is heated above the melting line of the molecular species, a first-order phase transition from liquid molecular to liquid atomic metallic is predicted. This P,T phase line has a negative slope, so the higher the pressure the lower the transition temperature; the phase line also has a critical point at lower pressures and higher temperatures. This is Pathway II to MH shown in . Such a phase line was discussed in general terms by Landau and Zeldovich [Citation16], and later quantitatively by Norman and Starostin, who called it the plasma phase transition or PPT [Citation17]. It has been studied both theoretically and experimentally for hydrogen by many groups as a liquid-liquid phase transition (LLPT) and is discussed and referenced in detail in a review article [Citation18]. Liquid MH (LMH) was first observed in dynamic experiments on hydrogen and deuterium by Weir, Mitchell, and Nellis [Citation19] at a pressure of 140 GPa and estimated temperature of 3000 K. However, the predicted phase line was not observed, possibly because of the thermodynamic pathway; this will be discussed ahead. The composition of the planet Jupiter is ~90% hydrogen [Citation20]. LMH composes most of the mass of the planet Jupiter and is responsible for its magnetic field observed in recent NASA flyby probes; see . Advances along Pathway II are discussed in Section 5.
Figure 5. An artist’s rendition of Jupiter. The dense core is possibly molten and surrounded by liquid metallic hydrogen. The magnetic field lines are due to the dynamo effect of the LMH
2.3 Superconductivity in the hydrogens
There was little experimental effort to produce MH until the 1968 prediction by Neil Ashcroft that MH might be a high temperature superconductor (SC), i.e. an SC with a high transition temperature, Tc [Citation21]. This paper inspired experimentalists to develop high pressure methods to produce MH. Later, McMahon and Ceperley predicted a Tc above room temperature for atomic MH with Tc increasing to several hundred K with increasing pressure [Citation22]. Borinaga et al. [Citation23] predicted a Tc of 300 K at 500 GPa; Kudryashov, Kutukov, and Mazur predict Tc =217 K [Citation24]; Yan, Gong, and Liu predict a Tc of 291 K [Citation25]; Verma et al., Tc above RT [Citation26]. Clearly there is a great deal of variation in the theoretical estimates and Tc needs to be determined experimentally.
Experimentally, to provide convincing evidence of superconductivity one should show that below Tc, the resistance goes to zero and there is a Meissner effect, i.e. the exclusion of magnetic flux from the interior of the sample. These studies are relegated to DACs as dynamic or shock methods do not yet achieve low enough temperatures. Studies of electrical resistance are challenging for DACs as it is difficult to embed electrical leads in the samples which are very small and thin (of order 10 to 50 microns in diameter and 1–2 microns thick). High Tc’s imply a requirement of large magnetic fields needed to quench superconductivity in the study of the Meissner effect. Superconductivity might be more easily observed non-invasively, either optically in transmission or reflection as was originally done in establishing the BCS theory of SC [Citation27]. Corvotte, Nicol, and Timusk have proposed a non-invasive method by observing reflectance as a function of temperature [Citation28], while Borinaga et al. [Citation10] suggest studying reflectance as a function of temperature at wavelengths corresponding to SC gap energies.
The pressures required to produce MH are extremely high. In 1983 Carlsson and Ashcroft [Citation29] suggested that the transition pressure might be substantially reduced by introducing metallic impurity atoms into the hydrogen lattice. This has not yet been observed, but later Ashcroft [Citation30] considered the hydrides or hydrogen-rich alloys that may have high Tc’s. This in fact has been a very successful approach to producing high Tc compounds. Superconductivity was observed in hydrogen sulfide at 203 K [Citation31], lanthanum hydride at 250 or 260 K [Citation32,Citation33], and recently at 287.7 K, or room temperature, in a carbon sulfur hydride [Citation34]. All of these superconductors have been produced and studied under pressure in DACs.
In summary, superconductivity in pure metallic hydrogen has not yet been studied experimentally, but it has been observed in a number of hydrides at high temperatures. Evidently, under pressure and perhaps with heating, metals easily dissolve into hydrogen to form hydrogen rich alloys that can be superconducting.
3. Early studies of the phase diagram of the hydrogens
The earliest papers on the phase diagram of hydrogen were in the 1970’s to sort out the zero-pressure structure and phase diagram of ortho and para hydrogen. When cooled, hydrogen or deuterium crystallize in the HCP lattice and pure p-H2 (or o-D2) remain so in the T =0 limit (at low temperature para-hydrogen and ortho-deuterium are in the J =0 rotational state). Raman studies on single crystals of high purity ortho-hydrogen showed that the HCP lattice transformed to an FCC lattice due to the EQQ interactions [Citation35]. In this lattice molecules align along four different body diagonals of the Pa3 crystal structure shown in . The transition temperatures are 2.8 K and 3.8 K for hydrogen and deuterium, respectively. These were studied in detail at low temperature as a function of o-p concentration [Citation36]. This is possible because the conversion rate in the solid is very slow so that out of equilibrium concentrations, such as almost pure ortho-hydrogen, exist at helium temperatures. The temperature for the transition to the FCC lattice depends on the ortho/para concentration, and goes to zero at about 60% ortho-hydrogen. As a consequence, there are essentially an infinite number of phase diagrams if the o-p ratio is indexed. For most high-pressure studies, room temperature equilibrium gas samples are loaded and after some time convert to equilibrium at low temperature, which is rich in para-hydrogen. Thus, for high pressure experiments we shall focus on this species, especially at lower pressures. There are several transitions at high pressure that we shall discuss (see along Pathway I). If the transition is in pure ortho or para-hydrogen, then these transitions are given a unique name. Transitions to the same structure occur for weak mixing of ortho and para; these mixed o-p structures are named I, II, III, etc. [Citation37].
3.1 Higher pressure phases
The first high pressure experiment on hydrogen was carried out by Mao and Bell [Citation38]. They cryogenically loaded hydrogen and then studied it at room-temperature to about 50 GPa observing crystallization, but no transition in the solid state. Earlier, Raich and Etters [Citation39] had predicted a transition from symmetric HCP para-hydrogen (or ortho-deuterium) to a phase with orientational order. Low pressure p-H2 molecules are in free rotor states with the spherical harmonic wavefunctions. The orientational part of the WF is a constant for the ground state with J =0, independent of angle, so the molecule is in a spherically symmetric state. As pressure or density is increased the anisotropic intermolecular interactions increase and cause an admixture of higher rotational states into the J =0 ground state. With a sufficient admixture there is a breakdown of the free-rotor description and para molecules develop non-spherical shapes. The lattice transforms into a phase of orientational order with alignment of molecular axes. The smaller the spacing between rotational states, the larger the admixture and the lower the pressure required for the transition. Thus, this transition should occur at a lower pressure in deuterium as the rotational constant B is half that for hydrogen. Silvera and Wijngaarden [Citation40] first observed this transition in ortho-deuterium at 27.8 GPa in a DAC at a temperature of 1.1 K; this was named the broken symmetry phase or BSP [Citation41], as it is a transition that takes place in the limit that T goes to zero K and the symmetry of the lattice is changed (see the phase line in for hydrogen; this is named phase II for mixed o-p). There was no change in the reflectance, or observation of a transition to a metallic phase predicted at 25 GPa by Wigner and Huntington. They also studied p-H2 to 54 GPa, but did not see a transition. Due to the large mass difference, there is a large isotope effect; the BSP transition in p-H2 was subsequently found at a pressure of 110 GPa [Citation42] shown in .
In a high pressure study, Hemley and Mao [Citation43] observed a phase transition at about 150 GPa in compressed hydrogen at liquid nitrogen temperatures (~77 K) that had about a 50–50 ortho-para concentration. They misinterpreted this transition as an extension to high pressure of the orientationally ordered phase of ortho-hydrogen that depends on the EQQ interaction. The transition line depends strongly on pressure, as the EQQ interaction increases as the fifth power of the intermolecular spacing [Citation36]. Lorenzana, Silvera, and Goettel [Citation44] studied hydrogen as a function of P, T, and o-p concentration and showed that the transition was to a new phase that they named the hydrogen-A phase or H-A. The phase line rises sharply with P and T (see ); in the low temperature limit the transition pressure is at 149 GPa. The phase is molecular, insulating, and the phase line is almost independent of o-p concentration; samples with mixed concentration are called phase III. The deuterium, D-A phase is at about the same pressure. It was first reported at 190 GPa [Citation45] and then revised to 165 GPa [Citation46]. Cui et al. [Citation47] did a definitive study with pure and mixed o-p crystals, using both IR and Raman spectroscopy, showing that the transition in deuterium is at essentially the same pressure as hydrogen (149 GPa), shown in .
Figure 6. The P-T dependence of the H-A and BSP phases for a high-pressure sample of mainly ortho deuterium. The three phases meet at a triple point
3.2. Early claims of metallic hydrogen at high pressures
Since the prediction by Wigner and Huntington, there has been a long history of claims of metallic hydrogen under static conditions that did not stand up to scrutiny. We briefly review many of these claims here. The fundamental methods of establishing metallicity are to show that the electrical conductivity remains finite in the low temperature limit, or that the material has optical properties of a metal, a useful non-intrusive method often used in diamond anvil cells. The search for MH has been highly competitive as we shall see ahead.
In the earliest attempts a Russian group led by L.F. Vereshchagin built a giant static press aimed at producing MH. One of us (IFS) visited the laboratory in Troitsk near Moscow in the 1970’s: this impressive giant press rose hundreds of feet above ground and just as far below ground. Unfortunately, no results on hydrogen were ever published. In 1975 Vereshchagin, Yakovlev and Timofeev [Citation48] reported metallic hydrogen by measuring hydrogen’s conductivity. They used a diamond indenter cell (DIC). This consisted of carbonado (conducting polycrystalline diamond) indenter anvils compressing a thin layer of hydrogen at low temperature. However, the hydrogen was not confined in a gasket and it is likely that the hydrogen extruded out, and the indenters shorted, rather than measuring conductivity of hydrogen. In Verashchagin’s configuration the pressure was calculated using Hertzian theory, and later it was shown that this gave spurious results [Citation49].
Next, in 1989, Hemley and Mao [Citation50] pressurized a sample of hydrogen mixed with ruby powder in a DAC. They observed the hydrogen between ruby particles to darken at a pressure of ~200 GPa and claimed metallization due to electronic band closure. There was no measurement of metallic properties and the claim was refuted [Citation51]; the response was inadequate.
Hemley, Mao, and Hanfland [Citation52], again claimed to observe a transition to molecular metallic hydrogen at 149 GPa, in 1990 using infrared spectroscopy. They measured the reflectance in the range of about 0.8 to 2.5 microns and saw that it was rising to about 5% at the longest wavelength of their reported results. They interpreted this as a Drude reflection edge and claimed it was molecular metallic and extracted Drude parameters from their observations. The pressure of 149 GPa is where the BSP phase transforms to the H-A phase, so the claim was that H-A is metallic, which was a possibility. Eggert, Goettel and Silvera [Citation53] measured the dispersion in the refractive index in the visible at lower pressures, to indirectly measure the direct bandgap as a function of pressure; their results suggested that hydrogen might be a semi-metal, transparent in the visible, and needed to be studied at pressures of order 150 GPa or higher. Hemley, Hanfland, and Mao [Citation54] carried out measurements to 170 GPa and showed that the refractive index was well behaved, but they sustained their claim of MH, based on a closing of an indirect bandgap. Eggert et al. [Citation55] then studied hydrogen to 230 GPa measuring absorption and reflection in the IR (to 1.7 microns) and found no evidence of a Drude edge. This established that the H-A phase was not metallic, but Mao et al. maintained their claim of molecular MH [Citation56], although there were inconsistencies. Finally to settle this long running conflict Chen, Sterer, and Silvera [Citation57] developed an IR system that would extend measurements to 10 microns. Results showed no evidence of Drude behavior or MH. In the H-A phase a new vibron was observed in IR absorption, peaking at about 2.5 microns. Increased absorption leads to increased reflectance, of a few percent in this case. Thus, Mao et al. saw rising reflectance due to this absorption; extending measurements to longer wavelengths showed that the sample was transparent at longer wavelengths and there was no reflectance due to a free electron gas. Hemley et al. [Citation58] finally conceded that the H-A phase was not metallic.
For dynamic measurements, there was a 1978 report of electrical conductivity of hydrogen by Hawke et al. [Citation59] who used explosively driven magnetic flux compression to isentropically compress hydrogen. The observed rise in conductivity at high pressure and temperature did not present evidence of metallic hydrogen as the conductivity itself was not measured. Values of P and T (200 GPa and 400 K) were determined from models. The later gas gun measurements by Weir et al. [Citation60] overcame these problems. More recent claims of metallic hydrogen and its properties have continued. These will be discussed ahead.
3.3. The melting line
The unusual melting line of hydrogen with a peak as a function pressure is shown in . A theory of the melting line by Bonev et al. [Citation61] indicated that there was a maximum as a function of pressure. Early measurements of the melting line were limited in pressure, while attempts to measure to higher temperatures with static heating were unsuccessful as hydrogen diffused into the diamonds which were embrittled and failed. Deemyad and Silvera [Citation62] overcame this problem by using pulsed laser heating of the hydrogen. They determined the peak to be at T =1055 K and P =64.7 GPa, a little higher than the theoretical curve (red line in ). The dash-dot line is a possible extrapolation. Subsequently the melting line was extended to higher pressures beyond the peak [Citation63,Citation64].
3.4. Pressures exceeding 200 GPa along pathway I
In 1998 Narayana et al. [Citation65] achieved a pressure of 342 GPa on hydrogen and the sample remained visually transparent, thus a new pressure boundary was set for metallic hydrogen. In this room temperature experiment they used Raman scattering to study the sample. Fifteen sets of diamond anvils were broken. They found that when shining laser light into the stressed region of the diamonds at high pressure, the diamonds would fail. They measured pressure by Xray diffraction in the edge of the stressed gasket. Then, in 2002, Loubeyre, Occelli, and LeToullec [Citation66] reported hydrogen as being black in the visible at a pressure of 320 GPa at RT. These two reports are contradictory. Silvera suggested [Citation37] that there could be a problem in the pressure measurements. It is also possible that the sample in Ref [Citation66] contained metallic impurities that might affect the transparency. We shall see that others find hydrogen to be transparent to 350–360 GPa, and then blackens with increasing pressure.
In 2011 Eremets and Troyan [Citation67] used Raman scattering to study both hydrogen and deuterium up to pressures ~300 GPa, in the vicinity of room temperature. They found two new phases at about 220 and 270 GPa. Their samples contained electrical leads and they observed changes in conductance or photoconductivity and claimed that their sample was liquid atomic metallic. This claim was refuted [Citation68] and later Eremets et al. [Citation69] and others [Citation70,Citation71] used infrared spectroscopy that showed the phases were not metallic. Subsequent to the experiment by Eremets and Troyan, Howie et al. [Citation72,Citation73] observed the same phases and named them IV and IV’ (see ). They proposed that the sample was half atomic and semi-metallic, relying more on theory than experimental evidence for this claim. Extensive theoretical studies of the structure in this entropy driven phase that exists around room temperature [Citation74–77] predicted a transition to hexagonal structures with two different hexagonal planes.
Dias, Noked, and Silvera [Citation78] studied solid HD and found two new quantum phase transitions. They also found that at around 200 GPa the HD became unstable to dissociation followed by recombination to form HD + 1/2 (H2 + D2), calling this process DISREC, predicted in a theoretical paper by Liu and Ma [Citation76].
In an experiment on hydrogen, Dias, Noked, and Silvera [Citation4,Citation79] achieved a pressure of 420 GPa. Using IR absorption spectroscopy, they found a new phase at a pressure of 360 GPa in the low temperature limit (~5 K). They named this phase H2-PRE (see ); this phase was observed in three separate experiments using IR spectroscopy. It has a steep slope and is a quantum phase transition that occurs in the T =0 K limit. At the same time, Eremets, Troyan, and Drozdov [Citation80] observed a PT at the same pressure but T =200 K, using Raman scattering, and named it phase VI. They then extended their measurements to 100 K and it agreed with the phase line of Dias et al. (see ) [Citation81].
The possible structures of the solid as a function of density were studied in a number of articles. The theoretical approach is to use a random searching method using DFT to find the structures with the lowest free energies (and thus the favored structures), then to select several likely structures generated from the search and calculate the energies with advanced techniques [Citation5,Citation9,Citation74,Citation75]. Some papers were trying to understand the closure of the bandgap and possible metallic molecular hydrogen [Citation82,Citation83]. Many of the papers were aimed at predicting the transition pressure for WHMH [Citation7,Citation8,Citation18].
Dalladay-Simpson et al. reported a new phase [Citation84] around room temperature at a pressure of 325 GPa in the vicinity of phases IV and V in . They named this phase V. Their phase determination was based on unusual criteria for a PT and was challenged [Citation85]. Eremets et al. [Citation80] studied this region using Raman scattering and proposed that this phase is actually phase IV’, that they had observed earlier. They proposed that Dalladay-Simpson et al. were observing spectra from a mixed phase region, i.e. IV and IV’ so that there was no new phase. For an improved notation it has been proposed to drop the name of IV’ and call it V [Citation4]. This discussion covers all of the reported significant phases in the molecular solid, prior to observation of WHMH.
4. Metallic hydrogen at ultra-high pressures along pathway I
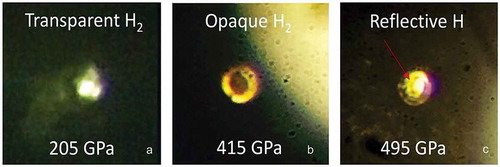
In 2017 WHMH, metallic hydrogen predicted by Wigner and Huntington, was produced in the laboratory at a pressure of 495 GPa at temperatures between 5 and 83 K [Citation2]. A sample that was transparent at lower pressures transformed first to a dark opaque sample and then to a shiny metallic phase. This was the highest pressure ever achieved on hydrogen at low temperatures and the first time WHMH was produced. Photos of the sample are shown in . The reflectance of the sample was measured as a function of optical frequency and fit to a Drude free-electron model. This model yields the plasma frequency which is proportional to the square-root of the electron density. The electron density was one electron/atom or metallic atomic hydrogen.
Figure 7. Photos of a hydrogen sample in a DAC at various indicated pressures. a) The sample is back-lit and transparent. b) Sample is opaque and front and back-lit; the shiny ring around the black sample is the rhenium gasket. c) The sample, enclosed in the rhenium gasket, is shiny and metallic. The shiny MH sample is clearly distinguishable from the gasket. It is about 10 microns in diameter
At the time of the experiment there were several groups trying to achieve this goal, but most were stuck at pressures of around 350 GPa, limited by failure of the diamonds. At Harvard we had many years of experience with hydrogen in DACs and what caused diamond failure. We developed new methods and avoided pitfalls. We used synthetic diamonds rather than naturals, as the latter often have defects, impurities, and inhomogeneities, that are invisible when viewed in a bright-field microscope. Diamond culets, the part that presses on the sample, were etched to remove surface defects that can be created in the polishing process; diamonds were annealed at high temperatures in vacuum to remove internal stresses. Diamonds must be aligned stably so that their culets are opposing and parallel. Techniques were developed to detect and remove instabilities that accrue when diamonds are under load. Hydrogen is known to diffuse into diamond at room or elevated temperatures and pressures and embrittle them; our diamonds were coated with alumina that acts as a diffusion barrier. Even so, we took measures with cryogenic loading of the DAC to ensure that hydrogen was only in contact with diamonds at liquid helium temperatures (~4.2 K) and up to liquid nitrogen temperatures (~77 K). (We note that most other groups working on hydrogen use room temperature gas loaders to load their DACs.) Finally, recalling the experience of Narayana et al. [Citation65], we avoided the use of powerful laser light and studied the sample with infrared spectroscopy, or very low power laser light. These techniques worked, as we achieved 420 GPa in studying H2-PRE [Citation79] and shortly thereafter WHMH.
We suggested that the dark hydrogen sample seen in , was due to closing of an electronic band gap. In this case, it would be semiconducting, absorbing light via valence to conduction band transitions [Citation86]. We measured the integrated transmission in the IR, observing that the sample was opaque in this region for pressures above 420 GPa [Citation4,Citation79]. The possibility existed that the gap was closed and hydrogen was a molecular metal, but we did not have evidence such as reflectance or electrical conductivity to speculate on this possibility. We measured the pressure up to 330 GPa by conventional techniques (shift of a vibron frequency that has been calibrated in pressure) and some unconventional techniques for higher pressures [Citation86]. After the reflectance of WHMH was studied, pressure was measured by the conventional shift of a diamond phonon, confirming the 495 GPa.
4.1. Criticisms of the observation of WHMH
The breakthrough of producing WHMH was widely acknowledged. However, there were a number of criticisms by competitors, unwilling to accept the new advance. Some criticisms were ad hominem (we ignore these). The criticisms cast some doubt on the observation, so in this review we discuss salient criticisms in detail.
Loubeyre, Occelli, and Dumas (LOD), as well as Eremets and Drozdov (ED) commented that the reflectance we measured might have been from the 50 nm layer of alumina (diffusion barrier) deposited on the diamonds and this layer became metallic under pressure. In the first place a 50 nm layer of metal would likely not be transparent to visible light. Yet in , the gasket and sample are clearly visible through the diamond/alumina surface. LOD refer to a 2011 article by Nellis [Citation87] suggesting that alumina metallized under pressure. However, they ignored a paper in 2015 by Liu, Tse, and Nellis [Citation88] who reanalyzed alumina data, concluding that it would metallize at a temperature of 10,000 K and a pressure of 500 GPa, becoming a good metal at 900 GPa. These conditions did not exist in our DAC. ED suggest that WHMH might be semiconducting rather than a metal. In a semiconductor in the low temperature limit, only the valence band is populated and this has a fundamental reflectance. With increasing temperature, the conduction band is thermally populated with electrons and these add to the reflectance. Our measurements showed that the reflectance at 5 and 83 K was independent of temperature, as one expects for a metal. ED also suggest that reflectance is due to cupping of the culet. The thinner the gasket, the lower the cupping. A straightforward calculation for our DAC with a sample thickness of ~1 micron shows that cupping is insignificant [Citation86].
Both LOD and ED complain of the pressure determination. There is only an accepted pressure scale up to 150 GPa [Citation89] based on the ruby fluorescence line. Higher pressures are generally determined by a calibrated correlation between pressure and a shift of the frequency of an excitation such as a phonon in diamond or a vibron in hydrogen. These correlations are generally determined by comparing the shift to X ray EOS data determined in dynamic experiments and corrected to room temperature. Our pressure was determined by the accepted technique (lower pressures by the ruby fluorescence and at higher pressures the shift of a pressure calibrated vibron) up to ~338 GPa, and thereafter by a previously unpublished in-house technique. At the highest pressure of ~500 GPa an extrapolation of the accepted method of the shift of frequency of a Raman phonon in the stressed diamond was implemented. LOD compare to their vibron pressure scale. However, their scale disagrees with scales determined by other groups; this is compared and discussed in detail elsewhere [Citation86]. In any case, the exact pressure of metallization is not important at this stage; the important thing is that the pressures achieved were higher than any previously reported and properties of a metal were measured.
To cast doubt on our achievement, Liu et al. [Citation90] state that they carried out 120 experiments on hydrogen with only 5 of these achieving pressures in the region of 350 GPa. Their paucity of runs achieving high pressures might be expected if one repeats the same procedure time and again without change of technique and getting the same result. Above we outlined the new procedures used to achieve a pressure of ~500 GPa on hydrogen. It is also falsely claimed that the extremely high pressures we reported cannot be achieved with conventional diamond anvils. Almost 20 years ago [Citation91], a pressure of 560 GPa was reported with conventional diamond anvils, but not on hydrogen.
Goncharov and Struzhkin [Citation92] offer some of the criticisms discussed above; these will not be further discussed. They make an important point concerning the correction to the reflectance, needed because of the attenuation of the optical light by the diamonds at shorter wavelengths. Some of these data points were thrown out and a calculational error was corrected in an erratum to the Science paper [Citation93]. These corrections did not change the result of the observation of the WHMH.
4.2. Subsequent attempts to observe WHMH
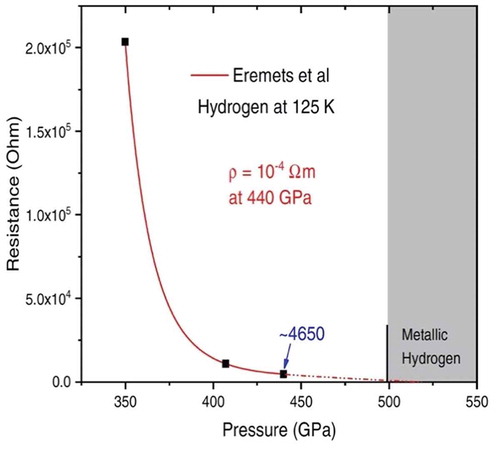
An important and valid comment that has been made is that the experiment producing WHMH should be reproduced. Eremets et al. [Citation81] were able to attach electrical leads to a hydrogen sample and achieved a reported pressure of 480 GPa using conventional diamonds and cryogenic loading. Although they did not report the resistance as a function of pressure, their paper had enough information that we could produce this, shown in . A reasonable extrapolation of their data shows that they may have been approaching the WHMH that we reported.
Figure 8. Electrical resistance of a hydrogen sample as a function of pressure at a temperature of 125 K. The resistance drops rapidly with increasing pressure and an extrapolation indicates that with a higher pressure Eremets et al would have reproduced WHMH
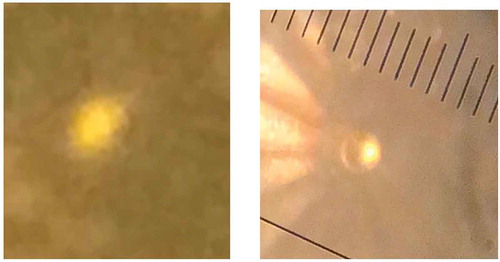
After the first observation of WHMH, at Harvard we have carried out additional experiments on hydrogen. These were not published as there was insufficient new or supporting data (such as pressure and reflectance), but we shall show photos of the high-pressure samples. , left (Jan. 2018), is of a pressurized hydrogen sample in a DAC. With increasing pressure beyond 300 GPa, the sample that was transparent at low pressure became metallic shiny and opaque. One of the diamonds in the DAC had a minor ring-crack that did not interfere with our visual observations and we already had experience of achieving high pressures using diamonds with minor damage of this sort. We decided to first measure the pressure using the shift of the diamond phonon frequency studied with Raman scattering. However, the laser beam scattered off of the crack creating a large background that masked the measurement. We finally warmed to RT and took the DAC out of the cryostat to use better optics (the cryostat has a long working distance of ~ 80 mm and 3 intervening windows). We still could not measure the pressure. The photo is of the sample at room temperature. At low temperature the features of the sample were well defined. However, in warming to room temperature, the edge of the gasket hole became blurry, possibly due to diffusion of the hydrogen into the gasket. It appears that a sample of MH can be heated to room temperature. In right (Jan.2021), the pressure was tracked into the 330–350 GPa region. Pressure was increased and the sample became opaque and started to reflect. The sample, at the edge of the culet flat, became shiny and was evidently at a very high pressure. We decided to first measure the reflectance of the sample and warmed to about 80 K. Before any measurements could be made, after several hours, the diamonds spontaneously and catastrophically failed. This terminated the experiment.
Figure 9. Smart-phone photos of hydrogen at high pressure, described in the text. The sample in the photo on the left is at room temperature. The photo on the right is zoomed out to show the reticule with line spacing of 14 microns
4.3. Claims of molecular metallic hydrogen
Experiments on hydrogen have been carried out by the Eremets group and LOD. Eremets et al. [Citation94] pressurized hydrogen up to 480 GPa and they attached electrical leads to the sample. They studied it as a function of pressure and temperature and claim that it is semi-metallic (metallic properties with a low density of carriers). They provide support for this claim by comparing to the behavior of xenon under pressure, in particular the electrical conductivity or resistivity. Xenon was first shown to become semi-metallic at a pressure of 132 GPa by Goettel et al. [Citation95]. It had very interesting optical properties, being semi-transparent in the visible and absorbing in the near IR. According to the Drude free-electron model, at frequencies higher than the plasma frequency a metal becomes transparent; it strongly reflects at lower frequencies [Citation96]. Most common metals have plasma frequencies in the UV so they reflect in the visible. The plasma frequency of xenon was found to be in the IR due to the low carrier density and it was deemed semi-metallic. Subsequently, Eremets et al. [Citation97] studied xenon to very low temperatures (27 mK) in a dilution refrigerator, measuring the electrical conductivity or resistivity, shown in , left. A fundamental criterion [Citation98] for a metal is that the electrical conductivity is finite in the limit , or the slope of the resistance
in this limit. Thus, we see in that at 141 GPa, the criterion is not met and temperatures below 1 K were necessary to show this at a higher pressure. At 155 GPa the criterion is satisfied. They state ‘The temperature dependence of resistance changed from semiconducting to metallic at pressures between 121 and 138 GPa…’. To complete this discussion, Dewaele et al. [Citation99] also studied the metallization of xenon under pressure and showed that a small concentration of oxygen impurities drastically reduced the metallization pressure.
Figure 10. Left. Temperature dependence of resistance of xenon at two pressures. Right. Temperature dependence of hydrogen at 360 GPa (upper curve)
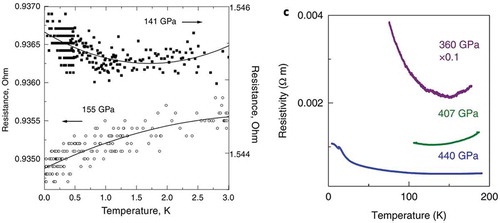
Returning to Eremets et al. [Citation94], they claimed that hydrogen is semi-metallic at 360 GPa and refer to their , that we reproduce in , right. They state that the increasing resistance as temperature is lowered is due to a decrease in carriers with decreasing temperature. Eremets et al. seem to have ignored the well-known criterion for a metal, in the low temperature limit, studied in their xenon paper. The logical interpretation of this figure is that hydrogen is semiconducting at this pressure: the resistance is very high at low temperature and changes slope at about 150 K due to thermal population of the conduction band. Thus, this claim of molecular metallic hydrogen by Eremets et al. is not supported by their own experimental measurements and criteria that they knew to hold in their xenon paper. At 440 GPa they find an interesting temperature dependence (to 4.2 K) of the resistivity), but the slope is negative, i.e. resistance is rising with lowering of T (see their Supplementary Information, ). In a theoretical paper, Azadi and Kuhne [Citation100] predict that molecular hydrogen will dissociate to WHMH before it ionizes.
In 2019 LOD placed a paper on the CM arXiv [Citation101] entitled ‘Observation of a first-order phase transition to metal hydrogen near 425 GPa. This was criticized, as the article had no proof of metallization [Citation102] (proof of metallization in DACs is generally a measurement of reflectance or conductivity at low temperature) and was subsequently published with the title ‘Synchrotron infrared spectroscopic evidence of the probable transition to metal hydrogen’. Their claim was based on extinction of the light transmission in the IR attributed to closing of the electronic band gap. A prior measurement of extinction of IR transmission [Citation4] was attributed to semiconducting behavior. LOD argue that they made molecular metallic hydrogen when their sample becomes opaque in the IR. They based their claim on resistance measurements by Eremets et al.; it was shown above that semi-metallic behavior claimed by Eremets et al. is questionable.
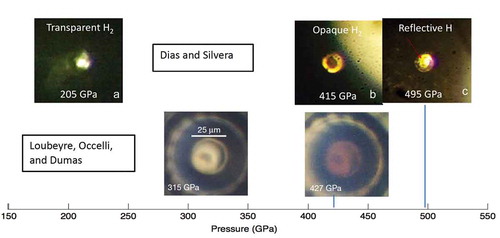
LOD used a ‘toroidal’ DAC in which the culet of the diamonds are shaped by focused ion beam techniques. They used this to achieve higher pressures, claiming that a conventional DAC is limited to 400 GPa, which we have shown above to be false. LOD measure pressure from the shift of the diamond phonon in the stressed region and claim a maximum pressure of 425 GPa, at which the gap is closed. They also claim that use of a synchrotron source is essential for IR spectroscopy, which is specious. They use an optical geometry similar to one using a thermal source for IR spectroscopy [Citation57]; FTIR has been used at higher pressures with a thermal source [Citation2]. LOD visually observe hydrogen to become black at 310 GPa (earlier reported at 320 GPa [Citation66] and 300 GPa [Citation103]). They took photos of their sample shown in . We compare to the photos from the observation of WHMH (see ). We note that only one other research group sees hydrogen blackening in the visible; all others see darkening in the pressure region of 350–370 GPa in phase H2-PRE (or VI) observed by us and the Eremets group. They compare their work to that of Eremets et al. [Citation94], but report pressures that range 20 to 45 GPa lower, based on the diamond phonon scale. Thus, there is a pressure measurement problem or the samples are different. Finally, we point out that LOD do not observe the H2-PRE phase (or VI) observed by us and the Eremets group.
Figure 11. A comparison of photos of hydrogen as a function of pressure in visible light taken by Dias and Silvera and LOD. The upper panel is the same as . The lower panel from LOD is both front and back lit. At 315 GPa the sample (dark spot in the middle) becomes black in the visible; our hydrogen samples are transparent at this pressure. Their ~5 micron diameter sample remains black in the visible, to their maximum pressure of 427 GPa
LOD have made unsupported claims, but they are experienced researchers, so how can we interpret their results or understand the experimental conflicts. The most important conflicts with others is that LOD’s samples become opaque in the visible at pressures ranging between 300 and 320 GPa, their vibron pressure scale differs from other researchers studying hydrogen, and they do not see a phase transition observed by others (H2-PRE, VI). Assuming hydrogen to be semi-metallic, LOD used data from Eremets et al. to estimate the plasma frequency, using a Drude model and find it to be smaller than 0.1 eV (~12 microns in the IR). As discussed above in Section 4.3, at shorter wavelengths, the sample should be transparent, but already at 300 GPa LOD find hydrogen to be black at the shorter wavelengths in the visible.
How can competent groups have such different observations? We propose that LOD’s hydrogen samples may be contaminated with metallic impurities that can change the properties of pure molecular hydrogen, i.e. they are not studying a pure sample of hydrogen. Already in their study of xenon, Dewaele et al. [Citation99] showed that the metallization pressure is very sensitive to a small concentration of oxygen impurities. The same could hold for hydrogen. As discussed above Carlsson and Ashcroft [Citation29] proposed that a small concentration of metallic impurities could lower the metallization pressure of hydrogen. Recent experiments show that so-called hydrides-hydrogen with impurities - are easy to prepare as metals that have high superconducting transition temperatures.
Hydrogen is very reactive and diffusive and this is temperature dependent. At Harvard we avoid this by confining hydrogen in metallic gaskets; hydrogen and the gasket are only in contact at low temperatures. On the other hand, LOD load their DACs with hydrogen into metallic gaskets at room temperature in a metallic chamber. The molecular hydrogen is at liquid densities and room temperature and is in contact with metals for undisclosed periods of time that can vary from run to run. It is possible that in this time, before pressurizing and cooling, metals can dissolve into the hydrogen. Some years ago H. Shimizu et al. studied Brillouin scattering (BS) in hydrogen in a DAC [Citation104,Citation105]. Shimizu found that in the study of liquid hydrogen the BS signal varied in time and that this was due to an increasing concentration of metallic impurities dissolved into the hydrogen. In the case of LOD this might explain why they report blackening in the visible at varying pressures, 300, 310, and 320 GPa. It might also be the reason that their samples become opaque in the visible, not observed by others. It could also explain their difference in the vibron pressure scale, as impurities could cause electrons to transfer density out of the hydrogen bonds and soften the vibron frequencies [Citation106]. Their samples may have a different phase diagram and no H2-PRE phase. Finally, we note that in their IR spectra, LOD observe an absorption line attributed to an impurity in their hydrogen sample.
In conclusion it seems that the only evidence of MH in Pathway I is the WHMH shown in and . Molecular MH may exist but at this time there is no convincing evidence of this phase. Results of the Eremets group are not convincing when one studies the behavior of the resistance in the low temperature limit. In the H2-PRE phase, as pressure is increased hydrogen darkens at pressures ~370 GPa, due to a closing of the electronic bandgap. LOD do not observe the H2-PRE phase. The data that LOD present may well be valid, however it is probably not from a sample of pure hydrogen, rather one contaminated with metallic impurities. It would be useful for LOD to repeat their experiment with a cryogenically loaded sample.
What are the known structures of hydrogen? Viewing the phase diagram in the low-temperature limit, Pathway I in , the low pressure low-temperature phase of para-hydrogen (or phase I) is an HCP crystal [Citation107] (see also ref [Citation3].), whereas ortho-hydrogen orientationally orders into the Pa3 structure (). The structure of the BSP phase was studied by Xray and neutron diffraction in deuterium, but a structure was not determined [Citation108]; the H-A or phase III probably has the structure C2/c-24 as there is good agreement between measurements of the vibron [Citation109] and calculation of the pressure dependence of this mode [Citation83]. The structure of phase H2-PRE is undetermined, but possibly could be the Cmca-12 structure [Citation7–9,Citation110]; the WHMH is predicted to have the I41/amd-2 structure. Ji et al. [Citation111] have done extensive Xray studies on single-crystal hydrogen at room temperature up to 254 GPa and find phases I, III, and IV to be compatible with distorted HCP lattices; they determined lattice parameters, but were unable to index the structures.
5. Pathway II: the high-T liquid-liquid phase transition (LLPT)
The LLPT or plasma phase transition, briefly mentioned in Section 2.2 (black line in ), has been studied extensively in recent years, both with dynamic and static techniques. In dynamic experiments, a shock wave produces high pressures and very high temperatures, (tens of thousands degrees K). Techniques were developed such as reverberating waves with gas guns, or shaped magnetic compression pulses in the Sandia National Laboratory Z-machine [Citation112], or shaped laser pulses in the National Ignition Facility (NIF) at Livermore National Laboratory [Citation113] to achieve pressures of several hundred GPa and peak temperatures of a few thousand K. The peak P,T conditions exist for times of nano to micro seconds; T is not measured, but determined from models and could have a large uncertainty. Dynamic experiments are very expensive, carried out in large government supported facilities, run by a crew of technicians, in addition to the scientific researchers. Due to limitations on access, there is sometimes a paucity of data points in dynamic experiments.
In static DAC experiments, the pressure is essentially constant while samples are heated for a few hundred nanoseconds or longer to temperatures up to a few thousand degrees K, using pulsed laser heating of samples [Citation114]. The laser heats a semi-transparent absorber that heats the hydrogen by conduction. Static DAC experiments are carried out by a few experimenters in a laboratory. Diagnostics are usually optical to measure temperature (from grey-body emissivity), pressure, transmission, and reflectance. Both P and T are measured experimentally.
Dzyabura, Zaghoo, and Silvera [Citation115] observed a phase transition in hydrogen in a DAC using pulsed laser heating, but had no evidence that the transition was to the metallic state. Zaghoo, Salamat, and Silvera [Citation114] studied the reflectance and transmission of hydrogen as a function of P and T (, left). They measured heating curves at each pressure, i.e. the peak temperature of the hydrogen as a function of laser power; temperatures were such that the sample was heated above the melting temperature. The peak temperature rises as pulsed laser power is increased. They observed a plateau in the heating curve and for higher temperatures the sample displayed metallic reflectance. The plateau is expected for a first-order phase transition as energy goes into the latent heat of transition rather than increasing the temperature. They interpreted the P,T of the plateaus as the phase transition points, shown in , right, in good agreement with theories. Subsequent measurements of reflectance as a function of wavelength were fit to the Drude free-electron model [Citation116]. This yields the density of electrons and from this they determined that the LMH was atomic. Measurements by Ohta et al. (, right) [Citation117] are in agreement with those of Ref [Citation114].
Figure 12. Left: Reflectance and transmission of hydrogen in static pulsed laser measurements. As the temperature of rises, the LMH sample thickens; reflectance saturates and transmission goes to zero as expected for a thick metal. Right: comparison of experiment and theory for the LLPT
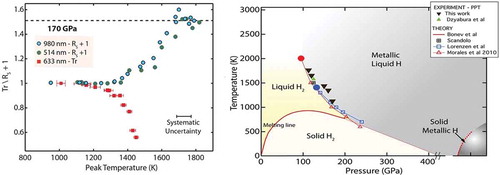
Figure 13. Left: Phase lines for the LLPT, comparing results of the two dynamic experiments (green, blue) and the static one (red, black). Right: comparison of several experiments as well as calculation of the isotope effect (CEIMC). The red arrows show the difference in phase lines for hydrogen and deuterium. The theoretical result of a few hundred K is compared to ~700 K in the static measurement
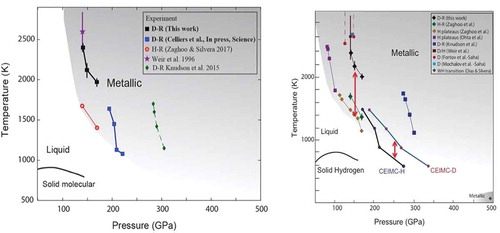
Dynamic experiments with shaped pulses have been carried out on deuterium to probe the LLPT. Knudson et al. [Citation112] carried out such experiments at the Z-machine. Their results are shown in , left (green filled diamonds). The analysis of measurements to obtain P, T points on a phase line is challenging. These results caused some controversy as an extrapolation of their P,T curve seemed to be way off from the earlier result of Weir et al. [Citation19], and would indicate a very large isotope effect (shift of phase line from that of Zaghoo and Silvera [Citation116] for hydrogen). Pierleoni et al. [Citation118] calculated a much smaller isotope effect and different phase lines. Zaghoo, Husband, and Silvera [Citation119] then studied the LLPT in deuterium (, left, black line). Celliers et al. [Citation113] also studied the PPT in deuterium, using dynamic techniques at NIF, and found the blue line in , left, in reasonable agreement (by extrapolation) with the static results and a large pressure shift of about 95 GPa from the line of Knudson et al., at the same temperature (temperature is calculated, not measured, in dynamic experiments). They suggested that the different results are related to the time scale of the two experiments that differ by a few orders of magnitude and proposed a model for interpretation. Desjarlais, Knudson, and Redmer [Citation120,Citation121] countered with a thermodynamic model, essentially saying that the latent heat of transformation was not properly taken into consideration; Celliers et al. responded to their comment [Citation122]. It appears that the discussion persists.
There is also a problem in comparing phase lines in static and dynamic experiments. Static experiments determine the phase line from the plateaus in the heating curves. Dynamic experiments do not study heating curves and use the rapid rise of reflectance as the onset of metallization and the P-T point. To decide on a criterion, Houtput, Tempere, and Silvera [Citation123] carried out a realistic Finite Element Analysis (FEA) with a result showing that the plateau is the appropriate criterion. They proposed a test that dynamic experimenters could carry out. In a theoretical paper, Rillo et al. [Citation82] disagree with the criterion of the plateau indicating the P,T value of the transition. They propose that the plateau is due to optical absorption, but this does not seem to make sense. The first-order phase transition has latent heat, and the plateau is what one expects in a heating curve. Houtput et al. find that a larger value for the latent heat than the value calculated by Rillo et al. is needed for the plateau. Norman and Saitov [Citation124] proposed a mechanism for this.
A group headed by A. Goncharov using pulsed laser heating in a DAC did not find the LLPT, rather they reported a semiconducting state, as well as semi-metallic behavior [Citation125]. This was in serious disagreement with the results of Zaghoo et al. [Citation114] who observed the first-order transition. It was pointed out that Goncharov et al.’s experiment had a flaw in the design of the sample absorber used for heating and in the use of spatial filters that would give spurious results [Citation126]. This group has again studied hydrogen and deuterium in a DAC, this time observing the first-order phase line, reporting substantially higher temperatures for the phase line and no isotope effect [Citation127]. Their supplementary Figure 1 shows that they are still using the same experimental design that was flawed, so we do not plot their arXiv results in .
The LLPT has been studied both at static pressures and dynamic shock pressures and temperatures. The original dynamic observation of the transition to liquid MH appeared to be continuous. The theoretically predicted first-order phase transition was then observed using static methods in a DAC. At the same time, there were dynamic experiments with staged compression that reported very different results for the phase line; one of these appear to agree with the static experiments, by extrapolation. Both shock groups are in discussion over their conflicting results. Dynamic experiments probing the LLPT have been carried out only on deuterium. Static measurements on both hydrogen and deuterium exhibit isotopic shifts of the P-T phase lines that is larger than theoretical predictions. Theory predicts a critical point at lower pressures and higher temperatures; this has not yet been observed. indicates that there should be a triple point (liquid molecular, liquid atomic, solid molecular) at higher pressures and lower temperatures. This also has not been observed. It would be interesting to study the region where metallic liquid hydrogen and WHMH meet, to further complete the phase diagram.
6. Future directions and prospects
We have just mentioned some of the remaining challenges for the LLPT, so we focus here on WHMH. There are a number of exciting questions to be answered. Is WHMH a high temperature, possibly room temperature superconductor? If so, what is the pressure dependence of the transition temperature, Tc? Is WHMH a solid or a liquid at low temperature? Is WHMH metastable, and if so what is the metastability temperature, i.e. the temperature where it reverts to molecular hydrogen? What is the transition pressure of deuterium and will it have a higher metastability temperature than hydrogen, due to its smaller ZPM? What will happen to HD at very high pressures above the pressure where DISREC sets in? Does hydrogen have a molecular metal phase? The techniques for producing ultra-high pressures are challenging but continue to improve. Clearly, the production of WHMH in the laboratory has created an exciting substance to study and understand; this in the simplest of all atoms.
Acknowledgments
IFS acknowledges funding from the NSF, award DMR-1905943 and the SSAP of the DoE, award DE-NA0003917. Support has also been derived from Harvard’s Dean’ Competitive Fund. We also acknowledge support from the Harvard Center for Nanoscale Systems, supported by the NSF award no. 1541959. RD acknowledges funding from NSF, Grant No. DMR-1809649, DOE Stockpile Stewardship Academic Alliance Program, Grant No. DE-NA0003898. We thank R. Husband, J. Song, and I. Chuvashova for contributions in experiments to reproduce WHMH.
Disclosure statement
No potential conflict of interest was reported by the author(s).
Additional information
Funding
References
- Wigner E, Huntington HB. On the Possibility of a Metallic Modification of Hydrogen. The Journal of Chemical Physics. 1935;3:764.
- Dias R, Silvera IF. Observation of the Wigner-Huntington Transition to Solid Metallic Hydrogen. Science. 2017;355:715–718.
- Silvera IF. The solid molecular hydrogens in the condensed phase: fundamentals and static properties. Reviews of Modern Physics. 1980;52:393.
- Dias R, Noked O, Silvera IF. Quantum Phase Transition in Solid Hydrogen at High Pressure. Phys Rev B. 2019;100:184112.
- Drummond ND, Monserrat B, Lloyd-Williams JH, et al. Quantum Monte Carlo study of the phase diagram of solid molecular hydrogen at extreme pressures. Nature Communications. 2015;6. DOI:https://doi.org/10.1038/ncomms8794
- Clay RC, Mcminis J, McMahon JM, et al. Benchmarking exchange-correlation functionals for hydrogen at high pressures using quantum Monte Carlo. Phys Rev B. 2014;89. DOI:https://doi.org/10.1103/PhysRevB.89.184106
- Azadi S, Monserrat B, Foulkes WMC, et al. Dissociation of High-Pressure Solid Molecular Hydrogen: a Quantum Monte Carlo and Anharmonic Vibrational Study. Physical Review Letters. 2014;112:165501.
- McMinis J, Clay RCCIII,D, Lee D. Molecular to Atomic Phase Transition in Hydrogen under High Pressure. Physical Review Letters. 2015;114:105305.
- Rillo G, Morales MA, Ceperley DM, et al. Coupled electron-ion Monte Carlo simulation of hydrogen molecular crystals. J Chem Phys. 2018;148:102314.
- Borinaga M, Riego P, Leonardo A, et al. Anharmonic enhancement of superconductivity in metallic molecular Cmca − 4 hydrogen at high pressure: a first-principles study. Journal of Physics: Condensed Matter. 2016;28:494001.
- Brovman EG, Kagan Y, Kholas A. Properties of Metallic Hydrogen under Pressure. Sov Phys JETP. 1972;35:783-787.
- Babaev E, Sudbo A, Ashcroft NW. A superconductor to superfluid phase transition in liquid metallic hydrogen. Nature. 2004;431:666–668.
- Ramaker DE, Kumar L, Harris FE. Exact-Exchange Crystal Hartree-Fock Calculations of Molecular and Metallic Hydrogen and Their Transitions. Physical Review Letters. 1975;34:812.
- Friedli C, Ashcroft NW. Combined representation method for use in band-structure calculations: application to highly compressed hydrogen. Physical Review B. 1977;16:662.
- Cudazzo P, Profeta G, Sanna A, et al. Ab Initio Description of High-Temperature Superconductivity in Dense Molecular Hydrogen. Physical Review Letters. 2008;100:257001.
- Landau LD, Zeldovich YB. On the relation between the liquid and the gaseous states of metals. Acta Phys -chim USSR. 1943;18:380.
- Norman GE, Starostin AN. The invalidity of the classsical description of a non-degnerated dense plasma. Teplofiz Vys Temp. 1968;6:410.
- McMahon JM, Morales MA, Pierleoni C, et al. The properties of hydrogen and helium under extreme conditions. Reviews of Modern Physics. 2012;84:1607–1653.
- Weir ST, Mitchell AC, Nellis WJ. Metallization of Fluid Molecular Hydrogen at 140 GPa (1.4 Mbar). Physical Review Letters. 1996;76:1860.
- Guillot T. The interiors of giant Planets: models & outstanding questions. Annual Review of Earth and Planetary Sciences. 2005;33:493.
- Ashcroft NW. Metallic Hydrogen: a High-Temperature Superconductor? Phys Rev Lett. 1748;21:1968.
- McMahon JM, Ceperley DM. High-temperature superconductivity in atomic metallic hydrogen. Phys Rev B. 2011;84:144515.
- Borinaga M, Errea I, Calandra M, et al. Anharmonic effects in atomic hydrogen: superconductivity and lattice dynamical stability. Phys Rev B. 2016;B 93:174308.
- Kudryashov NA, Kutukov AA, Mazuer EA. Critical temperature of metallic hydrogen at a pressure of 500 GPa. JETP Lett. 2016;104:460.
- Yan Y, Gong J, Liu Y. Ab initio studies of superconductivity in monatomic metallic hydrogen under high pressure. Phys Lett A. 2011;375:1264.
- Verma AK, Modak P, Schrodi F, et al., Phonon-mode specific contributions to room-temperature superconductivity in atomic hydrogen at high pressures, CM arXiv 2011.11883 (2020).
- Tinkham M. Energy Gap Interpretation of Experiments on Infrared Transmission through Superconducting Films. Phys Rev. 1956;104:845.
- Carbotte JP, Nicol EJ, Timusk T. Detecting Superconductivity in the High Pressure Hydrides and Metallic Hydrogen from Optical Properties. Phys Rev Lett. 2018;121:047002.
- Carlsson AE, Ashcroft NW. Approaches for Reducing the Insulator-Metal Transition Pressure in Hydrogen. Phys Rev Lett. 1983;50:1305.
- Ashcroft NW. Hydrogen Dominant Metallic Alloys: high Temperature Superconductors? Phys Rev Lett. 2004;92:187002.
- Drozdov AP, Eremets MI, Troyan IA, et al. Conventional superconductivity at 203 kelvin at high pressures in the sulfur hydride system. Nature. 2015;525:73-76.
- Drozdov AP, et al. Superconductivity at 250 K in lanthanum hydride under high pressures. Nature. 2019;569:528-531.
- Somayazulu M, Ahart M, Mishra AK, et al. Evidence for Superconductivity above 260 K in Lanthanum Superhydride at Megabar Pressures. Phys Rev Lett. 2019;122:027001.
- Snider E, Dasenbrock-Gammon N, McBride R, et al. Room-temperature superconductivity in a carbonaceous sulfur hydride. Nature. 2020;586:373-377.
- Hardy WN, Silvera IF, McTague JP. Raman Scattering in Oriented Crystals of Paradeuterium and Orthohydrogen. Phys Rev B. 1975;12:753.
- Silvera IF, Jochemsen R. Orientational Ordering in Solid Hydrogen: dependence of Critical Temperature and Concentration on Density. Phys Rev Lett. 1979;43:337.
- Silvera IF, in AIRAPT (Forschungszentrum Karlsruhe http://bibliothek.fzk.de/zb/verlagspublikationen/AIRAPT_EHPRG2005/, Karlsruhe, Germany, 2005.
- Sharma SK, Mao HK, Bell PM. Raman Measurements of Hydrogen in the Pressure Range 0.2-630 Kbar at Room Temperature. Phys Rev Lett. 1980;46:886.
- Raich JC, Etters RD. Rotational Molecular Motion in Solid H2 and D2 Under Pressure. J Low Temp Phys. 1972;6:229.
- Silvera IF, Wijngaarden RJ. New low temperature phase of molecular deuterium at ultra high pressure. RPhys ev Lett. 1981;47:39.
- Lagendijk A, Silvera IF. Roton Softening in the Solid Hydrogen. Phys Letters. 1981;84A:28.
- Lorenzana HE, Silvera IF, Goettel KA. Orientational Phase Transitions in Hydrogen at Megabar Pressures. Phys Rev Lett. 1939;64:1990.
- Hemley RJ, Mao HK. Phase Transition in Solid Molecular Hydrogen at Ultrahigh Pressures. Phys Rev Lett. 1988;61:857.
- Lorenzana HE, Silvera IF, Goettel KA. Evidence for a Structural Phase Transition in Solid Hydrogen at Megabar Pressures. Phys Rev Lett. 1989;63:2080.
- Hemley RJ, Mao HK. Isotope Effects in Dense Solid Hydrogen: phase Transition in Deuterium at 190(±20) GPa. Phys Rev Lett. 1989;63:1393.
- Hemley RJ, Mao HK, Hanfland M. Spectroscopic Investigations of the Insulator-Metal Transition in Solid Hydrogen. In: Pucci R, Piccitto G, eds. Molecular Systems Under High Pressure, North-Holland, Amsterdam; 1991. p. 223.
- Cui L, Chen NH, Jeon SJ, et al. Megabar pressure triple point in solid deuterium, Phys. Rev Lett. 1994;72:3048.
- Vereschagin LF, Yakovlev EN, Timofeev YA. Possibility of transition of hydrogen into the metallic state. JETP Lett. 1975;21: 85-86.
- Lorenzana HE, Boppart H, Silvera IF. A Study of Pressure Distributions in a Megabar Diamond Indentor Cell. Rev Sci Instrum. 1988;59:2583.
- Mao H-K, Hemley R. Optical Studies of Hydrogen above 200 Gigapascals: evidence for Metallization by Band Overlap. Science. 1989;244:1462.
- Silvera IF. Evidence for Band Overlap Metallization of Hydrogen. Science. 1990;247.
- Mao HK, Hemley RJ, Hanfland M. Infrared Reflectance Measurements of the Insulator-Metal Transition in Solid Hydrogen. Phys Rev Lett. 1990;65:484.
- Eggert JH, Goettel KA, Silvera IF. High Pressure Dielectric Catastrophe and the Possibility that the Hydrogen-A Phase is Metallic. Europhys Lett. 1990;11:775.
- Hemley RJ, Hanfland M, Mao HK. High Pressure Dielectric Measurements of Solid Hydrogen to 170 GPa. Nature. 1991;350:488.
- Eggert JH, Moshary F, Evans WJ, et al. Absorption and Reflectance in Hydrogen up to 230 GPa: implications for Metallization. Phys Rev Lett. 1991;66:193.
- Hanfland M, Hemley RJ, Mao HK. Optical Absorption Measurements of Hydrogen at Megabar Pressures. Phys Rev B. 1991;43:8767.
- Chen NH, Sterer E, Silvera IF. Extended infrared studies of high pressure hydrogen. Phys Rev Lett. 1663;76:1996.
- Hemley RJ, Mao H-K, Goncharov AF, et al. Synchrotron Infrared Spectroscopy to 0.15 eV of H2 and D2 at Megabar Pressures. Phys Rev Lett. 1667;76:1996.
- Hawke RS, Burgess TJ, Duerre DE, et al. Observation of Electrical Conductivity of Isentropically Compresssed Hydrogen at Megabar Pressures. Phys Rev Lett. 1978;41:994.
- Nellis WJ, Weir ST, Mitchell AC. Metallization and electrical conductivity of hydrogen in Jupiter. Science. 1996;273:936-938.
- Bonev SA, Schwegler E, Ogitsu T, et al. A quantum fluid of metallic hydrogen suggested by first-principles calculations. Nature. 2004;431:669-672.
- Deemyad S, Silvera IF. Melting Line of Hydrogen at High Pressures. Phys Rev Lett. 2008;100:155701.
- Subramanian N, Goncharov AF, Struzhkin VV, et al. Bonding changes in hot fluid hydrogen at megabar pressures. Proc Nat Acad Sci. 2011;108:6014.
- Howie R, Dalladay-Simpson P, Gregoryanz E. Raman spectroscopy of hot hydrogen above 200 GPa. Nat Mater. 2015;14:495.
- Narayana C, Luo H, Orloff J, et al. Solid hydrogen at 342 GPa: no evidence for an alkali metal. Nature. 1998;393:46.
- Loubeyre P, Occelli F, LeToullec R. Optical studies of solid hydrogen to 320 GPa: evidence for black hydrogen. Nature. 2002;416:613.
- Eremets MI, Troyan IA. Conductive Dense Hydrogen. Nat Mater. 2011;10:927.
- Nellis WJ, Ruoff AL, Silvera IF, Has Metallic Hydrogen Been Made in a Diamond Anvil Cell?, arXiv:1201.0407v1 (2012).
- Eremets MI, Troyan IA, Lerch P, et al. Infrared study of hydrogen up to 310GPa at room temperature. High Pressure Res. 2013;33:377.
- Zha CS, Liu Z, Ahart M, et al. High-Pressure Measurements of Hydrogen Phase IV Using Synchrotron Infrared Spectroscopy. Phys Rev Lett. 2013;110:217402.
- Loubeyre P, Occelli F, Dumas P. Hydrogen phase IV revisited via synchrotron infrared measurements in H2 and D2 up to 290 GPa at 296 K. Phys Rev B. 2013;87:134101.
- Howie RT, Guillaume CL, Scheler T, et al. Mixed molecular and atomic phase of dense hydrogen. Phys Rev Lett. 2012;108:125501.
- Howie RT, Scheler T, Guillaume CL, et al. Proton tunneling in phase IV of hydrogen and deuterium. Phys Rev B. 2012;86:214104.
- Pickard C, Needs RJ. Structure of phase III of solid hydrogen. Nat Phys. 2007;3:473-476.
- Pickard CJ, Martinez-Canales M, Needs RJ. Density functional theory study of phase IV of solid hydrogen. Phys Rev B. 2012;85:214114.
- Liu H, Ma Y. Proton or Deuteron Transfer in Phase IV of Solid Hydrogen and Deuterium. Phys Rev Lett. 2013;110:025903.
- Magdau IB, Ackland GJ. Identification of high-pressure phases III and IV in hydrogen: simulating Raman spectra using molecular dynamics. Phys Rev B. 2013;87:174110.
- Dias R, Noked O, Silvera IF. New Phases and Dissociation-Recombination of Hydrogen Deuteride to 3.4 Megabar. PRL. 2016;116:145501.
- Dias R, Noked O, Silvera IF, New Quantum Phase Transition in Dense Hydrogen: the Phase Diagram to 420 GPa, arXiv:1603.02162v1 (2016).
- Eremets MI, Troyan IA, Drozdov AP, Low temperature phase diagram of hydrogen at pressures up to 380 GPa. A possible metallic phase at 360 GPa and 200 K, arXiv:1601.04479 (2016).
- Eremets MI, Drozdov AP, Kong PP, et al., Molecular semimetallic hydrogen, arXiv:1708.05217 (2017).
- Rillo G, Morales MA, Ceperley DM, et al., Optical properties of high pressure liquid hydrogen across molecular dissociation, Proceedings of the National Academy of Sciences of the United States of America 116, 9770-9774 (2019).
- Dogan M, Oh S, Cohen ML. Observed metallization of hydrogen interpreted as a band structure effect. J Phys Cond Matter. 2021;33:1.
- Dalladay-Simpson P, Howie RT, Gregoryanz E. Evidence for a new phase of dense hydrogen above 325 gigapascals. Nature. 2016;529:63.
- Dias R, Noked O, Silvera IF, “No Evidence for a new phase of dense hydrogen above 325 gigapascals”, condensed matter arXiv:1605.05703 (2016).
- Silvera IF, Dias R. Metallic Hydrogen. J Phys Condens Matter. 2018;30:254003.
- Nellis WJ. Metallic liquid hydrogen and likely Al2O3 metallic glass | springerLink. Eur Phys J Spec Top. 2011;196:121.
- Liu H, Tse JS, Nellis WJ. The electrical conductivity of Al2O3 under shock-compression. Sci liuRep. 2015;5:12823.
- Shen G, et al. Toward an international practical pressure scale: a proposal for an IPPS ruby gauge (IPPS-Ruby2020). High Pressure Res. 2020;40:299-341.
- Liu XD, Dalladay-Simpson P, Howie RT, et al. Comment on “Observation of the Wigner-Huntington transition to metallic hydrogen. Science. 2017;357:6353.
- Ruoff AL, Xia H, Xia Q. The Effect of a Tapered Aperature on X-ray Diffraction from a Sample with a Pressure Gradient: studies on Three Samples with a Maximum Pressure of 560 GPa. Rev Sci Instrum. 1992;63:4342.
- Goncharov AF, Struzhkin VV, Comment on Observation of the Wigner-Huntington transition to metallic hydrogen, arXiv:1702.04246 (2017).
- Silvera IF, Dias R. Erratum for the Research Article “Observation of the Wigner-Huntington transition to metallic hydrogen”. Science. 2017;357:eaao5843.
- Eremets MI, Drozdov AP, Kong PP, et al., Semimetallic molecular hydrogen at pressure above 350 GPa, Nature Physics (2019).
- Goettel KA, Eggert JH, Silvera IF, et al. Optical Evidence for the Metallization of Xenon at 132 (5)GPa. Phys Rev Lett. 1989;62:665.
- Wooten F. Optical Properties of Solids. Academic Press, Inc., New York; 1972.
- Eremets MI, Gregoryanz EA, Struzhkin VV, et al. Electrical Conductivity of Xenon at Megabar Pressures. Phys Rev Lett. 2000;85:2797.
- Mott NF. Metal-Insulator Transitions. 2nd ed. London: Taylor & Francis; 1990.
- Dewaele A, Loubeyre P, Dumas P, et al. Oxygen impurities reduce the metallization pressure of xenon. Phys Rev B. 2012;86:014103.
- Azadi S, Kuhne TD. Absence of Metallization in Solid Molecular Hydrogen. JETP Lett. 2012;95:449-453.
- Loubeyre P, Occelli F, Dumas P, Observation of a first order phase transition to metal hydrogen near 425 GPa., ArXiv:1906.05634 (2019).
- Silvera IF, Dias R, Comment on: observation of a first order phase transition to metal hydrogen near 425 GPa., arXiv: 1907.03198 (2019).
- Loubeyre P, Occelli F, Dumas P, Comment on: observation of the Wigner-Huntington transition to metallic hydrogen., condensed matter arXiv:1702.07192 (2017).
- Shimizu H, Brody EM, Mao HK, et al., Brillouin Measurements of n-H2 and n-D2 in the Pressure Range 0.5 to 20 GPa at Room Temperature, Adv.in Earth and Planetary Sci,High Press.Res.Geophys. 12, 135-145 (1982).
- Shimizu H, Kumazawa T. Equation of State for Fluid Hydrogen-Isotopes H2, D2, and T2 up to Their Freezing Points at 300 K. J Chem Phys. 1983;78:4632.
- Loubeyre P, Jean-Louis M, Silvera IF. Density dependence of the intramolecular distance in solid H2: a spectroscopic determination. Phy Rev. 1991;B 43:10191.
- Keesom WH, Smedt JD, Mooy HH. Crystal structure of parahydrogen. Nature. 1930;126:757.
- Goncharenko I, Loubeyre P. Neutron and X-ray diffraction study of the broken symmetry phase transition in solid deuterium. Nature. 2005;435:1206-1209.
- Loubeyre P, Occelli F, Dumas P. Synchrotron infrared spectroscopic evidence of the probable transition to metal hydrogen. Nature. 2020;577:631-635.
- Azadi S, Foulkes WMC, Kühne TD. Quantum Monte Carlo study of high pressure solid molecular hydrogen. New J Phys. 2013;15:113005.
- Ji C, et al. Ultrahigh-pressure isostructural electronic transitions in hydrogen. Nature. 2019;573:558-562.
- Knudson MD, Desjarlais MP, Becker A, et al. Direct observation of an abrupt insulator-to-metal transition in dense liquid deuterium. Science. 2015;348:1455-1459.
- Celliers PM, et al. Insulator-metal transition in dense fluid deuterium. Science. 2018;361:677-682.
- Zaghoo M, Salamat A, Silvera IF. Evidence of a first-order phase transition to metallic hydrogen. Phys Rev B. 2016;93:155128.
- Dzyabura V, Zaghoo M, Silvera IF, Evidence of a liquid-liquid phase transition in hot dense hydrogen, Proceedings of the National Academy of Sciences of the United States of America 110, 8040-804 (2013).
- Zaghoo M, Silvera IF. Conductivity and Dissociation in Metallic Hydrogen with Implications for Planetary Interiors. Proc Nat Acad Sci. 2017;114:11873.
- Ohta K, Ichimaru K, Einaga M, et al. Phase boundary of hot dense fluid hydrogen. Sci Rep. 2015;5:16560.
- Pierleoni C, Morales MA, Rillo G, et al. Liquid–liquid phase transition in hydrogen by coupled electron–ion Monte Carlo simulations. PNAS. 2016;113:4953-495.
- Zaghoo M, Husband R, Silvera IF. Striking Isotope Effect on the Metallization Phase Lines of Liquid Hydrogen and Deuterium. Phys Rev B. 2018;98:104102.
- Desjarlais MP, Knudson MD, Redmer R. Insulator-metal transition in dense fluid deuterium. Science. 2019;363:6433.
- Desjarlais MP, Knudson MD, Redmer R. Thermodynamics of the insulator-metal transition in dense liquid deuterium. Phys. Rev. B; 2020;101:104101-104108.
- Celliers PM, et al. Response to Comment on “Insulator-metal transition in dense fluid deuterium”. Science. 2019;363:6433-4
- Houtput M, Tempere J, Silvera IF, Finite element simulation of the liquid-liquid transition to metallic hydrogen, submitted to PRB; see arxiv (2018).
- Norman GE, Saitov IM. Ionization of Molecules at the Fluid–Fluid Phase Transition in Warm Dense Hydrogen. Doklady Physics. 2017;62:284-288.
- McWilliams RS, Dalton DA, Mahmood MF, et al. Optical Properties of Fluid Hydrogen at the Transition to a Conducting State. Phys Rev Lett. 2016;116:255501.
- Silvera IF, Husband R, Salamat A, et al., Expanded Comment on: optical Properties of Fluid Hydrogen at the Transition to a Conducting State, arXiv:1608.04479 (2016).
- Jiang S, Holtgrewe N, Geballe ZM, et al., Insulator-metal transition in liquid hydrogen and deuterium, arXiv:1810.01360 (2018).