
ABSTRACT
To address the increasing energy consumption and serious environmental problems, it is critical to develop efficient and clean energy conversion and storage devices. Among various categories of materials, metal-organic frameworks (MOFs) are one of the promising candidates that can realize the practical application of these devices. Therefore, it has been recognized that revealing the composition-structure-property relationship of MOFs by transmission electron microscopy (TEM) can offer some guidelines for designing novel materials with desirable properties. Nevertheless, owing to their organic parts, MOFs are too beam sensitive to be characterized by high energy electrons. To resolve this problem, various advanced techniques have been developed to accomplish the static and dynamic MOFs characterizations. Herein, we made a brief summary of the updated progress on characterization of MOFs by TEM until now, and revealed the key issues associated with static and dynamic TEM characterization of MOFs.
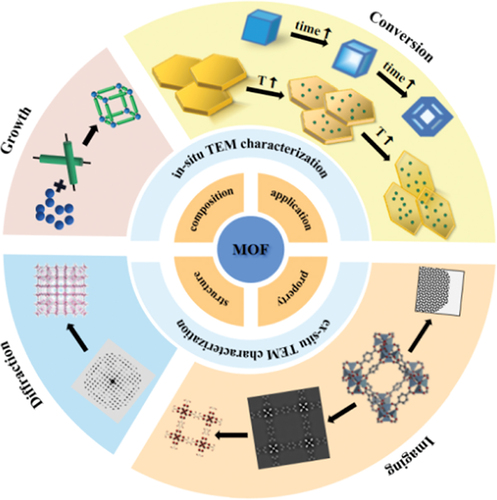
Graphical Abstract
1. Introduction
Over the past several decades, to realize the industrial application of renewable energy conversion/storage devices, researchers have been focusing on designing and developing various efficient, stable, economic, and green materials to improve their performance [Citation1–5]. Among various categories of materials, two typical types of porous crystalline materials, namely covalent organic frameworks (COFs) and metal-organic frameworks (MOFs), have occupied an important position. COFs are organic polymeric frameworks of strong covalent bonds connected light elements (C, N, B, O, S, H) [Citation6]. Meanwhile, MOFs are a class of porous organic-inorganic hybrids assembled by the coordination of metal ions/clusters and organic ligands [Citation7]. Hence, MOFs not only own the properties of both the organic and inorganic parts but also the characteristics resulted from their synergistic effect [Citation8]. Owing to their potential advantages, MOFs have attracted much attention and have been recognized as promising candidates for efficient energy storage and conversion devices [Citation5,Citation9–16]. Specifically: i) the porous structure can accelerate electrolyte ion transfer, expose more active sites, and withstand the volume variation during some reactions; ii) the open framework of MOFs provides a platform to change their properties by modifying their surrounding chemical and electronic structure; iii) by selecting specific ions/clusters and organic ligands, MOFs with customisable structures, topologies, and properties can be obtained. For these reasons, studying the composition, structure, and properties of MOFs is vitally important in understanding the composition-structure-property relationships, which can provide guidelines for designing novel material with specific functionalities. To address this issue, many novel and powerful tools have been developed and used for the characterization of MOFs and their derivatives, such as confocal fluorescence microscopy [Citation17], atomic force microscopy [Citation18], in-situ X-ray diffraction (XRD) [Citation19], transmission electron microscopy (TEM) [Citation20], etc. Among these various tools, TEM is the most potential one which can enable correlations between the bulk/local structure and composition of MOFs with their properties [Citation21]. However, most MOFs are easy to be damaged upon high energy electron irradiation. Therefore, unfortunately, it is hard to fulfill TEM characterization of MOFs under normal imaging conditions.
Normally, electron beam damage can be classified into several categories, specifically: 1) Knock-on damage or sputtering: direct electron–nucleus interaction caused atomic displacements or sputtering, which can be alleviated through using incident electrons with energy lower than the threshold energy for specific atomic displacement [Citation21–24]. 2) Radiolysis: electron–electron interaction induced chemical bonds breakage, which is in most cases can be eased through lowering temperature and increasing electron voltage [Citation21,Citation25–28]. 3) Heating: collective crystal lattice vibration occurred when high energy electron strikes atoms in the materials and can be reduced through cooling the specimen [Citation21,Citation29]. Regardless of the fact that materials beam sensitivity degree is affected by many factors, such as their chemical composition, bonding, size, morphology, crystal structure, etc., various reported experimental and theoretical results have identified radiolysis is the main beam damage of most MOFs.
To reduce beam damage and enable structural and compositional analysis of such beam-sensitive materials with high spatial and spectral resolution, many advanced equipments and techniques have been developed, such as aberration correctors, high-sensitivity cameras/detector, low electron-dose methods, powerful spectroscopic techniques, cryogenic TEM (cryo-TEM), etc [Citation30,Citation31]. Moreover, the development of environmental TEM (ETEM) and versatile holders realized in-situ characterization of various materials including beam-sensitive materials under a wide range of environmental conditions [Citation32]. The intrinsic and dynamic properties of MOFs have been investigated using such novel TEM techniques for in ex-situ and in-situ MOF characterization [Citation21,Citation33–35]. Although, many valuable reviews have already introduced and summarized the synthesis methods, characteristics, characterization, and applications of MOFs [Citation10,Citation12,Citation20,Citation21,Citation34–40], there is still lack of a systematic summary of TEM studies thereof. This mini review addresses that gap in the literature. The first section focuses on the crystallographic studies of MOFs by various electron diffraction (ED) techniques. The second section discusses the application of various imaging and spectroscopic techniques to the compositional and structural analysis of MOFs. The final part is devoted to in-situ TEM studies of the dynamic growth and conversion processes of MOFs. The aim of this review is revealing the key issues associated with static and dynamic TEM characterization of MOFs.
2. Electron diffraction
XRD techniques are typically used to elucidate the structure of a wide range of materials. However, using XRD to analyze the structure of nano-size and/or low symmetry crystals is challenging [Citation40,Citation41]. High energy electrons interact with materials much stronger than X-ray photons and of course can provide complementary imaging and spectroscopic information. As a result, TEM-based electron diffraction (ED) techniques have attracted much attention in the structural analysis of nanoscale materials, including MOFs [Citation16,Citation40]. Traditionally, to deduce the space group and unit cell of nanomaterials, ED patterns are acquired along specific zone axes. However, multiple electron scattering and dynamical effects in on-axis ED data can preclude accurate structural analysis [Citation40]. Moreover, tilting a crystal to a specific zone axis in an electron microscope can be time-consuming, resulting in the accumulation of beam-induced damage in beam-sensitive materials.
To address those issues, three-dimensional electron diffraction (3DED) techniques have been developed, which capture ED patterns at each angle while rotating a crystal along a random axis step-by-step [Citation32,Citation42–50]. In view of the fact that the dynamical scattering effect of off-axis ED pattern is minor, the diffraction intensities of 3DED data can be viewed as kinematica and can be used to conduct structure determination [Citation46]. In the early stage, 3DED data collection can be achieved in two ways: automated diffraction tomography (ADT) and rotation electron diffraction (RED). The former controls goniometer tilt and the latter controls both goniometer and electron beam tilt ( and ) [Citation42–44]. Acquiring 3DED data by either ADT or RED is fast. However, the crystal structure of porous, beam-sensitive MOFs can still be damaged during the acquisition process [Citation40]. To further reduce the time and electron dose needed for 3DED data collection, various continuous rotation electron diffraction techniques were developed including continuous rotation electron diffraction (cRED), microcrystal electron diffraction (MicroED), fast electron diffraction tomography (Fast EDT), serial rotation electron diffraction (SerialRED), etc [Citation32,Citation47–50]. As shown in , in comparison to stepwise ADT/RED, continuous rotation electron diffraction techniques acquire consecutive ED patterns as a movie while rotating the crystal continuously [Citation45]. Hence, the data acquisition time can be reduced to one to several minutes through controlling the goniometer rotation speed. To ensure the data come from the same crystal, a crystal-tracking solution was proposed by Cichocka et al. to track and center the crystal during data acquisition [Citation32]. Most importantly, the large number of diffraction patterns of the 3DED dataset results in highly accurate structure determination.
Figure 1. Illustration of step-wise (a) ADT, (b) RED and (c) continuous rotation electron diffraction techniques (reproduced from ref. 44 and ref. 45). Illustration of SED applied to a defect-engineered UiO-66(Hf) particle: (d) A 2D (kx,ky) diffraction pattern is recorded in transmission at every probe position in a 2D (x, y) scan. (e) Calculated 4D-SED for a defective UiO-66(Hf) octahedral particle (blue) containing defect nanodomains and imaged along the [01̅1] zone axis. Diffraction patterns from the (g) magenta region and (h) green region marked in (f), respectively. Virtual dark field image formed using integration windows centered on the (i) parent reflections and (j) superlattice reflections as marked in (g) and (h), respectively. (reproduced from ref. 62).
![Figure 1. Illustration of step-wise (a) ADT, (b) RED and (c) continuous rotation electron diffraction techniques (reproduced from ref. 44 and ref. 45). Illustration of SED applied to a defect-engineered UiO-66(Hf) particle: (d) A 2D (kx,ky) diffraction pattern is recorded in transmission at every probe position in a 2D (x, y) scan. (e) Calculated 4D-SED for a defective UiO-66(Hf) octahedral particle (blue) containing defect nanodomains and imaged along the [01̅1] zone axis. Diffraction patterns from the (g) magenta region and (h) green region marked in (f), respectively. Virtual dark field image formed using integration windows centered on the (i) parent reflections and (j) superlattice reflections as marked in (g) and (h), respectively. (reproduced from ref. 62).](/cms/asset/b7a6814e-5ab0-4422-8879-b25562f7432b/tapx_a_2046157_f0001_oc.jpg)
The well-developed 3DED techniques have been successfully used in the structure determination of various materials including beam-sensitive MOFs [Citation40,Citation42,Citation43,Citation51–54]. For example, the structure of MFU-4 l and bismuth-based MOF Bi (BTB) (BTB = 1,3,5-benzenetrisbenzoate) were reconstructed by ADT technique [Citation52,Citation55]. The refined ZIF-8 structure deduced from the high-resolution ED data acquired by MicroED technique is consistent with the result of the X-ray crystallography [Citation53]. Moreover, the structure of novel nano MOFs, such as PCN-226 and COK-47, were revealed through the acquisition and analysis of high-resolution cRED data [Citation56,Citation57]. When a cooling holder was used to further reduce the beam damage of Co-CAU-36, namely, [Co2(Ni-H4TPPP)]·2DABCO·6H2O (DABCO = 1,4-diazabicycle[2.2.2.]octane) during its cRED data acquisition, not only was its crystal structure determined, but also the existence and location of DABCO and H2O molecules inside its pores were well defined [Citation58].
Recently, cRED was used in combination with single-crystal XRD (SXRD), cryo-HRTEM, etc., to reveal the atomic crystal structures of a series of conductive 2D Π-conjugated MOFs: M3HHTT2 (HHTT = 2,3,7,8,12,13-hexahydroxy tetraazanaphthotetraphene, M = Cu2+, Ni2+) and M6HHTT3 (M = Co2+, Mg2+, Ni2+) [Citation59]. The crystal structure of Cu3HHTT2 was defined through the structural refinement at high resolution (~1.5 Å). The ultra-small interlayer distance (3.19 ± 0.02 Å) determined from the cRED ascertained the strong Π-stacking between the planar 2D sheets, resulting in eclipsed AA stacking. In addition to studying single-metal MOFs, cRED can be used to study bimetallic MOFs [Citation40,Citation60]. For instance, the structures of two [Ti8Zr2O12(COO)16] cluster-based isoreticular MOFs, PCN-415 and PCN-416, resolved by cRED and PXRD, are highly consistent with the atomic position difference of 0.032 Å and 0.071 Å for Zr/Ti and O/C, respectively [Citation60]. In addition to well-crystallized materials, cRED technique can also offer plausible structural information on materials with low crystallinity [Citation40,Citation61]. For example, although the cRED dataset of UU-100 contains both intense diffraction spots and streaks, it also successfully revealed that UU-100 belongs to P4/mbm space group with a tetragonal unit cell [Citation61]. Moreover, the unit cell parameters of UU-100 defined by the cRED technique (a = b = 27.3 Å, and c = 19.6 Å) are close to those refined by PXRD (a = b = 28.05(5) Å, and c = 19.07(3) Å).
Although the 3DED diffraction techniques can resolve overall structural information, they cannot offer local defect distribution with atomic or nanoscale spatial resolution. Fortunately, a newly developed scanning electron diffraction (SED) technique has achieved great success in the identification of nanoscale defects and crystal-phase identification of beam-sensitive materials, such as MOFs. As illustrated in , the SED technique records a 2D diffraction pattern at each position as the focused electron probe is scanning [Citation62]. Since the convergence angle of the probe used in SED is around 1 mrad, the distance between the obtained Bragg disks is large enough to be separated for crystallographic analysis. The spatial resolution of SED technique is around 2–5 nm, which is determined by the electron probe size. As shown in –j, one of the typical applications of SED towards MOFs characterization is that defect nanodomains in UiO-66 (Hf) crystal were successfully identified by forming dark field images using the corresponding reflections in the SED pattern [Citation62].
3. Imaging
In spite of the merits of ED techniques, one of the main drawbacks is that they cannot reveal detailed local information, such as surface structure, which is often key to understanding and modifying material properties [Citation63–65]. Therefore, to achieve detailed structural and compositional information, much effort has been devoted to imaging materials in real space with high spatial resolution. Since, the development of field emission guns and spherical aberration (Cs) correctors, nanoscale even atomic scale structural information of most nanomaterials can be obtained in real space using TEM or scanning transmission electron microscopy (STEM) imaging modes [Citation66,Citation67]. However, despite the successful application of high-resolution TEM (HRTEM) in nanomaterials analysis, interpreting a HRTEM image is challenging as its image contrast results from a complex contrast transfer function (CTF) of the defocus and spherical aberration (Cs) of objective lenses [Citation68,Citation69]. Even with the advent of the Cs corrector, which can minimize Cs to eliminate surface delocalization, Cs-corrected HRTEM images could only be interpreted under specific defocus when the weak-phase object approximation theory is satisfied [Citation70,Citation71].
TEM imaging uses a parallel beam, while STEM uses a converged beam, which is scanned across the specimen. This generates a range of signals, which can be collected by various detectors to generate image and spectroscopic information. The bright field (BF) detector intercepts the directly transmitted electrons and produces bright field diffraction contrast images analogous to those produced in TEM imaging [Citation72]. Annular detectors, permit the transmitted electrons to pass through a central hole and intercept electrons scattered out of the beam at various angles. Electrons incoherently scattered by the atomic nuclei in the specimen through high angles, can by intercepted to form a high angle annular dark field image (HAADF). The contrast in such high HAADF images, is sensitive to both specimen thickness and the atomic number of the material under study [Citation73]. The atomic number dependence is proportional (approximately) to Z1.7 [Citation74,Citation75]. The incoherent nature of the HAADF signal makes HAADF images directly interpretable (unlike HRTEM phase contrast image, which involve coherent scattering). HAADF images produce very high contrast between high and low Z elements. The corollary of this is that light atoms, such as oxygen, produce very little signal in such images and can be difficult to image. The annular bright field-STEM (ABF-STEM) technique can help visualize low and high Z atoms in the same material by collecting directly transmitted electrons from an annular region around the periphery of the transmitted beam-the centre of which is masked [Citation76]. More recently, integrated differential phase-contrast scanning transmission electron microscopy (iDPC-STEM) technique was developed, which is useful in characterizing sensitive materials, especially those containing light elements. The technique allows both low and high Z elements to be visualized and the contrast of iDPC-STEM images is easy to interpret as it is an averaged electronic potential proportional to atomic number. The signal-to-noise ratio, even under ultra-low dose mode, is relatively high as it excludes non-integrable vector field [Citation77–81].
In addition to crystal structure and imaging, chemical composition, electronic structure and bonding information are also accessible through STEM-based methods. In the last several decades, many powerful spectroscopic techniques have been developed including energy-dispersive X-ray analysis (EDX) for chemical analysis and electron energy loss spectroscopy (EELS)-based spectroscopy and imaging/mapping (energy filtered TEM (EFTEM)), which can provide both compositional and bonding information [Citation68,Citation69,Citation77–89].
3.1. MOFs
Since MOFs are generally too sensitive to be imaged under normal TEM/STEM imaging mode, various strategies have been adopted to reduce beam-induced heating and knock-on damage [Citation84,Citation86-92]. For example, MOF-5 was successfully imaged using a TEM equipped with a cooling holder and operating at 80 kV [Citation92]. Under these conditions, a clear cubic lattice could be seen in the filtered HRTEM images () and which matches the simulated result very well. Ni-CAT-1 was imaged using both 120 kV TEM and 60 kV Cs-corrected STEM, which resolved its honeycomb structure and terminal defects () [Citation84]. Although these strategies can to some degree reduce beam damage, further studies found radiolysis is the main source of beam damage in MOFs. Radiolysis can be reduced by increasing accelerating voltage [Citation93]. Nevertheless, without controlling the electron dose, acquiring high-resolution especially atomic resolution TEM/STEM images under high accelerating voltage is still challenging. Zn-MOF-74 was imaged using a Cs-corrected microscope at 300 kV with a low electron dose of 0.20 e−A−2s−1 [Citation94]. Under this condition (), the triangular structure of Zn clusters was observed. However, the signal-to-noise ratio of the images captured in low-dose mode is too low to resolve the Zn atomic columns and organic linkers. More recently, polyUiO-66 with various polymer blocks were characterized with a low electron dose in both 300 kV TEM mode and 200 kV Cs-corrected STEM mode [Citation95]. The acquired TEM/STEM images and EDS elemental maps show that, regardless of polymer categories, the polyUiO-66 is made up of alternate metal-rich and metal-poor parts.
Figure 2. (a) Filtered HRTEM image (the inset image simulation is noise-free) and (b) simulated HRTEM image of intact MOF-5 crystal (reproduced from ref. 92). (c) HRTEM image of Ni-CAT-1 taken at 120 kV with terminal structure indicated by arrows (reproduced from ref. 84). (d) Fourier-filtered Cs-corrected and (e) simulated HAADF-STEM image of Zn-MOF-74, respectively. The inset of (d) is a magnified image of a pore (reproduced from ref. 94). (f) From left to right are CTF-corrected and Wiener filtered image of ZIF-8, symmetry-imposed and lattice-averaged image with a structural model of ZIF-8 superimposed, and simulated projected potential map with a point spread function width of 2.1 Å, where dark contrast refers to high potential values. Blue rectangles highlight representative regions where individual atomic columns of Zn and imidazole rings can be identified. (g) Experimental and (h) simulated HRTEM images of ZIF-8 along the [111] zone axis (scale bar is 2 nm). (i) Optimized structural model of the ZIF-8 (110) surface by density-functional-based tight-binding methods. (reproduced from ref.82).
![Figure 2. (a) Filtered HRTEM image (the inset image simulation is noise-free) and (b) simulated HRTEM image of intact MOF-5 crystal (reproduced from ref. 92). (c) HRTEM image of Ni-CAT-1 taken at 120 kV with terminal structure indicated by arrows (reproduced from ref. 84). (d) Fourier-filtered Cs-corrected and (e) simulated HAADF-STEM image of Zn-MOF-74, respectively. The inset of (d) is a magnified image of a pore (reproduced from ref. 94). (f) From left to right are CTF-corrected and Wiener filtered image of ZIF-8, symmetry-imposed and lattice-averaged image with a structural model of ZIF-8 superimposed, and simulated projected potential map with a point spread function width of 2.1 Å, where dark contrast refers to high potential values. Blue rectangles highlight representative regions where individual atomic columns of Zn and imidazole rings can be identified. (g) Experimental and (h) simulated HRTEM images of ZIF-8 along the [111] zone axis (scale bar is 2 nm). (i) Optimized structural model of the ZIF-8 (110) surface by density-functional-based tight-binding methods. (reproduced from ref.82).](/cms/asset/a1e1bd90-47db-415d-ad53-c6bdb017d8ce/tapx_a_2046157_f0002_oc.jpg)
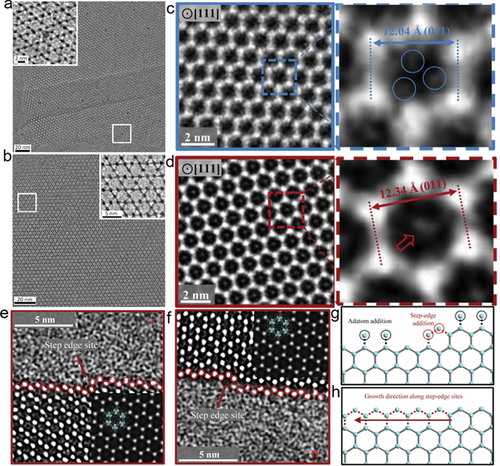
It should be noted when imaging MOFs at the same electron dose in TEM and STEM modes separately, the local electron flux in STEM (highly focused beam) is higher than that of TEM (broad beam) and can cause destructive damage. Therefore, despite the many benefits of STEM, the majority of effort has been devoted to characterizing MOFs in TEM mode. The development of direct-detection electron-counting (DDEC) cameras has greatly enhanced low-dose imaging in TEM, as these can produce usable images formed with just a few electrons per pixel. Many MOFs have been studied using DDEC-equipped TEMs in TEM mode [Citation68,Citation69,Citation82,Citation86,Citation96,Citation97]. For example, a HRTEM image of intact ZIF-8 has been obtained (–i) using an ultralow electron dose (4.1 e−Å−2 in total) [Citation82]. These HRTEM images resolved its local structure and provided hints of its self-assemble mechanism and surface termination modes. However, the zone-axis images were obtained through a time-consuming trial and error process.
The life time of MOFs under beam irradiation is short and on-axis HRTEM images are required to reconstruct a MOF structure, so it is important to reduce the time needed to acquire on-axis HRTEM images [Citation68]. The time needed to acquire an interpretable HRTEM image is the sum of the time needed for locating a specific crystal zone axis, aligning short-exposure images, and determining the defocus value [Citation68]. Hence, to reduce the total beam exposure time, new approaches have been developed: (1) To tilt the sample to the nearest zone axis directly, software has been developed to calculate the required goniometer tilting angles from the Laue circle of an electron diffraction pattern taken at the current (off-axis) orientation. (2) To achieve reliable alignment of successive short-exposure noisy images, a ‘Amplitude filter’ was developed to process such images. (3) To calculate the precise defocus value of an intact HRTEM image, the specimen was deliberately destroyed after the capture to obtain a series of images with various defocus value. The high efficiency and universality of these methods has been confirmed by their successful application in acquiring atomic-resolution TEM images of several beam-sensitive MOFs (UiO-66, ZIF-8, HKUST-1), a zeolite, and a perovskite (CH3NH3PbBr3) (–g) [Citation68]. Following this work, low-dose HRTEM was also used to study the ‘missing linker’ and ‘missing cluster’ in UiO-66 (Zr) (–o), and the effect of various additives on the surface structure and thermal stability of MIL-101 (Cr) (–r) [Citation69,Citation96]. Moreover, DDEC-equipped low dose Cs-corrected HRTEM successfully revealed the atomic/molecular configurations of MIL-101 {111} sublayer surfaces and inorganic Cr3(m3-O) trimer-regulated surface transition [Citation65].
Figure 3. (a) Drift-corrected HRTEM image of a truncated octahedral UiO-66 crystal and an ultrathin piece of crystal with the same <011> orientation. (b) CTF-corrected denoised image of area 2 in (a) and the structural model of UiO-66. (c) A truncation surface of area 1 in (a), showing crystal growth steps involving small {100} facets (blue) and {111} facets (yellow). The white arrows indicate ‘kink’ positions between {100} and {111} facets. (d) Ligand-terminated {111} surface: (left) structural model; (middle) processed HRTEM image by real-space averaging of 5 motifs from area 3 in (a); (right) the averaged image displayed in rainbow colors to increase the visibility of the ligand contrast. (e) Ligand-free (metal-terminated) {100}/{111} kink: (left) structural model; (middle) processed HRTEM image by real-space averaging of seven motifs from area 1 in (a); (right) the averaged image displayed in rainbow colors. (f and g) The structure model (left) and the processed HRTEM image (right) of the (f) hydroxylated and (g) dehydroxylated Zr clusters featuring different Zr-Zr distances. (reproduced from ref. 68). CTF-corrected HRTEM images (scale bar 2 nm) and structural models along the [001] zone axes of (h) perfect UiO-66 (Fm-3 m) and (i) the missing linker defect (I4/mmm). In each panel: (ii) p1-averaged image (top), symmetry-imposed image (middle) and simulated projected potential (bottom); (iii) the projected structural model. Projected structural model, the simulated projected potential map, and the real-space averaged experimental image of (j,k,l) reo structure and (m,n,o) scu structure missing-cluster defects along the [001] zone axis of UiO-66-D. (reproduced from ref. 69). CTF-corrected HRTEM images (scale bar 5 nm) of freshly synthesized (p) MIL-101-HF, (q) MIL-101-NA, and (r) MIL-101-Ac. At the bottom of each image are the corresponding (i) real-space averaged image, (ii) simulated projected potential map, and (iii) the projected structural model. (reproduced from ref. 96).
![Figure 3. (a) Drift-corrected HRTEM image of a truncated octahedral UiO-66 crystal and an ultrathin piece of crystal with the same <011> orientation. (b) CTF-corrected denoised image of area 2 in (a) and the structural model of UiO-66. (c) A truncation surface of area 1 in (a), showing crystal growth steps involving small {100} facets (blue) and {111} facets (yellow). The white arrows indicate ‘kink’ positions between {100} and {111} facets. (d) Ligand-terminated {111} surface: (left) structural model; (middle) processed HRTEM image by real-space averaging of 5 motifs from area 3 in (a); (right) the averaged image displayed in rainbow colors to increase the visibility of the ligand contrast. (e) Ligand-free (metal-terminated) {100}/{111} kink: (left) structural model; (middle) processed HRTEM image by real-space averaging of seven motifs from area 1 in (a); (right) the averaged image displayed in rainbow colors. (f and g) The structure model (left) and the processed HRTEM image (right) of the (f) hydroxylated and (g) dehydroxylated Zr clusters featuring different Zr-Zr distances. (reproduced from ref. 68). CTF-corrected HRTEM images (scale bar 2 nm) and structural models along the [001] zone axes of (h) perfect UiO-66 (Fm-3 m) and (i) the missing linker defect (I4/mmm). In each panel: (ii) p1-averaged image (top), symmetry-imposed image (middle) and simulated projected potential (bottom); (iii) the projected structural model. Projected structural model, the simulated projected potential map, and the real-space averaged experimental image of (j,k,l) reo structure and (m,n,o) scu structure missing-cluster defects along the [001] zone axis of UiO-66-D. (reproduced from ref. 69). CTF-corrected HRTEM images (scale bar 5 nm) of freshly synthesized (p) MIL-101-HF, (q) MIL-101-NA, and (r) MIL-101-Ac. At the bottom of each image are the corresponding (i) real-space averaged image, (ii) simulated projected potential map, and (iii) the projected structural model. (reproduced from ref. 96).](/cms/asset/08b2a486-73c0-439b-abcd-6a44e9689937/tapx_a_2046157_f0003_oc.jpg)
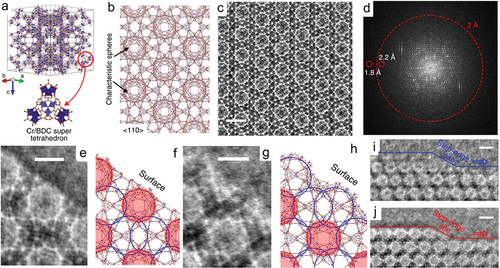
Recently, iDPC-STEM has been widely applied to the characterization of various materials, especially those containing light elements. In the early stages of the technique’s development, iDPC-STEM characterization of MOFs resulted in high image contrast but the resolution was lower than that of corresponding low dose HRTEM images [Citation96]. The image resolution of iDPC-STEM was improved recently through tuning of imaging conditions [Citation77,Citation80,Citation98]. For instance, the Cr/BDC super tetrahedrons details of MIL-101 have been clearly resolved (–c) and match the structural model of MIL-101 from the <110> projection perfectly [Citation80]. The information limit of its corresponding FFT pattern () is ~1.8 Å, which is smaller than that of the ADF-STEM (16 Å) and HRTEM (2.5 Å) images acquired by a DDEC camera, respectively. Moreover, two types of surface termination and step-edge sites were disclosed by the iDPC-STEM images (–j). iDPC-STEM was also used in combination with HAADF-STEM to study the dynamic reaction of MIL-101-Cr towards constant beam irradiation, which results in dynamic pore change and visible crystal bending [Citation98]. The iDPC-STEM and HAADF-STEM results show both the lattice plane and the specific position of the crystal affect its dynamic local variation towards beam irradiation.
Figure 4. (a) The framework model of MIL-101. (b) The structural model of MIL-101 viewed from the <110> projection. (c) high resolution iDPC-STEM image (scale bar, 5 nm.) of MIL-101 < 110> projection and its corresponding (d) FFT pattern in a log scale with an information limit of 1.8 Å. (e, g) iDPC-STEM images (scale bar, 3 nm.) and corresponding (f, h) structure models of single-unit cells at two types of {111} surface terminations. (i, j) The images (scale bar, 5 nm) of the MIL-101 crystals showing the surface steps and step-edge sites with two types of surface terminations, respectively. (reproduced from ref. 80).
3.2. Guest@MOFs
As a class of porous materials, MOFs have attracted much attention as host materials in the preparation of gas- or nanoparticle-loaded MOFs composites (termed guest@MOFs). Combining the functionality of the guest and MOFs along with synergistic effects, guest@MOFs composites have already demonstrated their potential applications in multiple areas, such as catalysis, sensors, and medicine [Citation13]. To achieve controllable synthesis of specific guest@MOFs with desired functionalities, TEM and its associated spectroscopic techniques have been used to study the guest components of guest@MOFs [Citation99–111]. For instance, various TEM techniques have been used to accomplish the systematic study of Ru@MOF-5 and Pd@MOF-5, both of which were prepared by chemical vapor infiltration and precursor decomposition [Citation103–111]. TEM and HAADF-STEM images, ED patterns, and 3D reconstruction results show 1–3 nm crystallized Pd particles distributed uniformly throughout intact MOF-5 crystals of Pd@MOF-5. Meanwhile, for Ru@MOF-5, the TEM characterization results show Ru crystals dispersed on, or close to the surface of some MOF-5 crystals while the others were totally free of Ru. Moreover, the crystallinity of MOF-5 in Ru@MOF-5 was destroyed. It should be noted that spectroscopic imaging techniques can accomplish the characterization of ultra-small guest components or those possess relatively low image contrast, which can hardly be analyzed by the above mentioned ED or TEM/STEM imaging techniques. For example, Ti K EFTEM images confirmed the existence of a layer of TiO2 particles coating outside the Au/TiO2@MOF-5 composite [Citation112]. The dispersion of low contrast GaN nanoparticles inside of ZIF-8 was studied by STEM-EDS and STEM-EELS mapping [Citation106].
In addition to its distribution, morphology, and composition, much effort has been devoted to revealing the accurate position of the guest component. For example, locate the position of ALD-deposited Pt nanoparticles relative to MIL-101 (Cr), corresponding ADF-STEM images and tomography data were acquired using an aberration corrector-equipped TEM in low-dose mode [Citation102]. The results showed that Pt nanoparticles are embedded inside the pores of crystalized MIL-101 (Cr) and that the size of Pt particles is limited by the size of the pores. The high-resolution ADF-STEM images show that some Pt particles are well crystalized while the others are partially crystallized. Moreover, as shown in , low-dose HRTEM produced direct visualization of single-molecule magnets [Mn12O12(O2CCH3)16(OH2)4] (Mn12Ac) inside the hexagonal pores of Zr6(μ3-OH)8(OH)8(tbapy)2] (denoted as NU-1000) [Citation113].
Figure 5. HRTEM images of (a) Mn12Ac@NU-1000 and (b) pristine NU-100 (reproduced from ref. 113). CTF-corrected denoised images of (c) a ZIF-8 particle and (d) a CO2-filled ZIF-8 particle. (e, f) Cryo-EM images of two edges of a ZIF-8 particle (inset: simulated TEM images with overlaid atomic structures). (g) Schematic of possible surface additions of Zn clusters during ZIF-8 growth. (h) Schematic of ZIF-8 growth initiated at the step-edge site. (reproduced from ref. 114).
Although guest components of various guest@MOFs have been successfully characterized using conventional TEM, it is almost impossible to characterize volatile guest molecules at room temperature. Fortunately, the advent of cryo-EM successfully addressed as it cools the specimen to liquid nitrogen temperatures during characterization and avoids evaporation of guest molecules. Using a cryo-EM equipped with direct electron detection camera enabled the compositional and structural analysis of CO2-encapsulated ZIF-8 [Citation114]. The CTF-corrected cryo-EM images in indicate that CO2 molecules were constrained inside the 6-ring pores of ZIF-8. Furthermore, step-edge defects were found in pristine ZIF-8 (–g), which are believed to be more favorable for ZIF-8 growth in comparison with surface sites.
4. In-situ TEM characterization
It is well known that the growth and chemical conversion of most MOFs are sensitive to external stimuli, such as solvents, temperatures, metal sources, additives, etc., which will result in structural and/or compositional variation [Citation115,Citation116]. Although many excellent ex-situ studies have been done to reveal the effects of such stimuli, there is a lack of real-time studies showing how local morphological and compositional properties change during MOFs synthesis and conversion processes [Citation34,Citation117,Citation118]. As a result, most new MOF families are developed through a process of trial-and-error. To realize designable and tunable MOFs synthesis and conversion, understanding the nucleation, crystallization, growth, and conversion mechanism of MOFs is vital important as it can provide guidelines for synthesizing desirable MOFs and their derivatives [Citation119].
Consequently, many advanced in-situ and time-resolved techniques have been developed and applied to the analysis of MOFs and their derivatives [Citation19,Citation64,Citation120–127]. For example, in order to reveal the molecular assembly mechanism of ZIF-8 during its nucleation and growth, the growth process was studied by in-situ atomic force microscopy (AFM) [Citation64]. However, AFM is only surface sensitive and its lateral and temporal resolution is low. The nucleation and growth process of ZIF-8 was also monitored by in-situ small angle and wide-angle X-ray scattering [Citation19]. During the in-situ X-ray powder diffraction studies, O’Hare et al. found that the kinetics and intermediates of M2(bdc)2dabco (M = Zn, Co, Ni; bdc = 1,4-benzenedicarboxylate; dabco = diazabicyclo-[2.2.2]octane) depend on the metal ion categories. Since the crystallization of M2(bdc)2dabco does not follow standard models, a simple and new kinetic model was developed to offer chemical insights on phase selection. Furthermore, taking advantage of in-situ synchrotron X-ray diffraction, Friščić and co-workers studied the mechanochemical transformation during the ball milling preparation of ZIF-8 [Citation124]. While these in-situ techniques have been used to study the overall dynamic properties of MOFs, the local variation process of a single MOF crystal is rarely studied. In view of this, ETEM, CryoTEM, and various in-situ TEM methodologies have been applied to pursue direct observation of dynamic variation of MOFs during their synthesis, conversion, and application [Citation35,Citation128–132].
4.1. MOFs growth
Since previous ex-situ work proposed that the growth process of ZIF-8 includes gel formation, nucleation, crystallization, and growth, ZIF-8 was chosen to conduct in-situ liquid cell transmission electron microscopy (LCTEM) studies of MOFs growth [Citation117,Citation133]. To guarantee the success of this experiment, firstly, LCTEM imaging conditions of MOFs was determined by conducting LCTEM analysis of pre-synthesized robust UiO-66 (Zr) under different conditions [Citation133]. Then, LCTEM was used to observe the effect of synthesis conditions on the nucleation and growth of ZIF-8 particles. The results confirm that the nucleation of ZIF-8 follows the surface-limited growth process and can be tuned by the depletion rate of local monomers, which is comparable to that of previous ex-situ studies.
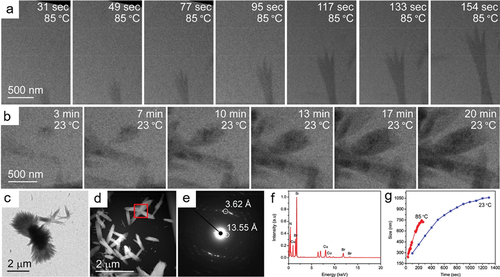
To visualize the temperature effect on MOFs growth, in-situ variable temperature LCTEM (VT-LCTEM) were developed and used in MOFs studies [Citation134,Citation135]. As shown in , the growth of (L1)Cu2Br2 (L1 = 1,4-bis((4 H-1,2,4-triazol-4-yl)methyl)naphthalene, a typical metal-organic nanotubes (MONT), was studied and observed by in-situ VT-LCTEM at 23°C and 85°C, respectively [Citation134]. The SAED pattern () and EDS spectrum () of the product acquired after the in-situ experiment verify it possesses the same structure and composition as that of the one obtained in bulk experiment. To avoid beam damage and its impact on the growth process, the growth of MONT was studied under the low electron-dose mode. Consequently, the imaging contrast and resolution is too low to observe the initial nucleation of (L1)Cu2Br2. However, the results imply the average growth rate of (L1)Cu2Br2 at 85°C is more than three times faster than at 23°C, indicating the (L1)Cu2Br2 growth process is a thermodynamic driven process (). Later on, combining in-situ LCTEM and bulk reaction, the same group concluded that the nucleation and growth process of Ag-based MONT depends on the ratio of metal ion and ligand [Citation136]. Another successful application of in-situ electron microscopy towards the synthetic mechanism study of MOFs is that single-molecular atomic-resolution real-time electron microscopic video imaging results revealed MOF-2 and MOF-5 possess different synthetic mechanism as cube and cube-like prenucleation clusters (PNCs) and linear and square PNCs were found in the MOF-5 and MOF-2 synthesis, respectively [Citation137].
Figure 6. (a, b) Snapshots of growth of MONT acquired by LCTEM. (c, d) Fully grown MONT in LCTEM environment acquired during post-mortem analysis. (e) SAED of MONT grown in LCTEM. (f) EDS spectrum of MONT grown in LCTEM. (g) Size of MONT plotted as a function of time. (reproduced from ref. 134).
4.2. MOFs conversion
Considering most MOFs are very sensitive to various environmental stimuli, many attempts have been tried to observe their dynamic reaction to different stimuli and the corresponding mechanism [Citation135,Citation138]. For instance, the dynamic structural reaction of MIL-53 (Cr) towards water at different temperature was studied by ETEM and molecular dynamics simulation [Citation138]. The in-situ ETEM diffraction patterns disclosed the dynamic and reversible pore breathing of MIL-53 (Cr), which was induced by the adsorption and desorption of water molecules during the heating-cooling cycle in ~3 mbar v-H2O vapor atmosphere. In combination with the molecular dynamic simulation, it was confirmed that this breathing phenomenon was initialized by the first adsorption of one water molecular per unit cell, which was emptied in UH-vacuum at room temperature, at 300°C in ~3 mbar v-H2O vapor atmosphere. In addition to ETEM, VT-LCTEM was used to monitor heating stimulated irreversible phase transition of Zr6-based MOFs (Zr-MOFs), which is constructed from Zr6 clusters and tetratopic organic linkers with diverse topologies and structures [Citation135]. The in-situ VT-LCTEM experiment not only observed the dissolution-reprecipitation phase transformation of Zr-MOF from NU-906 to NU-1008, but also identified that the speed of this process depends on the concentration of the specific modulator, namely formic acid.
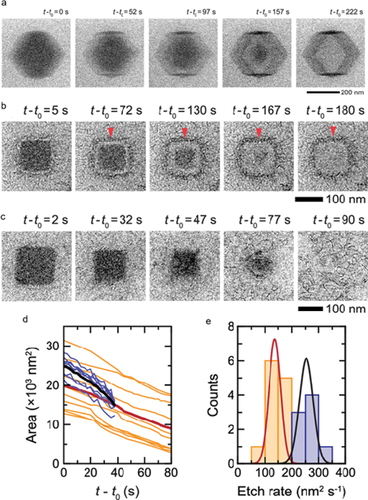
In addition to studying phase transitions, LCTEM also can be used to study the dynamic generation process of MOFs derivatives in the liquid phase. For example, in-situ LCTEM was used to study the conversion process of cubic and rhombic dodecahedron (RD) ZIF-8 to hollow LDH nanocages at nanoscale () [Citation139]. This work also demonstrates the conversion efficiency is controlled by difference in the MOF etching rate versus the LDH formation rate. These are affected by the concentration of the metal precursors, solvent, and the morphology of the MOF. As –e show, when the etching rate of ZIF-8 was increased due to the presence of high concentrations of Co(NO3)2, hollow LDH nanocages cannot be obtained.
Figure 7. (a) Time series of in-situ liquid-phase TEM images showing the room-temperature conversion of a ZIF-8 rhombic dodecahedron nanoparticle in a 5 mg ml−1 Co(NO3)2 solution with ethanol-water solvent (VEtOH/VH2O = 0.5). Time series of in situ liquid-phase TEM images showing the room-temperature conversion/etching of a ZIF-8 nanocube into an LDH nanocage in (b) a 5 mg mL−1 Co(NO3)2 solution and (c) a 10 mg mL−1 Co(NO3)2 solution with ethanol-water solvent (VEtOH/VH2O = 0.5), respectively. (d) Projected area of ZIF-8 nanocube cores as a function of time at 5 mg mL−1 (Orange) and 10 mg mL−1 (blue) Co(NO3)2 concentrations. (e) Distribution of the etch rates at which the projected area of the cores decreases for a total of 20 ZIF-8 nanocubes in 5 mg mL−1 (Orange) and 10 mg mL−1 (blue) Co(NO3)2 solutions. (reproduced from ref.139).
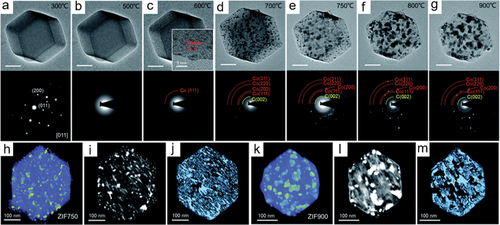
In view of the fact that a large majority of functional MOFs derivatives are prepared through calcination, TEM heating holders have been used to ascertain the dynamic carbonization process of MOFs [Citation140–142]. The first attempt in this area is the in-situ hot-stage TEM study of Ni-MOF, which show an identical carbonization process to that observed in ex-situ experiments [Citation140]. Real-time morphological and compositional variation of the Ni-MOF at different heating stages were analyzed by HRTEM and EDT techniques. Ni particles was found at 300°C and their crystallization was enhanced as higher temperatures. Once the temperature reached 700°C, Ni nanoparticles aggregated into large ones and were ejected from the graphitic carbon framework. Owing to its large surface area and magnetic property, the derivative obtained at 600°C were used as a high efficiency and recyclable electrocatalyst towards 4-nitrophenol reduction. In-situ annealing of ZIF-67 was studied in a TEM to understand the effect of the pyrolysis temperature on the structure and the electrocatalytic properties of the resulting ZIF-67 derivatives [Citation143]. As shows, the ZIF-67 is stable below 300°C and a disordered structure can be seen at 500 oC. At higher temperature, the cobalt particles growth and carbon graphitization were observed (–g). Moreover, the homogeneous cobalt particle dispersion and the porous structure of ZIF 750 and ZIF 900 were further studied by in-situ 3D electron tomography (–m).
Figure 8. (a–g) TEM images and corresponding SAED patterns of ZIF-67 during in situ annealing acquired at various temperatures. All scale bars are 100 nm unless indicated (c-inset). 3D tomographic reconstruction, corresponding orthoslices, and porous structure of (h-j) ZIF750 and (k-m) ZIF900, respectively. (reproduced from ref. 143).
The two examples mentioned above were conducted in vacuum as the samples were fully exposed in the TEM column. Considering calcination atmosphere is an important factor that affects MOF properties, gas cell holders have been developed to achieve the goal of analyzing materials in the TEM whilst being exposed to real gaseous atmospheres [Citation142,Citation144]. Such a gas cell holder was used to monitor dynamic morphological and crystallization changes of NH2-MIL-125 (Ti) during its annealing under argon in Cs-corrected STEM mode [Citation142] enabled to be observed. Combining this data with the characterization results from other techniques showed that an amorphous intermediate without accessible porosity is generated during the carbonization phase prior to the formation of porous N- and/or C-doped TiO2 nanoparticles.
5. Conclusion
Stimulated by the importance of revealing bulk/local structure and composition information of beam-sensitive MOFs, which are promising candidates for efficient energy storage and conversion devices, this review summarized the application and achievement of various TEM techniques in MOFs characterization (). In the last several decades, the advent of aberration correctors, DDEC cameras, annular detectors, segmental detectors, low-dose techniques etc. have successfully disclosed the structure and composition of some beam sensitive MOFs at high resolution. Furthermore, ETEM and in-situ TEM methodologies realized monitoring dynamic reaction of some MOFs towards various stimuli, which can offer guidelines for designing materials with designed functionalities. However, as electron tolerance of MOFs varies, now only a few categories of relatively stable MOFs can achieve atomic (S)TEM characterization before damage occurs. Moreover, the resolution of in-situ LCTEM experiment is also limited by the thickness of the membrane used. The future TEM studies of MOFs will focus on developing new technologies and combing existing technologies to achieve accurate ex-situ and in-situ atomic characterization. The prevailing electron microscope pixel array detector and hybrid-pixel camera might fight a way for atomic characterization of various beam-sensitive materials including MOFs. For example, the recently developed electron ptychography, which is a typical type of four-dimensional scanning transmission electron microscopy (4D-STEM), have already achieved high-resolution structural and compositional information of beam-sensitive transition-metal dichalocogenides.
Table 1. Summarized the structural properties and experimental parameters of various MOF materials presented in this paper
Acknowledgments
This project is supported by the National Natural Science Foundation of China (No. 11874394), The University Synergy Innovation Program of Anhui Province (No. GXXT-2020-003). The authors thank David R. G. Mitchell for the valuable comments.
Disclosure statement
No potential conflict of interest was reported by the author(s).
Additional information
Funding
References
- Gür TM. Review of electrical energy storage technologies, materials and systems: challenges and prospects for large-scale grid storage. Energy Environ Sci. 2018;11:2696.
- Gray HB. Powering the planet with solar fuel. Nat Chem. 2009;1:7.
- Lewis NS, Nocera DG. Powering the planet: chemical challenges in solar energy utilization. Proc Natl Acad Sci U S A. 2006;103:15729.
- Jiao Y, Zheng Y, Jaroniec M, et al. Design of electrocatalysts for oxygen-and hydrogen-involving energy conversion reactions. Chem Soc Rev. 2015;44:2060.
- Cheng N, Ren L, Xu X, et al. Recent development of zeolitic imidazolate frameworks (ZIFs) derived porous carbon based materials as electrocatalysts. Adv Energy Mater. 2018;8:1801257.
- Li Y, Chen W, Xing G, et al. New synthetic strategies toward covalent organic frameworks. Chem Soc Rev. 2020;49:2852.
- Li B, Wen H, Cui Y, et al. Emerging multifunctional metal-organic framework materials. Adv Mater. 2016;28:8819.
- Cheng N, Ren L, Xu X, et al. Application of organic-inorganic hybrids in lithium batteries. Mater Today Phys. 2020;15:100289.
- Furukawa H, Cordova KE, O’Keeffe M, et al. The chemistry and applications of metal-organic frameworks. Science. 2013;341:1230444.
- Wu HB, Lou XW. Metal-organic frameworks and their derived materials for electrochemical energy storage and conversion: promises and challenges. Sci Adv. 2017;3: eaap9252.
- Long JR, Yaghi OM. The pervasive chemistry of metal-organic frameworks. Chem Soc Rev. 2009;38:1213.
- Cao X, Tan C, Sindoro M, et al. Hybrid micro-/nano-structures derived from metal-organic frameworks: preparation and applications in energy storage and conversion. Chem Soc Rev. 2017;46:2660.
- Dhakshinamoorthy A, García H. Catalysis by metal nanoparticles embedded on metal-organic frameworks. Chem Soc Rev. 2012;41:5262.
- Ju W, Bagger A, Hao G, et al. Understanding activity and selectivity of metal-nitrogen-doped carbon catalysts for electrochemical reduction of CO2. Nat Commun. 2017;8:944.
- Li S, Xu Q. Metal-organic frameworks as platforms for clean energy. Energy Environ Sci. 2013;6:1656.
- Zhao Y, Song Z, Li X, et al. Metal organic frameworks for energy storage and conversion. Energy Stor Mater. 2016;2:35.
- Ameloot R, Vermoortele F, Hofkens J, et al. Three-dimensional visualization of defects formed during the synthesis of metal-organic frameworks: a fluorescence microscopy study. Angew Chem. 2013;125:419.
- Schöăeè M, Agger JR, Anderson MW, et al. Crystal form, defects and growth of the metal organic framework HKUST-1 revealed by atomic force microscopy. CrystEngComm. 2008;10:646.
- Cravillon J, Schröder CA, Nayuk R, et al. Fast nucleation and growth of ZIF-8 nanocrystals monitored by time-resolved in situ small-angle and wide-angel X-ray scattering. Angew Chem Int Ed. 2011;50:8067.
- Liu J, Zhu D, Guo C, et al. Design strategies toward advanced MOF-derived electrocatalysts for energy-conversion reactions. Adv Energy Mater. 2017;7:1700518.
- Chen Q, Dwyer C, Sheng G, et al. Imaging beam-sensitive materials by electron microscopy. Adv Mater. 2020;32:1907619.
- Egerton RF, Li P, Malac M. Radiation damage in the TEM and SEM. Micron. 2004;35:399.
- Ugurlu O, Haus J, Gunawan AA, et al. Radiolysis to knock-on damage transition in zeolites under electron beam irradiation. Phys Rev B. 2011;83:1127.
- Mkhoyan KA, Babinec T, Maccagnano SE, et al. Separation of bulk and surface-losses in low-loss EELS measurements in STEM. Ultramicroscopy. 2007;107:345.
- Jiang N. Electron beam damage in oxides: a review. Rep Prog Phys. 2016;79:016501.
- Egerton RF. Radiation damage to organic and inorganic specimens in the TEM. Micron. 2019;119:72.
- Flynn CP. Point Defects and Diffusion. London: Oxford University Press; 1972.
- Hobbs LW. Transmission electron microscopy of extended defects in alkali halide crystals. London: The Royal Society of Chemistry; 1975.
- Kabler MN, Williams RT. Vacancy-interstitial pair production via electron-hole recombination in halide crystals. Phys Rev B. 1978;18:1948.
- Liu Z, Ohsuna T, Terasaki O, et al. The first zeolite with three-dimensional intersecting straight-channel system of 12-membered rings. J Am Chem Soc. 2001;123:5370.
- Sakamoto Y, Kaneda M, Terasaki O, et al. Direct imaging of the pores and cages of three dimensional mesoporous materials. Nature. 2000;408:449.
- Cichocka MO, Ångström J, Wang B, et al. High-throughput continuous rotation electron diffraction data acquisition via software automation. J Appl Cryst. 2018;51:1652.
- Wiktor C, Meledina M, Turner S, et al. Transmission electron microscopy on metal-organic frameworks - a review. J Mater Chem A. 2017;5:14969.
- Liu L, Zhang D, Zhu Y, et al. Bulk and local structures of metal-organic frameworks unraveled by high-resolution electron microscopy. Commun Chem. 2020;3:99.
- Gong X, Gnanasekaran K, Chen Z, et al. Insights into the structure and dynamics of metal-organic frameworks via transmission electron microscopy. J Am Chem Soc. 2020;142:17224.
- Phan A, Doonan CJ, Uribe-Romo FJ, et al. Synthesis, structure, and carbon dioxide capture properties of zeolite imidazolate frameworks. Acc Chem Res. 2010;43:58.
- Salunkhe RR, Kaneti YV, Kim J, et al. Nanoarchitectures for metal-organic framework-derived nanoporous carbons toward supercapacitor applications. Acc Chem Res. 2016;49:2796.
- Eddaoudi M, Sava DF, Eubank JF, et al. Zeolite-like metal-organic frameworks (ZMOFs): design, synthesis, and properties. Chem Soc Rev. 2015;44:228.
- Lee KJ, Lee JH, Jeoung S, et al. Transformation of metal-organic frameworks/coordination polymers into functional nanostructured materials: experimental approaches based on mechanistic insights. Acc Chem Res. 2017;50:2684.
- Huang Z, Willhammar T, Zou X. Three-dimensional electron diffraction for porous crystalline materials: structural determination and beyond. Chem Sci. 2021;12:1206.
- Zhu L, Zhang D, Xue N, et al. Direct observations of the MOF (UiO-66) structure by transmission electron microscopy. CrystEngComm. 2013;15:9356.
- Kolb U, Gorelik T, Kübel C, et al. Towards automated diffraction tomography: part I-Data acquisition. Ultramicroscopy. 2007;107:507.
- Mugnaioli E, Kolb GU. Ab initio” structure solution from electron diffraction data obtained by a combination of automated diffraction tomography and precession technique. Ultramicroscopy. 2009;109:758.
- Huang Z, Ge M, Carraro F, et al. Can 3D electron diffraction provide accurate atomic structures of metal-organic frameworks? Faraday Discuss. 2021;225:118.
- Wan W, Sun J, Su J, et al. Three-dimensional rotation electron diffraction: software RED for automated data collection and data processing. J Appl Cryst. 2013;46:1863.
- Gemmi M, Mugnaioli E, Gorelik TE, et al. 3D electron diffraction: the nanocrystallography revolution. ACS Cent Sci. 2019;5:1315.
- Nannenga BL, Shi D, Leslie AGW, et al. High-resolution structure determination by continuous-rotation data collection in MicroED. Nat Methods. 2014;11:927.
- Nederlof I, van Genderen E, Li Y, et al. A Medipix quantum area detector allows rotation electron diffraction data collection from submicrometre three-dimensional protein crystals. Acta Cryst Sect D: Biol Cryst. 2013;69:1223.
- Gemmi M, La Placa MGI, Galanis AS, et al. Fast electron diffraction tomography. J Appl Cryst. 2015;48:718.
- Wang B, Zou X, Smeets S. Automated serial rotation electron diffraction combined with cluster analysis: an efficient multi-crystal workflow for structure determination. IUCrJ. 2019;6:854.
- Kolb U, Gorelik T, Otten MT. Towards automated diffraction tomography. Part II–Cell parameter determination. Ultramicroscopy. 2008;108:763.
- Feyand M, Mugnaioli E, Vermoortele F, et al. Automated diffraction tomography for the structure elucidation of twinned, sub-micrometer crystals of a highly porous catalytically active bismuth metal-organic framework. Angew Chem. 2012;124:10519.
- Banihashemi F, Bu G, Thaker A, et al. Beam sensitive metal-organic framework structure determination by microcrystal electron diffraction. Ultramicroscopy. 2020;216:113048.
- Feng D, Wang K, Su J, et al. A highly stable zeotype mesoporous zirconium metal-organic framework with ultralarge pores. Angew Chem Int Ed. 2015;54:149.
- Denysenko D, Grzywa M, Tonigold M, et al. Elucidating gating effects for hydrogen sorption in MFU-4-type triazolate-based metal-organic frameworks featuring different pore sizes. Chem -Eur J. 2011;17:1837.
- Smolders S, Willhammar T, Krajnc A, et al. A titanium(IV)-based metal-organic framework featuring defect-rich Ti-O sheets as an oxidative desulfurization catalyst. Angew Chem. 2019;131:9258.
- Cichocka MO, Liang Z, Feng D, et al. A porphyrinic zirconium metal-organic framework for oxygen reduction reaction: tailoring the spacing between active-sites through chain-based inorganic building units. J Am Chem Soc. 2020;142:15386.
- Wang B, Rhauderwiek T, Inge AK, et al. A porous cobalt tetraphosphonate metal-organic framework: accurate structure and guest molecule location determined by continuous-rotation electorn diffraction. Chem Eur J. 2018;24:17429.
- Dou J, Arguilla MQ, Luo Y, et al. Atomically precise single-crystal conducting 2D metal-organic frameworks. Nat Mater. 2021;20:222.
- Yuan S, Qin J, Xu H, et al. [Ti8Zr2O2(COO)16] cluster: an ideal inorganic building unit for photoactive metal-organic frameworks. ACS Cent Sci. 2018;4:105.
- Roy S, Huang Z, Bhunia A, et al. Electrocatalytic hydrogen evolution from a cobaloxime-based metal-organic framework thin film. J Am Chem Soc. 2019;141:15942.
- Johnstone DN, Firth FCN, Grey CP, et al. Direct imaging of correlated defect nanodomains in a metal-organic framework. J Am Chem Soc. 2020;142:13081.
- Zacher D, Schömid R, Wll C, et al. Surface chemistry of metal-organic frameworks at the liquid-solid interface. Angew Chem Int Ed. 2011;50:176.
- Moh PY, Cubillas P, Anderson MW, et al. Revelation of the molecular assembly of the nanoporous metal organic framework ZIF-8. J Am Chem Soc. 2011;133:13304.
- Han X, Liu P, Lin F, et al. Structures and structural evolution of sublayer surfaces of metal-organic frameworks. Angew Chem Int Ed. 2020;59:21419.
- Lynch DF, Moodie AF, A M. n-Beam lattice images. V. The use of the charge-density approximation in the interpretation of lattice images. Acta Crystallogr Sect A. 1975;31:300.
- Deepak FL, Casillas G. Recent highlights in advanced transmission electron microscopy techniques: applications to nanomaterials. Nanoscience. 2017;4:29.
- Zhang D, Zhu Y, Liu L, et al. Atomic-resolution transmission electron microscopy of electron beam-sensitive crystalline materials. Science. 2018;359:675.
- Liu L, Chen Z, Wang J, et al. Imaging defects and their evolution in a metal-organic framework at sub-unit-cell resolution. Nat Chem. 2019;11:622.
- Scherzer O. The theoretical resolution limit of the electron microscope. J Appl Phys. 1949;20:20.
- Li C, Zhang Q, Nayoral A. Ten years of aberration corrected electron microscopy for ordered nanoporous materials. ChemcatChem. 2020;12:1248.
- Cowley JM. Image contrast in a transmission scanning electron microscope. Appl Phys Lett. 1969;15:58.
- Pennycook SJ. Z-contrast STEM for materials science. Ultramicroscopy. 1989;30:58.
- Hillyard S, Silcox J. Detector geometry, thermal diffuse scattering and strain effects in ADF-STEM imaging. Ultramicroscopy. 1995;58:6.
- Tong Y, Zhang Q, Gu L. Scanning transmission electron microscopy: a review of high angle annular dark field and annular bright field imaging and applications in lithium-ion batteries. Chin Phys B. 2018;27(6):006107.
- Okunishim E, Ishikawa I, Sawada H, et al. Visualization of light elements at ultrahigh resolution by STEM annular bright field microscopy. Microsc Microanal. 2009;15:164.
- Liu L, Wang N, Zhu C, et al. Direct imaging of atomically dispersed molybdenum that enables location of aluminum in framework of zeolite ZSM-5. Angew Chem Int Ed. 2020;59:819.
- Shen B, Chen X, Wang H, et al. A single-molecule van der waals compass. Nature. 2021;592:541.
- Yang H, Pennycook TJ, Nellist PD. Efficient phase contrast imaging in STEM using a pixelated detector. Part II: optimisation of imaging conditions. Ultramicroscopy. 2015;151:232.
- Shen B, Chen X, Shen K, et al. Imaging the node-linker coordination in the bulk and local structures of metal-organic frameworks. Nat Commun. 2020;11:2692.
- Pennycook TJ, Lupini AR, Yang H, et al. Efficient phase contrast imaging in STEM using a pixelated detector. Part I: experimental demonstration at atomic resolution. Ultramicroscopy. 2015;151:160.
- Zhu Y, Ciston J, Zhang B, et al. Unravelling surface and interfacial structures of a metal-organic framework by transmission electron microscopy. Nat Mater. 2017;16:532.
- Cravillon J, Mnzer S, Lohmeier S-J, et al. Rapid room-temperature synthesis and characterization of nanocrystals of a prototypical zeolitic imidazolate framework. Chem Mater. 2009;21:1410.
- Hmadeh M, Lu Z, Liu Z, et al. New porous crystals of extended metal-catacholates. Chem Mater. 2012;24:3511.
- Mayoral A, Ma Y, Terasaki O. Some efforts toward understanding structural features of MOF/COF. Isr J Chem. 2018;58:1157.
- Shen K, Zhang L, Chen X, et al. Ordered macro-microporous metal-organic framework single crystals. Science. 2018;359:206.
- Deng H, Grunder S, Cordova KE, et al. Large-pore apertures in a series of metal-organic frameworks. Science. 2012;336:1018.
- Lebedev OI, Millange F, Serre C, et al. First direct imaging of giant pores of the metal-organic framework MIL-101. Chem Mater. 2005;17:6525.
- Gong X, Noh H, Gianneschi NC, et al. Interrogating kinetic versus thermodynamic topologies of metal-organic frameworks via combined transmission electron microscopy and X-ray diffraction analysis. J Am Chem Soc. 2019;141:6146.
- Feng D, Liu T, Su J, et al. Stable metal-organic frameworks containing single-molecule traps for enzyme encapsulation. Nat Commun. 2015;6:5979.
- Yang F, Mu H, Wang C, et al. Morphological map of ZIF-8 crystals with five distinctive shapes: features of filler in mixed-matrix membranes with C3H6/C3H8 separation. Chem Mater. 2018;30:3467.
- Wiktor C, Turner S, Zacher D, et al. Imaging of intact MOF-5 nanocrystals by advanced TEM at liquid nitrogen temperature. Microporous Mesoporous Mater. 2012;162:131.
- Ghosh S, Kumar P, Conrad S, et al. Electron-beam-damage in metal organic frameworks in the TEM. Microsc Microanal. 2019;25:1704.
- Mayoral A, Sanchez-Sanchez M, Alfayate A, et al. Atomic observations of microporous materials highly unstable under the electron beam: the cases of Ti-Doped AlPO4-5 and Zn-MOF-74. ChemCatChem. 2015;7:3719.
- Bentz KC, Gnanasekaran K, Bailey JB, et al. Inside polyMOFs: layered structures in polymer-based metal-organic frameworks. Chem Sci. 2020;11:10523.
- Li X, Wang J, Liu X, et al. Direct imaging of tunable crystal surface structures of MOF MIL-101 using high-resolution electron microscopy. J Am Chem Soc. 2019;141:12021.
- Wu H, Almalki M, Xu X, et al. MXene derived metal-organic framworks. J Am Chem Soc. 2019;141:20037.
- Zhou Y, Xu X, Carlsson A, et al. Local structure evolvement in MOF single crystals unveiled by scanning transmission electron microscopy. Chem Mater. 2020;32:4966.
- Mayoral A, Hall RM, Jackowska R, et al. Imaging the atomic position of light cations in a porous network and the europium (III) ion exchange capability by aberration-corrected electron microscopy. Angew Chem Int Ed. 2016;55:16127.
- Mayoral A, Mahugo R, Sanchez-Sanchez M, et al. Cs-corrected STEM imaging of both pure and Ag-supported metal-organic framework MIL-100 (Fe). Chem Cat Chem. 2017;22:3497.
- Mahugo R, Mayoral A, Snchez-Snchez M, et al. Observation of Ag nanoparticles in/on Ag@MIL-100(Fe) prepared through different procedures. Front Chem. 2019;7:686.
- Meledina M, Turner S, Filippousi M, et al. Direct imaging of ALD deposited Pt nanoclusters inside the giant pores of MIL-101. Part Part Syst Charact. 2016;33:382.
- Turner S, Lebedev OI, Schröder F, et al. Direct imaging of loaded metal-organic framework materials (metal@MOF-5). Chem Mater. 2008;20:5622.
- Hermannsdörfer J, Kempe R. Selective palladium-loaded MIL-101 catalysts. Chem Eur J. 2011;17:8071.
- Leus K, Dendooven J, Tahir N, et al. Atomic layer deposition of Pt nanoparticles within the cages of MIL-101: a mild and recyclable hydrogenation catalyst. Nanomaterials. 2016;6:45.
- Esken D, Turner S, Wiktor C, et al. GaN@ZIF-8: selective formation of gallium nitride quantum dots inside a zinc methylimidazolate framework. J Am Chem Soc. 2011;133:16370.
- Khaletskaya K, Turner S, Tu M, et al. Self-directed localization of ZIF-8 thin film formation by conversion of ZnO nanolayers. Adv Funct Mater. 2014;24:4804.
- Denny MS Jr., Parent LR, Patterson JP, et al. Transmission electron microscopy reveals deposition of metal oxide coatings onto metal-organic frameworks. J Am Chem Soc. 2018;140:1348.
- Rösler C, Esken D, Wiktor C, et al. Encapsulation of bimetallic nanoparticles into a metal-organic framework: preparation and microstructure characterization of Pd/Au@ZIF-8. Eur J Inorg Chem. 2014;2014:5514.
- Rösler C, Aijaz A, Turner S, et al. Hollow Zn/Co zeolitic imidazolate framework (ZIF) and yolk-shell metal@Zn/Co ZIF nanostructures. Chem -Eur J. 2016;22:3304.
- Schröder F, Esken D, Cokoja M, et al. Ruthenium nanoparticles inside porous [Zn4O(bdc)3] by hydrogenolysis of adsorbed [Ru(cod)(cot)]: a solid state reference system for surfactant stabilized ruthenium colloids. J Am Chem Soc. 2008;130:6119.
- Müller M, Turner S, Lebedev OI, et al. Au@MOF-5 and Au/MOx@MOF-5 (M = Zn, Ti; x = 1, 2): preparation and microstructural characterization. Eur J Inorg Chem. 2011;2011:1876.
- Aulakh D, Liu L, Varghese JR, et al. Direct imaging of isolated single-molecule magnets in metal-organic frameworks. J Am Chem Soc. 2019;141:2997.
- Li Y, Wang K, Zhou W, et al. Cryo-EM structures of atomic surfaces and host-guest chemistry in metal-organic frameworks. Matter. 2019;1:428.
- Serre C, Millange F, Thouvenot C, et al. Very large breathing effect in the first nanoporous chromium(III)-based solids: MIL-53 or CrIII(OH)·{O2C-C6H4-CO2}·{HO2C-C6H4-CO2H}x·H2Oy. J Am Chem Soc. 2002;124:13519.
- Férey G, Serre C. Large breathing effects in three-dimensional porous hybrid matter: facts, analyses, rules and consequences. Chem Soc Rev. 2009;38:1380.
- Venna SR, Jasinski JB, Carreon MA. Structural evolution of zeolitic imidazolate framework-8. J Am Chem Soc. 2020;132:18030.
- Terban MW, Banerjee D, Ghose S, et al. Early stage structural development of prototypical zeolitic imidazolate framework (ZIF) in solution. Nanoscale. 2018;10:4291.
- Wu Y, Henke S, Kieslich G, et al. Time-resolved in situ X-ray diffraction reveals metal-dependent metal-organic framework formation. Angew Chem Int Ed. 2016;55:14081.
- Vleet MHV, Weng T, Li X, et al. In situ, time-resolved, and mechanistic studies of metal-organic framework nucleation and growth. Chem Rev. 2018;118:3681.
- Saha S, Springer S, Schweinefuß ME, et al. Insight into fast nucleation and growth of zeolitic imidazolate framework-71 by in situ time-resolved light and X-ray scattering experiments. Cryst Growth Des. 2016;16:2002.
- Wu Y, Moorhouse SJ, O’Hare D. Time-resolved in situ diffraction reveals a solid-state rearrangement during solvothermal MOF synthesis. Chem Mater. 2015;27:7236.
- Cubillas P, Anderson MW, Attfield MP. Influence of isomorphous substituting cobalt ions on the crystal growth of the MOF-5 framework determined by atomic force microscopy of growing core-shell crystals. Cryst Growth Des. 2013;13:4526.
- Friščić T, Halasz I, Beldon PJ, et al. Real-time and in situ monitoring of mechanochemical milling reactions. Nat Chem. 2013;5:66.
- Katsenis AD, Puškarić A, Štrukil V, et al. In-situ X-ray diffraction monitoring of a mechanochemical reaction reveals a unique topology metal-organic framework. Nat Commun. 2015;6:6662.
- Summerfield A, Cebula I, Schröder M, et al. Nucleation and early stages of layer-by-layer growth of metal organic frameworks on surfaces. J Phys Chem C. 2015;119:23544.
- Millange F, Serre C, Guillou N, et al. Structural effects of solvents on the breathing of metal-organic frameworks: an in situ diffraction study. Angew Chem. 2008;120:4168.
- Wu J, Shan H, Chen W, et al. In-situ environmental TEM in imaging gas and liquid phase chemical reactions for materials research. Adv Mater. 2016;28:9686.
- Xu T, Sun L. Investigation on material behaviour in liquid by in situ TEM. Superlattices Microstruct. 2016;99:24.
- Liao H, Zheng H. Liquid cell transmission electron microscopy. Annu Rev Phys Chem. 2016;67:719.
- Parent LR, Bakalis E, Proetto M, et al. Tackling the challenges of dynamic experiments using liquid-cell transmission electron microscopy. Acc Chem Res. 2018;51:3.
- Pu S, Gong C, Robertson AW. Liquid cell transmission electron microscopy and its application. R Soc Open Sci. 2020;7:191204.
- Patterson JP, Abellan P, Denny MS, et al. Observing the growth of metal-organic frameworks by in situ liquid cell transmission electron microscopy. J Am Chem Soc. 2015;137:7322.
- Vailonis KM, Gnanasekaran K, Powers XB, et al. Elucidating the growth of metal-organic nanotubes combining isoreticular synthesis with liquid-cell transmission electron microscopy. J Am Chem Soc. 2019;141:10177.
- Lyu J, Gong X, Lee S-J, et al. Phase transitions in metal-organic frameworks directly monitored through in situ variable temperature liquid-cell transmission electron microscopy and in situ X-ray diffraction. J Am Chem Soc. 2020;142:4609.
- Gnanasekaran K, Vailonis KM, Jenkins DM, et al. In situ monitoring of the seeding and growth of silver metal-organic nanotubes by liquid cell transmission electron microscopy. ACS Nano. 2020;14:8735.
- Xing J, Schweighauser L, Okada S, et al. Atomistic structures and dynamics of prenucleation clusters in MOF-2 and MOF-5 syntheses. Nat Commun. 2019;10:3608.
- Parent LR, Pham CH, Patterson JP, et al. Pore breathing of metal-organic frameworks by environmental transmission electron microscopy. J Am Chem Soc. 2017;139:13973.
- Wang W, Yan H, Anand U, et al. Visualizing the conversion of metal-organic framework nanoparticles into hollow layered double hydroxide nanocages. J Am Chem Soc. 2021;143:1854.
- Xu D, Zhang D, Zou H, et al. Guidance from an in situ hot stage in TEM to synthesize magnetic metal nanoparticles from a MOF. Chem Commun. 2016;52:10513.
- Xu D, Pan Y, Chen M, et al. Synthesis and application of a MOF-derived Ni@C catalyst by the guidance from an in situ hot stage in TEM. RSC Adv. 2017;7:26377.
- Hussain MZ, Bahri M, Heinz WR, et al. An in situ investigation of the thermal decomposition of metal-organic framework NH2-MIL-125 (Ti). Microporous Mesoporous Mater. 2021;316:110957.
- Wang Z, Ke X, Zhou K, et al. Engineering the structure of ZIF-derived catalysts by revealing the critical role of temperature for enhanced oxygen reduction reaction. J Mater Chem A. 2021;9:18515.
- Dai S, Gao W, Zhang S, et al. Transmission electron microscopy with atomic resolution under atmospheric pressures. MRS Commun. 2017;7:798.