
ABSTRACT
Stimulated Raman scattering (SRS) microscopy has gained popularity in recent years due to its linearity to molecule concentration and laser intensity, and to the lack of the nonresonant background that affects its analogous technique, coherent anti-Stokes Raman scattering. However, SRS is not a background-free technique. In fact, there are other optical processes – nonlinear transient scattering and nonlinear transient absorption – that can be detrimental to the contrast and sensitivity of SRS microscopy. In this review, we provide a description of these competing optical processes and present an up-to-date description of current solutions to minimize their effect on SRS measurements.
Graphical Abstract

1. Introduction
Label-free microscopy methods based on vibrational spectroscopy are poised to become fundamental tools for scientific and bio-medical applications [Citation1–4]. In fact, the vibrational signatures of molecular compounds can be used to gain qualitative and quantitative information in a variety of different applications and studies, such as point-of-care medicine [Citation5,Citation6], guided surgery [Citation7], rapid histology [Citation8], intraoperative diagnosis [Citation9,Citation10] and endoscopy [Citation11], as well as fundamental biology [Citation2,Citation12], pharmaceutics [Citation13,Citation14], cultural heritage [Citation15–18], food industry [Citation19–23], plant science [Citation24–27] and environmental pollution analysis [Citation28–32].
The use of visible or near-IR wavelengths makes spontaneous Raman micro-spectrometry of particular interest for biological applications, thanks to the absence of absorption from water and the possibility of achieving sub-micrometer spatial resolution. However, measurements of spontaneous Raman scattering are usually time-demanding due to the randomized phase of molecular vibrations in the probed volume, which creates an incoherent scattering process. Coherent Raman scattering (CRS) [Citation33,Citation34] microscopy overcomes the acquisition speed limitations of spontaneous Raman imaging by using two synchronized and frequency-detuned laser beams called pump and Stokes beams. In fact, when the frequency difference between the pump and Stokes photons is in resonance with one of the Raman-active molecular vibrations in the specimen, the molecules in the target volume oscillate in phase – i.e. ‘coherent’ oscillations – and the Raman scattering is greatly enhanced [Citation34].
CRS microscopy is implemented in two main modalities, coherent anti-Stokes Raman scattering (CARS) and stimulated Raman scattering (SRS) microscopy [Citation34]. In particular, SRS microscopy has gained popularity in recent years [Citation3,Citation35,Citation36] thanks to the linear dependence of the signal on molecular concentration and on excitation fields’ intensities, allowing to perform quantitative measurements [Citation4,Citation37–39]. Contrary to the CARS signal, the SRS signal is not affected by a non-vibrationally resonant background contribution generated by the ubiquitous electronic four-wave-mixing nonlinear optical effect (this specific background signal is commonly referred to as the ”non-resonant background” (NRB) in the literature). For this reason, SRS microscopy has been often referred to as a background-free CRS modality. However, there are other competing effects – in particular, cross-phase modulation (XPM), two-photon absorption (TPA), and thermal lensing (TL) – that generate ubiquitous and spatially uneven non-vibrationally resonant background signals in SRS measurements, reducing contrast and sensitivity [Citation40,Citation41]. Several applications of SRS microscopy would be hindered by the presence of those background signals, motivating the continuous development of novel strategies to minimize their contribution to the measured signal.
Here, after presenting a qualitative description of the most important competing effects generating background signals in SRS microscopy, we review the state of the art of current approaches for mitigating or suppressing them. We then discuss future perspectives and requirements for a gold standard solution for truly background-free SRS microscopy.
2. SRS signal generation and detection
In SRS microscopy two laser beams – pump beam with frequency wP and Stokes beam with wS – are focused in the specimen to coherently drive molecular vibrations in the focal volume. In fact, when the spectral detuning Ω=wP-wS is in resonance with a Raman-active vibrational mode wV of molecules in the target volume, the sample acts as a nonlinear medium and mediates an exchange of energy between the two laser beams causing an intensity loss (stimulated Raman loss, SRL) and an intensity gain (stimulated Raman gain, SRG) in the pump and Stokes beams respectively. These intensity variations ∆IP,S are:
where IP and IS are the intensities of the pump and Stokes beams before the interaction, and the imaginary part of the Raman-resonant third-order susceptibility (which is linearly proportional to the Raman cross-section σR, hence to the spontaneous Raman spectrum [Citation34]). The information contained in SRL and SRG is completely symmetrical, therefore the detection of either the pump or the Stokes beam can be used to retrieve the SRS signal.
Typical Raman cross sections of molecules of interest in biology are [Citation42] cm2/sr, which is several orders of magnitude smaller than the typical cross sections associated with other optical processes. For instance, the electronic absorption cross section of some chromophores can be up to 10 orders of magnitude higher. As a consequence, the relative intensity variations that the beams experience due to the SRS process can be as small as parts per million. For this reason, the minimization of noise sources is critical for the sensitive detection of the SRS signal. In short, there are three major sources of noise in SRS microscopy [Citation43]: the additive noise due to the detection circuitry, the laser shot noise, due to the quantum nature of the light, and the laser Flicker noise, also called ”pink” or 1/f noise. The latter features a power spectral density inversely proportional to the frequency and is the dominant source of noise at low frequencies. For this reason, a lock-in detection scheme with a high modulation frequency in the order of 1ʹs-10ʹs MHz is typically implemented to reach the shot-noise limit (). To implement this scheme, the majority of SRS microscopy setups proposed to date use an intensity modulation (IM-SRS) approach, which uses an acousto or electro-optic modulator (AOM or EOM, respectively) to modulate the intensity of either the pump or the Stokes beam. The modulation is eventually transferred to the other beam through the SRS process occurring in the sample, and a single photodiode placed after the specimen detects the intensity of the probed beam and the SRS signal (either SRL or SRG) is typically extracted using a lock-in amplifier. As a simplifying example, in a SRL configuration () the intensity loss ∆IP of the pump beam is retrieved as a differential measurement between the Stokes-ON and Stokes-OFF amplitudes. Apart from lock-in amplifier detection, the SRS signal can be retrieved by use of tuned amplifiers [Citation44] or boxcar averaging [Citation45]. When the excess laser noise is still the dominating noise factor at these high modulation frequencies, such as when using fiber-based laser sources, it is possible to reduce its contribution significantly by using a balanced detection scheme [Citation46–50]. Additionally, a multiplexing scheme based on the Hadamard transform can be used to reduce the additive noise [Citation51,Citation52].
Figure 1. Sketch of typical laser noise intensity profile (grey). To avoid the small SRS signal being drowned by the larger laser noise at low frequencies, it is modulated at high frequency (red line), and measured with a lock-in detection scheme (yellow).
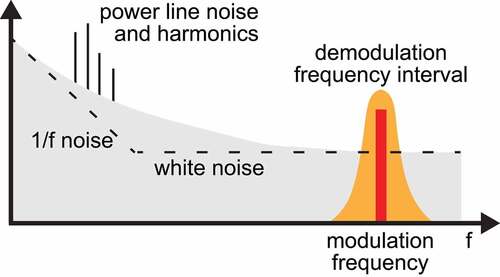
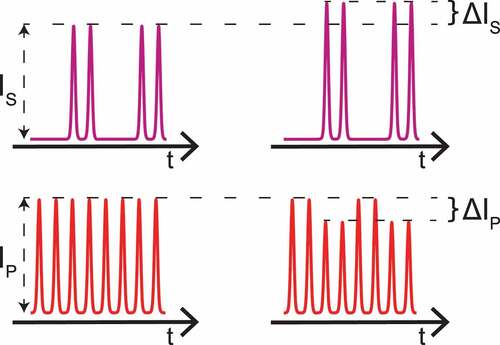
Figure 2. Intensities of beams in IM-SRS with SRL detection configuration: (left) before, and (right) after a Raman-resonant sample. The high-frequency intensity modulation of the Stokes beam is transferred to the pump beam through the SRS process in the sample.
Whereas the spontaneous Raman scattering signal intrinsically provides the whole vibrational spectrum at once, in SRS microscopy the signal is typically probed at a single vibrational frequency at a time. To obtain hyperspectral images – i.e. where a vibrational spectrum is obtained at each pixel of the image – the SRS signal has to be measured at several different vibrational frequencies. When the probed frequency range is particularly large, spanning several hundreds of cm–1, we have so-called broadband SRS measurements [Citation53]. The vibrational spectrum of the majority of chemical compounds of biological relevance has two main frequency intervals of interest: the so-called fingerprint (600–1800 cm–1) and CH-stretching (2700–3100 cm–1) regions. The former, in particular, features several vibrational bands from aromatic amino acids, amide groups, secondary protein structures, and stretching or deformation of bonds formed by carbon atoms with nitrogen, and other carbon atoms [Citation53]. The spectral overlap of Raman bands from different molecules makes difficult their identification and quantification within compounds by relying on measurements at single wavenumbers. For this reason, probing the SRS signal across the whole fingerprint-to-CH-stretch spectral range is crucial for reliable discrimination of different molecular species [Citation30,Citation53]. A high spectral resolution, capable of resolving the typical 10 cm–1 bandwidth of Raman bands in the fingerprint region in biological specimens, is also needed to allow chemical specificity [Citation53].
3. Background signals in IM-SRS
The IM-SRS configuration has been widely used to date due to its relative ease of implementation. However, the applied intensity modulation lends itself to introducing other contributions to the demodulated signal that, although not related to molecular vibrations, are indistinguishable from the real SRS contribution. These spurious additional signals arise from competing processes – two-photon absorption [Citation54,Citation55] (TPA) and non-linear transient scattering [Citation56] – which are vibrationally non-resonant, i.e. not chemical specific, and spatially non-uniform in heterogeneous samples. Therefore, they don’t provide any chemical information, while instead reducing the contrast, and creating artifacts in SRS imaging that could hinder interesting applications [Citation41,Citation57]. In the following, we describe in more detail the specific characteristics of these competing effects and how they lead to background signals in SRS microscopy.
3.1. Two-photon absorption
The TPA process consists of the quasi-simultaneous absorption of two photons by a molecule, promoting one of its electrons from the ground state to a higher energy level (excited state). This occurs via the absorption of either two photons with the same frequency (single-color two-photon absorption), or two photons with different frequencies (two-color two-photon absorption, TCTPA), as sketched in .
Figure 3. Jablonski diagram of the different TPA processes that could happen during a SRS measurement. While the concomitant absorption of two Stokes or pump photons is not affecting the SRS signal due to the modulation scheme, the simultaneous absorption of one pump and one Stokes (two-color TPA, TCTPA) gives a spurious signal in SRS measurements.
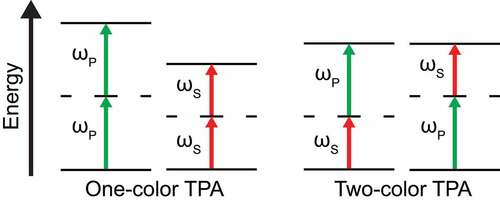
In the IM-SRS scheme, the single-color TPA process does not create a modulated signal recovered by the lock-in amplifier, hence it does not add a spurious contribution to the pure SRS signal. Instead, the TCTPA only occurs when both beams are simultaneously present, hence the related variation in the power of the probed beam is modulated with the same frequency as the modulated beam. This results in a background signal that is recovered by the lock-in amplifier and is not distinguishable from the pure SRS signal [Citation26,Citation58]. When modulating the Stokes/pump beam and detecting the pump/Stokes beam, the signal amplitude variation due to the TCTPA is:
with the TPA coefficient β given by [Citation59]:
where χ(3) is the third-order non-linear optical susceptibility of the absorbing molecule, the vacuum permittivity, c the speed of light, and λ is the beam wavelength. This phenomenon causes a virtual increase or decrease in the total detected signal – no longer purely due to the SRS process – depending on which beam’s intensity is detected (increase in SRL configuration, decrease in SRG). In fact, the TCTPA process causes an intensity loss in both laser beams (see Equationeq. 3
(3) ), giving a concordant/discordant contribution to the intensity variation of the pump/Stokes beam due to the SRS process. While this phenomenon might give a small contribution in transparent samples, in opaque or dyed specimens – and in particular in some plant tissues – the optical absorption might be sufficiently strong to give a TCTPA contribution that overwhelms the pure SRS signal [Citation26].
In some specimens, the energy carried by a single photon could be enough to promote molecules from the ground state to an excited electronic state. Even though single-photon absorption of one beam does not affect the SRS signal, it could be followed by excited-state absorption (ESA) of a photon of the other beam, affecting the SRS signal in a similar way as TCTPA. This phenomenon could represent a major problem when the electronic pre-resonance [Citation60–62] and resonance [Citation63] conditions are used to enhance the SRS signal. ESA also strongly contributes to the measured signal in the recently proposed stimulated Raman excited fluorescence (SREF) technique [Citation64].
3.2. Non-linear transient scattering
Due to the ubiquitous non-zero third-order nonlinear susceptibility χ(3) of materials, laser beams propagating in a medium experience an intensity-dependent refractive index (optical Kerr effect) [Citation59]. In particular, when two laser beams – e.g. pump and Stokes – are propagating in a nonlinear medium, each beam experiences a refractive index change ∆n proportional to the intensity of the other beam (IP,S):
where n2,XPM is the nonlinear refractive index of the material. This phenomenon is called cross-phase-modulation (XPM) [Citation56].
Another effect due to an intensity-dependent change in the refractive index is the temporally-averaged thermal lensing (TL) [Citation65]. When a high-intensity beam is focused in an absorbing medium, a temperature gradient due to the absorption in the proximity of the focal point creates a local variation of the refractive index described by the material’s thermo-optic coefficient (). This non-uniformity acts as an optical lens and varies the divergence of a probe beam coaxially propagating in the medium. Depending on the sign of the material’s thermo-optic coefficient, the TL effect can behave as a converging or diverging lens [Citation66].
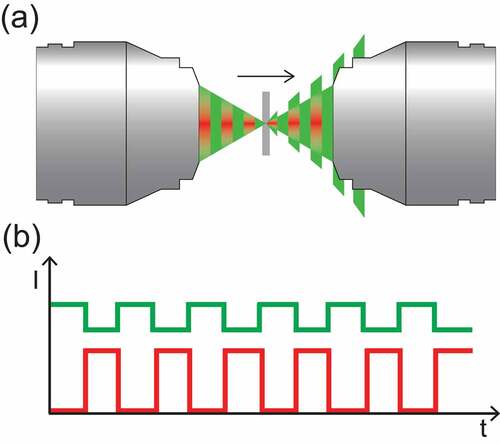
Because of the non-flat transverse intensity profile of the focused beams, XPM and TL lead to a variation of the beams’ divergence when both beams are present (). In IM-SRS, this variation of divergence is synchronous with the intensity modulation on the pump beam and causes a periodic change in the probe beam power measured by the photodetector () when a finite aperture is present in the collection path. Hence, XPM and TL create an intensity modulation that is not distinguishable from the SRS signal. While the effect of TL can be partially mitigated using high-frequency modulation [Citation67], generally already used to perform high-speed imaging and to reach shot-noise level sensitivity (), the almost instantaneous XPM process introduces a non-uniform background in heterogeneous samples that reduces contrast and sensitivity.
Figure 4. (a) The non-linear transient scattering changes the refractive index at the focal point, acting as a lens and modulating the probe beam’s divergence. (b) Intensity modulation due to the beam clipping when a finite aperture is present in the collection path.
4. Current strategies for background-free SRS microscopy
The contrast and sensitivity in IM-SRS microscopy setups are limited by background signals caused by the non-linear transient absorption and scattering processes described in the former section. For this reason, researchers have put effort into finding alternative modulation schemes that allow for obtaining background-free SRS signals.
Since the early days of SRS microscopy, it has been realized that using high-NA collection objectives reduces the non-linear transient scattering background signal [Citation68,Citation69]. High-NA condensers, however, typically feature a short working distance that makes their use complicated in some applications, such as in live-cells experiments requiring the usage of stage-top incubators. To overcome this limitation, a 3D printed high-NA catadioptric thin lens has been presented recently [Citation57]. Yet, the usage of high-NA collection optics does not completely eliminate the background signal due to non-linear transient scattering [Citation68], and does not affect non-linear transient absorption background signals. For these reasons, in recent years researchers have put effort into creating alternative configurations for SRS microscopes that could efficiently reduce or completely remove the background signals caused by these competing effects. In the following, we review these different approaches.
4.1. Frequency modulation (FM-SRS)
A powerful approach to background-free SRS takes advantage of the significantly different spectral dependence of the signals generated by the Raman effect with respect to those from (competing) non-vibrationally resonant processes [Citation58]. In fact, the amplitude of signals due to TCTPA, XPM and TL are spectrally slowly varying over tens of nanometers, while the Raman signal features sharper spectral peaks, typically in the order of 1 nm in the condensed phase [Citation53,Citation58], as shown in . Leveraging this different spectral dependence, a background-free SRS detection is achieved by measuring the signal at two different wavelengths, one being off-Raman resonance, hence with a signal solely contributed by competing effects, and one in-Raman resonance, with a signal contributed by both Raman and competing effects. By differentiating these two signals, the contribution of the competing effects is canceled out, leaving only the pure SRS signal (see ).
Figure 5. SRS and signals from competing processes as a function of the probed beam’s wavelength. While the SRS signal has a narrowband dependence, the signals caused by competing processes have a slow variation over tens of nanometers.
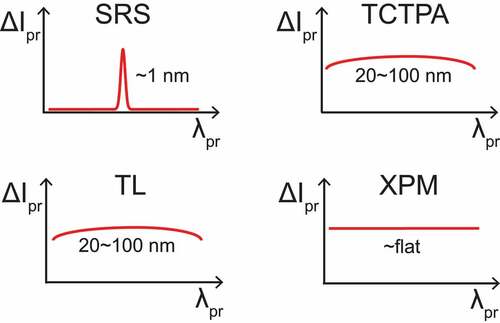
Figure 6. Background signals in IM-SRS imaging and their suppression through frequency-modulation (FM) SRS. IM-SRS images of sebaceous glands in wild-type mouse ear skin on- (a) and off-resonance (c) for the CH2 stretching mode. An overwhelming background signal is present around the lipid-rich sebaceous gland due to nonlinear transient absorption from the melanin pigment. Instead, FM-SRS images acquired on- (b) and off-resonance (d) reveal the relatively weak lipid signal near the sebaceous gland thanks to the almost total cancellation of the background signal. Scale bar 10 μm. Reprinted with permission from reference [Citation72]. Copyright The Optical Society.
![Figure 6. Background signals in IM-SRS imaging and their suppression through frequency-modulation (FM) SRS. IM-SRS images of sebaceous glands in wild-type mouse ear skin on- (a) and off-resonance (c) for the CH2 stretching mode. An overwhelming background signal is present around the lipid-rich sebaceous gland due to nonlinear transient absorption from the melanin pigment. Instead, FM-SRS images acquired on- (b) and off-resonance (d) reveal the relatively weak lipid signal near the sebaceous gland thanks to the almost total cancellation of the background signal. Scale bar 10 μm. Reprinted with permission from reference [Citation72]. Copyright The Optical Society.](/cms/asset/97e956e1-03bb-4daf-bd07-e2dca55c0da3/tapx_a_2176258_f0006_oc.jpg)
This method is generally called frequency-modulation SRS (FM-SRS) or spectrally-modulated SRS, and has been implemented using different configurations. Using femtosecond lasers, Zhang et al. [Citation58] proposed an angle-to-wavelength pulse shaper in which the different output angles of the first and zeroth orders of an AOM were translated into picosecond pulses with two different center wavelengths by using a diffraction grating and a slit (see ). With this scheme, the authors successfully demonstrated background-free SRS microscopy of biologically relevant samples, each with a significant contribution from one of the three competing processes, XPM, TPA, and TL. In this approach, which required a significant modification of a standard SRS microscope, the spectral separation between the two selected wavenumbers was adjustable only by changing the lens pair between the AOM and the diffraction grating. In another approach, Fu et al. [Citation70] used an EOM and a polarizing beam splitter to create two pulse train replicas with a relative time delay, and exploited the time-to-wavenumber mapping of the spectral focusing SRS scheme to obtain the two FM wavenumbers. Here, the spectral separation of the two FM wavenumbers was more easily tuned by independently adjusting the time delays of the two replicas. However, this scheme still presented some complexity due to the not-trivial spatial and time alignment of three pulse trains. Hill et al. [Citation71] reduced the complexity of this approach by implementing FM-SRS in a spectral focusing setup that used an EOM and a birefringent quartz crystal to create the two collinear and delayed pulse train replicas (see ). Although this configuration reduced the complexity of the system, the spectral separation of the two FM wavenumbers could not be dynamically controlled as it was instead possible in Fu et al. [Citation70], and could only be adjusted by swapping birefringent crystals with different lengths.
Figure 7. Proposed schemes for the FM-SRS approach. (a) Setup based on an angle-to-wavelength pulse shaper. Reprinted with permission from reference [Citation58]. Copyright The Optical Society. (b) Scheme using spectral focusing and a birefringent quartz crystal to create two delayed pulse train replicas. Reprinted with permission from reference [Citation71]. Copyright 2019 American Chemical Society.
![Figure 7. Proposed schemes for the FM-SRS approach. (a) Setup based on an angle-to-wavelength pulse shaper. Reprinted with permission from reference [Citation58]. Copyright The Optical Society. (b) Scheme using spectral focusing and a birefringent quartz crystal to create two delayed pulse train replicas. Reprinted with permission from reference [Citation71]. Copyright 2019 American Chemical Society.](/cms/asset/7beaaff2-1a63-40e1-9076-9e5c529b31bb/tapx_a_2176258_f0007_oc.jpg)
Xiong et al. [Citation72] implemented FM-SRS microscopy with a different approach. They used self-phase modulation inside a single-mode fiber to deplete the power spectral density of the Stokes picosecond pulse at its central frequency and spectrally distribute it to two symmetric side lobes, one blue-shifted and the other red-shifted. After this spectral slitting, the two pulse trains corresponding to the two side lobes were separately picked up and then suitably delayed and recombined to have a frequency-modulated pulse train. Whereas the spectral separation of the sidebands can be dynamically controlled in this scheme by changing the power coupled to the fiber, optimal power re-distribution to two side bands is achieved around certain powers, so to certain spectral separations. Nevertheless, this operation requires manual adjustment and implies that also the power on the specimen changes. More control over the spectral separation between the side bands can be achieved by using different fiber lengths, requiring time-consuming replacement and alignment of parts. This approach increases the complexity of the optical (SRS) setup, and is based on picosecond lasers that are relatively slow in tuning for hyperspectral SRS imaging.
FM-SRS relies on the possibility of measuring two near in-Raman and off-Raman resonance wavenumbers. This can be particularly difficult in the crowded fingerprint region, especially if the spectral separation between the two probed wavelengths is fixed. For this reason, a system capable of dynamically tuning the spectral separation between the two probed wavenumbers is preferable. More recently, new schemes that allow an easy and dynamic selection of the two FM wavenumbers, by using an acousto-optic tunable filter [Citation73] or by exploiting a fast and widely tunable fiber-based optical parametric oscillator [Citation74] have been presented.
Of note, a similar background signal suppression could be achieved in IM-SRS setups by collecting an in-Raman resonance and one off-Raman resonance image, and subsequently subtracting them. However, because the two images are not simultaneously collected, this approach is not suitable for studying fast dynamic processes. This limitation can be overcome by using SRS microscopy approaches that probe at least two vibrational frequencies at the same time, as done by either demodulating at a single frequency two signals in quadrature [Citation75–77] or using two or more de-modulation frequencies [Citation78–80]. However, performing a digital subtraction of the in-Raman and off-Raman resonance signals gives a -fold increment in the noise [Citation71], reducing the signal-to-noise ratio (SNR) of the digitally obtained image.
4.2. Polarization modulated SRS
The polarization modulation SRS (PoM-SRS) approach relies on the dependence of the amplitude of the SRS signal on the relative angle between the polarizations of the pump and Stokes beams. In fact, for highly polarized Raman bands, the SRS signal is maximum when the two polarizations are parallel and minimum (eventually zero) when they are perpendicular [Citation34]. On the contrary, the XPM and TL effects depend on the relative polarization between the two beams to a much lesser degree.
Andreana et al. [Citation81] showed successful subtraction of XPM background in SRS spectroscopy and microscopy using a high-frequency PoM-SRS scheme. While this approach does not significantly increase the complexity of the SRS setup, the presence of Raman modes with different symmetries causes variability to the polarization angle dependence of the SRS signal [Citation82], hence in the amplitude of the extracted SRS signal. Moreover, any birefringence in the sample would further reduce the contrast [Citation81].
4.3. Phase-modulation (PM-SRS)
In the context of single-beam CRS microscopy, Ito et al. [Citation83,Citation84] proposed a pump-probe time-resolved SRS modality called phase-modulated SRS (PM-SRS). In this approach, starting from a broadband pump pulse for impulsive SRS excitation, two spectrally de-tuned bands are selected and temporally delayed with respect to the pump pulse, to be used as probe beams. One of the two bands is then periodically phase-modulated with a saw-tooth waveform. This phase modulation induces a phase-locked intensity modulation on the other band when the sample presents a vibration mode whose frequency corresponds to the spectral de-tuning between the two bands. A maximum spectral resolution of 25 cm–1 is achieved with spectral focusing. This phase-modulation approach avoids all the competing nonlinear background signals (XPM, TCTPA, and TL) present in IM-SRS setups, and provides a signal depending solely on the SRS effect. Additionally, the time delay between the pump and the probe pulses suppresses short-lived Raman signals – characteristic of abundant biomolecules such as proteins, lipids, and water – - and allows the detection of only long-lived Raman signals. While this lifetime selectivity could limit the applicability of PM-SRS in imaging of tissue morphology and analysis of lipids, it could be useful when detecting small drug molecules in living cells and tissues [Citation83]. PM-SRS has been so far reported only in the low wavenumber region (400 to 1500 cm–1) [Citation83–85], as most impulsive SRS systems. Additionally, the phase modulation is applied at a relatively low frequency (35 kHz), limiting the image acquisition speed and the usability of high-power fiber laser sources typically affected by a high laser intensity noise. Overall, it is suggested that PM-SRS could complement an IM-SRS microscopy setup for the analysis of small-molecule drugs [Citation84].
4.4. Stimulated Raman gain and opposite loss detection (SRGOLD)
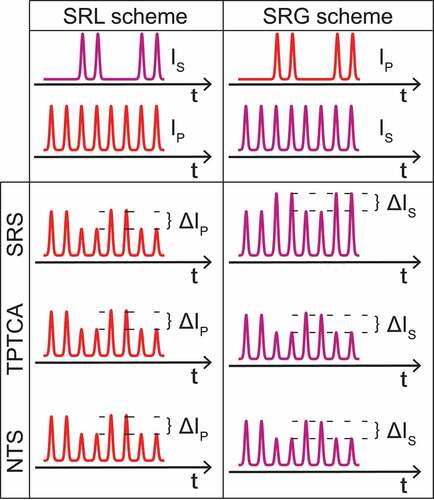
The Stimulated Raman gain and opposite loss detection (SRGOLD) scheme [Citation86,Citation87] is based on a different approach. As mentioned before, the SRS process leads to an increase in the intensity of the Stokes beam (SRG signal) and causes a loss in the intensity of the pump beam (SRL signal). On the contrary, the background competing effects contribute in the same way on both beams: a loss in intensity in the case of TCTPA and a gain/loss in the presence of nonlinear transient scattering when a finite aperture is used for collection, as displayed in . Therefore, when computing the difference between the SRG and SRL signals, the pure SRS contribution would sum up while the background signals would cancel out.
Figure 8. Intensity variation of the probed beam due to SRS and competing processes in the IM-SRS configuration. The SRS process causes a modulation with opposite signs for the two schemes, i.e. a gain in the Stokes beam (SRG scheme) and a loss in the pump beam (SRL scheme). Instead, the competing processes result in a loss effect in both schemes. NTS: non-linear transient scattering.
This approach has been proposed by Berto et al. [Citation86], who implemented a system capable to measure SRG and opposite SRL by using three laser beams, one at a fixed frequency w0 and two tunable beams at w0±∆w. The two latter beams are intensity-modulated with the same frequency fM but with a π phase difference, whereas the one at w0 is probed by a single detector. The intensity of the probed beam will have a modulation at frequency fM due to the interaction with the spectrally detuned beams in the specimen. Because of this scheme, the magnitude of the SRS signal is double that of a conventional IM-SRS setup. Moreover, with a precise balancing of the intensities of the beams the background signals are efficiently suppressed [Citation86].
Lombardini et al. [Citation87] recently proposed a compact SRGOLD module that was used to successfully suppress TCTPA, XPM, and TL background in some test samples. This module provides all the elements for power control and phase-lock of the intensity modulation of the two beams.
While being an effective solution for background-free SRS, the SRGOLD approach presents higher complexity due to the necessity to align three laser beams and the use of doubly-resonant OPOs, which are more complex than singly resonant OPOs. Moreover, because of the large wavelength separation between the three beams, the suppression of the background fails when there are wavelength un-symmetric spurious effects [Citation87]. In fact, TCTPA and XPM have a similar effect on the SRL and SRG signals only when the beams’ wavelengths are not too far apart. If this is not the case, it would be better to measure the SRG and SRL signals separately [Citation88]. Additionally, larger Raman shifts (e.g. the CH-stretch region) are not accessible because the very large difference in wavelengths of the three beams would introduce chromatic aberrations in the focusing objective that drastically alter the overlap along the longitudinal axis [Citation88]. Automated hyperspectral acquisitions with the SRGOLD scheme are limited to small spectral regions (few hundreds of cm–1) because the effective cancellation of the parasitic effects requires time-demanding manual adjustments to balance precisely the laser beams’ intensities [Citation87].
4.5. Stimulated Raman gain and loss (SRGAL)
An approach similar to the SRGOLD is based on the simultaneous detection of SRG and SRL signals in a conventional two-beam laser source configuration, as proposed almost at the same time by Heuke et al. [Citation88] and Fimpel et al. [Citation89]. This can be done by intensity-modulating both laser beams at two different frequencies – fP for the pump beam and fS for the Stokes beam, as shown in (b) – and measuring their intensities with two different photodiodes. The simultaneous acquisition of SRL and SRG signals is then achieved by demodulating the pump and Stokes beams’ intensities with two separate LIAs at frequency and
, respectively.
Figure 9. Comparison between the SRGOLD [Citation86,Citation87] and SRGAL [Citation88,Citation89] modulation schemes. (a) In the SRGOLD scheme, the idler (i) and signal (s) beams are intensity-modulated at the same frequency but 180°-shifted phase, and the probe (p) beam experiences an intensity modulation with amplitude . (b) In the SRGAL scheme, the pump (P) and Stokes (S) beams are intensity-modulated at two different frequencies, and SRL and SRG signals can be retrieved separately and simultaneously.
![Figure 9. Comparison between the SRGOLD [Citation86,Citation87] and SRGAL [Citation88,Citation89] modulation schemes. (a) In the SRGOLD scheme, the idler (i) and signal (s) beams are intensity-modulated at the same frequency but 180°-shifted phase, and the probe (p) beam experiences an intensity modulation with amplitude . (b) In the SRGAL scheme, the pump (P) and Stokes (S) beams are intensity-modulated at two different frequencies, and SRL and SRG signals can be retrieved separately and simultaneously.](/cms/asset/de99eac6-d3ab-45ac-88ad-060805c9024d/tapx_a_2176258_f0009_oc.jpg)
In this scheme, the simultaneous acquisition of the SRL and SRG images is used to have a semi-quantitative evaluation of the non-vibrationally resonant signals contributing to the background in SRS by performing a pixel-to-pixel comparison [Citation88]. Remarkably, in the presence of TCTPA, its related background signal could be used as an additive source of contrast in the specimen and for analysis of the absorbing molecules [Citation54]. However, if different types of competing effects are present at the same time, the SRGAL approach provides information about their global combined effect but it is not capable of discriminating between them.
The SRGAL scheme allows background signal suppression and gives an improved SNR compared to conventional IM-SRS, allowing to perform measurements two times faster [Citation88]. As pointed out by Fimpel et al. [Citation89], an additional feature of the SRGAL scheme is the suppression of the background affecting the SREF signal [Citation90,Citation91] by performing the fluorescence detection at the beat frequency by means of a third LIA.
Compared to conventional IM-SRS schemes, the SRGAL configuration can be implemented by adding a second intensity modulator, photodiode and LIA. Compared to the SRGOLD scheme, the use of two laser beams instead of three makes the alignment more straightforward and reduces the problems due to the large wavelength difference. However, also in the SRGAL configuration, the efficiency of background suppression is affected by the intensity ratio of laser beams, requiring additional manual adjustments. For this reason, automated hyperspectral acquisitions with current implementations are limited to spectral intervals of a few hundred of cm–1) of the vibrational spectrum [Citation88].
5. Conclusions
In this review, after introducing the most important competing effects and how they create background signals in intensity-modulation-based SRS microscopes, we discussed current strategies to mitigate their contributions to the measured signal. The variety of configurations proposed to date highlights the lack of a gold-standard solution for background-free SRS microscopy. In fact, many of the proposed schemes require rather complex technical solutions, have optimal performances only in limited regions of the Raman spectrum, or necessitate manual adjustments and optimizations hindering their automation, a critical requirement for usability by non-specialists. Indeed, the development of an easy-to-use and turn-key operation machine is necessary for SRS microscopy to reach a bigger community[91].
Additionally, many molecular species feature narrow and overlapping Raman bands in the fingerprint region, requiring high spectral resolution (typically cm–1) for reliable chemical assignment. However, some of the approaches outlined in this review present a spectral resolution in excess of 20 cm–1.
Overall, the rejection of background signals in SRS microscopy has been an active area of research and several effective schemes have been presented to date. Further efforts are still needed to identify a strategy meeting all of the above requirements.
Disclosure statement
No potential conflict of interest was reported by the author(s).
Additional information
Funding
References
- Min W, Freudiger CW, Lu S, et al. Coherent Nonlinear Optical Imaging: beyond Fluorescence Microscopy. Annu Rev Phys Chem. 2011;62:507–21.
- Cheng JX, Xie XS. Vibrational spectroscopic imaging of living systems: an emerging platform for biology and medicine. Science. 2015;350:6264.
- Camp Jr CH, Cicerone MT. Chemically sensitive bioimaging with coherent Raman scattering. Nat Photonics. 2015;9:295–305.
- Liao CS, Cheng JX. In situ and in vivo molecular analysis by coherent raman scattering microscopy. Ann Rev Anal Chem. 2016;9:69–93.
- Mitchell AL, Gajjar KB, Theophilou G, et al. Vibrational spectroscopy of biofluids for disease screening or diagnosis: translation from the laboratory to a clinical setting. J Biophotonics. 2014;7:153–165.
- Pahlow S, Weber K, Popp J, et al. Application of vibrational spectroscopy and imaging to point-of-care medicine: a review. Appl Spectrosc. 2018;72:52–84.
- Meyer T, Ackermann R, Kammel R, et al. CARS-imaging guidance for fs-laser ablation precision surgery. Analyst. 2019;144:7310–7317.
- Lee M, Herrington CS, Ravindra M, et al. Recent advances in the use of stimulated Raman scattering in histopathology. Analyst. 2021;146:789–802.
- Hollon TC, Lewis S, Pandian B, et al. Rapid intraoperative diagnosis of pediatric brain tumors using stimulated Raman histology. Cancer Res. 2018;78:278–289.
- Hollon TC, Pandian B, Adapa AR, et al. Near real-time intraoperative brain tumor diagnosis using stimulated Raman histology and deep neural networks. Nat Med. 2020;26:52–58.
- Lukic A, Dochow S, Bae H, et al. Endoscopic fiber probe for nonlinear spectroscopic imaging. Optica. 2017;4:496.
- Xu J, Yu T, Zois CE, et al. Unveiling cancer metabolism through spontaneous and coherent raman spectroscopy and stable isotope probing. Cancers (Basel). 2021;13:1718.
- Wartewig S, Neubert RH. Pharmaceutical applications of Mid-IR and Raman spectroscopy. Adv Drug Deliv Rev. 2005;57:1144–1170.
- De Beer T, Burggraeve A, Fonteyne M, et al. Near infrared and Raman spectroscopy for the in-process monitoring of pharmaceutical production processes. Int J Pharm. 2011;417:32–47.
- Franquelo ML, Duran A, Herrera LK, et al. Comparison between micro-Raman and micro-FTIR spectroscopy techniques for the characterization of pigments from Southern Spain Cultural Heritage. J Mol Struct. 2009;924-926:404–412.
- Svobodová E, Bosáková Z, Ohlídalová M, et al. The use of infrared and Raman microspectroscopy for identification of selected red organic dyes in model colour layers of works of art. Vib Spectrosc. 2012;63:380–389.
- Veneranda M, Irazola M, Pitarch A, et al. In-situ and laboratory Raman analysis in the field of cultural heritage: the case of a mural painting. J Raman Spectroscopy. 2014;45:228–237.
- Prati S, Sciutto G, Bonacini I, et al. New frontiers in application of FTIR microscopy for characterization of cultural heritage materials. Topics in Current Chem. 2016;374:1–32.
- Thygesen LG, Løkke MM, Micklander E, et al. Vibrational microspectroscopy of food. Tre Food Sci Technol. 2003; 14: 50–57.
- Bauer R, Nieuwoudt H, Bauer FF, et al. FTIR spectroscopy for grape and wine analysis. Anal Chem. 2008;80:1371–1379.
- Rohman A, Man YC. Fourier transform infrared (FTIR) spectroscopy for analysis of extra virgin olive oil adulterated with palm oil. Food Res Int. 2010;43:886–892.
- Yang D, Ying Y. Applications of Raman spectroscopy in agricultural products and food analysis: a review. Appl Spectrosc Rev. 2011;46:539–560.
- Jiménez-Sanchidrián C, Ruiz JR. Use of Raman spectroscopy for analyzing edible vegetable oils. Appl Spectrosc Rev. 2016;51:417–430.
- Butler HJ, McAinsh MR, Adams S, et al. Application of vibrational spectroscopy techniques to non-destructively monitor plant health and development. Anal Methods. 2015;7:4059–4070.
- Iino T, Hashimoto K, Asai T, et al. Multicolour chemical imaging of plant tissues with hyperspectral stimulated Raman scattering microscopy. Analyst. 2021;146:1234–1238.
- Mansfield JC, Littlejohn GR, Seymour MP, et al. Label-free chemically specific imaging in planta with stimulated Raman scattering microscopy. Anal Chem. 2013;85:5055–5063.
- Littlejohn GR, Mansfield JC, Parker D, et al. In vivo chemical and structural analysis of plant cuticular waxes using stimulated Raman scattering microscopy. Plant Physiol. 2015;168:18–28.
- Primpke S, Lorenz C, Rascher-Friesenhausen R, et al. An automated approach for microplastics analysis using focal plane array (FPA) FTIR microscopy and image analysis. Anal Methods. 2017;9:1499–1511.
- Renner G, Sauerbier P, Schmidt TC, et al. Robust Automatic Identification of Microplastics in Environmental Samples Using FTIR Microscopy. Anal Chem. 2019;91:9656–9664.
- Laptenok SP, Martin C, Genchi L, et al. Stimulated Raman microspectroscopy as a new method to classify microfibers from environmental samples. Environ Pollut. 2020;267:115640.
- Ivleva NP. Chemical analysis of microplastics and nanoplastics: challenges, advanced methods, and perspectives. Chem Rev. 2021;121:11886–11936.
- Zada L, Leslie HA, Vethaak AD, et al. Fast microplastics identification with stimulated Raman scattering microscopy. J Raman Spectroscopy. 2018;49:1136–1144.
- Bloembergen N. The stimulated Raman effect. Am J Phys. 1967;35:989–1023.
- Cheng JX, Xie XS. Coherent Raman scattering microscopy. Boca Raton (FL, USA): CRC press; 2016.
- Zhang C, Cheng JX. Perspective: Coherent Raman scattering microscopy, the future is bright.APL Photonics. 2018;3:090901.
- Hu F, Shi L, Min W. Biological imaging of chemical bonds by stimulated Raman scattering microscopy. Nat Methods. 2019;16:830–842.
- Zhang D, Wang P, Slipchenko MN, et al. Quantitative vibrational imaging by hyperspectral stimulated Raman scattering microscopy and multivariate curve resolution analysis. Anal Chem. 2013;85:98–106.
- Fu D, Holtom G, Freudiger C, et al. Hyperspectral imaging with stimulated Raman scattering by chirped femtosecond lasers. J Phys Chem A. 2013;117:4634–4640.
- Fu D. Quantitative chemical imaging with stimulated Raman scattering microscopy. Curr Opin Chem Biol. 2017;39:24–31.
- Zhang D, Wang P, Slipchenko MN, et al. Fast vibrational imaging of single cells and tissues by stimulated Raman scattering microscopy. Acc Chem Res. 2014;47:2282–2290.
- Zhu H, Lee HJ, Zhang D. Background-free stimulated Raman scattering imaging by manipulating photons in the spectral domain. In: Cheng JX, Min W, Yasuyuki O, Polli D, editors. Stimulated Raman Scattering Microscopy. Amsterdam: Elsevier; 2022. p. 137–146.
- Nie S, Emory SR. Probing single molecules and single nanoparticles by surface-enhanced Raman scattering. Science. 1997;275:1102–1106.
- Audier X, Heuke S, Volz P, et al. Noise in stimulated Raman scattering measurement: from basics to practice. APL Photonics. 2020;5:011101.
- Liao CS, Slipchenko MN, Wang P, et al. Microsecond scale vibrational spectroscopic imaging by multiplex stimulated Raman scattering microscopy. Light Sci Appl. 2015;4:e265.
- Fimpel P, Riek C, Ebner L, et al. Boxcar detection for high-frequency modulation in stimulated Raman scattering microscopy. Appl Phys Lett. 2018;112:161101.
- Freudiger CW, Yang W, Holtom GR, et al. Stimulated Raman scattering microscopy with a robust fibre laser source. Nat Photonics. 2014;8:153–159.
- Laptenok SP, Rajamanickam VP, Genchi L, et al. Fingerprint-to-CH stretch continuously tunable high spectral resolution stimulated Raman scattering microscope. J Biophotonics. 2019;12:e201900028.
- Crisafi F, Kumar V, Scopigno T, et al. In-line balanced detection stimulated Raman scattering microscopy. Sci Rep. 2017;7:1–8.
- Ni H, Lin P, Zhu Y, et al. Multiwindow SRS imaging using a rapid widely tunable fiber laser. Anal Chem. 2021;93:15703–15711.
- De la Cadena A, Vernuccio F, Ragni A, et al. Broadband stimulated Raman imaging based on multi-channel lock-in detection for spectral histopathology. APL Photonics. 2022;7:076104.
- Berto P, Scotté C, Galland F, et al. Programmable single-pixel-based broadband stimulated Raman scattering. Opt Lett. 2017;42:1696–1699.
- Genchi L, Bucci A, Laptenok SP, et al. Hadamard-transform spectral acquisition with an acousto-optic tunable filter in a broadband stimulated Raman scattering microscope. Opt Express. 2021;29:2378.
- Polli D, Kumar V, Valensise CM, et al. Broadband coherent Raman scattering microscopy. Laser Photonics Rev. 2018;12:1800020.
- Fu D, Ye T, Matthews TE, et al. Two-color, two-photon, and excited-state absorption microscopy. J Biomed Opt. 2007;12:054004.
- Fu D, Ye T, Matthews TE, et al. High-resolution in vivo imaging of blood vessels without labeling. Opt Lett. 2007;32:2641–2643.
- Wilson JW, Samineni P, Warren WS, et al. Cross-phase modulation spectral shifting: nonlinear phase contrast in a pump-probe microscope. Biomed Opt Express. 2012;3:854–862.
- Bertoncini A, Laptenok SP, Genchi L, et al. 3D-Printed high-NA catadioptric thin lens for suppression of XPM background in stimulated raman scattering microscopy. J Biophotonics. 2021;14:e202000219.
- Zhang D, Slipchenko MN, Leaird DE, et al. Spectrally modulated stimulated Raman scattering imaging with an angle-to-wavelength pulse shaper. Opt Express. 2013;21:13864–13874.
- Degiorgio V, Cristiani I. Photonics. Cham: Springer; 2016.
- Wei L, Min W. Electronic preresonance stimulated Raman scattering microscopy. J Phys Chem Lett. 2018;9:4294–4301.
- Bi Y, Yang C, Chen Y, et al. Near-resonance enhanced label-free stimulated Raman scattering microscopy with spatial resolution near 130 nm. Light Sci Appl. 2018;7:1–10.
- Lee HJ, Huang KC, Mei G, et al . Pre-resonance stimulated Raman scattering spectroscopy and imaging of membrane potential using near-infrared rhodopsins. In: Periasamy A, So PTC, König K, editors. Multiphoton Microscopy in the Biomedical Sciences XIX;; 2019 Feb 2-7; San Francisco (CA), vol. 10882. Bellingham (WA): SPIE; 2019. p. 223–228.
- Shi L, Xiong H, Shen Y, et al. Electronic Resonant Stimulated Raman Scattering Micro-Spectroscopy. J Phys Chem B. 2018;122:9218–9224.
- Xiong H, Shi L, Wei L, et al. Stimulated Raman excited fluorescence spectroscopy and imaging. Nat Photonics. 2019;13:412–417.
- Uchiyama K, Hibara A, Kimura H, et al. Thermal lens microscope. Jpn J Appl Phys. 2000;39:5316.
- Badran HA, Al-Fregi AA, Alfahed RF, et al. Study of thermal lens technique and third-order nonlinear susceptibility of PMMA base containing 5, 5-dibromo-o-cresolsulfophthalein. J Mater Sci. 2017;28:17288–17296.
- Berciaud S, Cognet L, Blab GA, et al. Photothermal heterodyne imaging of individual nonfluorescent nanoclusters and nanocrystals. Phys Rev Lett. 2004;93:2–5.
- Popov KI, Pegoraro AF, Stolow A, et al. Image formation in CARS and SRS: effect of an inhomogeneous nonresonant background medium. Opt Lett. 2012;37:473.
- Chung CY, Hsu J, Mukamel S, et al. Controlling stimulated coherent spectroscopy and microscopy by a position-dependent phase. Phys Rev A. 2013;87:033833.
- Fu D, Yang W, Xie XS. Label-free imaging of neurotransmitter acetylcholine at neuromuscular junctions with stimulated Raman scattering. J Am Chem Soc. 2017;139:583–586.
- Hill AH, Munger E, Francis AT, et al. Frequency modulation stimulated raman scattering microscopy through polarization encoding. J Phys Chem B. 2019;123:8397–8404.
- Xiong H, Qian N, Zhao Z, et al. Background-free imaging of chemical bonds by a simple and robust frequency-modulated stimulated Raman scattering microscopy. Opt Express. 2020 may;28:15663.
- Grassi E, Laptenok S, Genchi L, Liberale C. Background-free stimulated Raman scattering microscopy with acousto-optic tunable filter. In: Biomedical Spectroscopy, Microscopy, and Imaging II (p. PC121440G); San Francisco (CA, USA). Bellingham (WA): SPIE; 2022. p. 121440. doi:10.1117/12.2621122.
- Wallmeier K, Würthwein T, Lemberger N, et al. Frequency modulation stimulated Raman scattering scheme for real-time background correction with a single light source. Biomed Opt Express. 2023;14:315–325.
- He R, Xu Y, Zhang L, et al. Dual-phase stimulated Raman scattering microscopy for real-time two-color imaging. Optica. 2017 Jan;4:44–47.
- Yang W, Li A, Suo Y, et al. Simultaneous two-color stimulated Raman scattering microscopy by adding a fiber amplifier to a 2 ps OPO-based SRS microscope. Opt Lett. 2017;42:523–526.
- Freudiger CW, Min W, Holtom GR, et al. Highly specific label-free molecular imaging with spectrally tailored excitation-stimulated Raman scattering (STE-SRS) microscopy. Nat Photonics. 2011;5:103–109.
- Fu D, Lu FK, Zhang X, et al. Quantitative chemical imaging with multiplex stimulated Raman scattering microscopy. J Am Chem Soc. 2012;134:3623–3626.
- Liao C-S, Wang P, Wang P, et al. Spectrometer-free vibrational imaging by retrieving stimulated Raman signal from highly scattered photons. Sci Adv. 2015;1:e1500738.
- Heuke S, Sarri B, Audier X, et al. Simultaneous dual-channel stimulated Raman scattering microscopy demultiplexed at distinct modulation frequencies. Opt Lett. 2018 Aug;43:3582–3585.
- Andreana M, Houle MA, Moffatt DJ, et al. Amplitude and polarization modulated hyperspectral stimulated raman scattering microscopy. Opt Express. 2015 nov;23:28119.
- Munhoz F, Brustlein S, Hostein R, et al. Polarization resolved stimulated Raman scattering: probing depolarization ratios of liquids. J Raman Spectroscopy. 2012;43:419–424.
- Ito T, Obara Y, Misawa K. Single-beam phase-modulated stimulated Raman scattering microscopy with spectrally focused detection. J Opt Soc Am B. 2017;34:1004–1015.
- Ito T, Obara Y, Invited Article: MK. Spectral focusing with asymmetric pulses for high-contrast pump–probe stimulated Raman scattering microscopy. APL Photonics. 2018;3:092405.
- Ito T, Iguchi R, Matsuoka F, et al. Label-free skin penetration analysis using time-resolved, phase-modulated stimulated Raman scattering microscopy. Biomed Opt Express. 2021;12:6545–6557.
- Berto P, Andresen ER, Rigneault H. Background-free stimulated Raman spectroscopy and microscopy. Phys Rev Lett. 2014 feb;112:053905.
- Lombardini A, Berto P, Duboisset J, et al. Background-suppressed SRS fingerprint imaging with a fully integrated system using a single optical parametric oscillator. Opt Express. 2020 may;28:14490.
- Heuke S, Lombardini A, Büttner E, et al. Simultaneous stimulated Raman gain and loss detection (SRGAL). Opt Express. 2020 sep;28:29619.
- Fimpel P, Choorakuttil AJ, Pruccoli A, et al. Double modulation SRS and SREF microscopy: signal contributions under pre-resonance conditions. Phys Chem Chem Phys. 2020;22:21421–21427.
- Xiong H, Min W. Combining the best of two worlds: stimulated Raman excited fluorescence. J Chem Phys. 2020;153:210901.
- Prince RC, Potma EO. Coherent Raman scattering microscopy: capable solution in search of a larger audience. J Biomed Opt. 2021;26:060601.