
ABSTRACT
Urbanisation is occurring globally and rapidly with potential to compromise the development of sustainable, liveable and healthy cities. Urban observatories have also existed for many years addressing a range of relevant urban issues. These observatories provide a unique method to translate research into practice, support evidence-informed policy and planning, target actions of the sustainable development goals, address spatially based health inequities and improve the liveability of cities. This paper provides an analysis of the Australian Urban Observatory, a digital liveability planning platform using urban analytics to observe and enhance understanding of liveability inequities in Australian cities that is linked to policy and planning. The analysis aims to share learnings about development of the Australian Urban Observatory, including the conceptual framework of liveability, planning tools, and the resulting impact in policy and planning applications. This is the first urban observatory in Australia that will continue to expand and develop over time, supporting urban governance, democratic process and creating real world policy impact through partnership between academia, government, industry and the community.
Introduction
Urban development, population growth and urban systems
Urbanisation is not a new phenomenon but the speed of urban development over the past 70 years has become increasingly rapid. In 1950, only 171 million people lived in urbanised areas compared to 4.2 billion in 2018, with 68% of the world’s population projected to live in urban areas by 2050 (United Nations Citation2019). The shift towards living in urban areas also places additional challenges on population health, sustainable urban development and the targets of the Sustainable Development Goals (United Nations Development Program Citation2015). With such a large proportion of the population residing in cities, Goal 11 of making cities inclusive, safe, resilient and sustainable is challenging but critical. To achieve this, cities must provide equitable access to employment, housing, transport, education, local services and open spaces and embrace both participatory and evidence-informed planning methods. All of these factors are also essential for the development of healthy and liveable cities that comprise interrelated and dynamic urban systems (Murayama Citation2000, Stevenson and Gleeson Citation2019).
Increasing interest in urban observatories has developed over the past 30 years. Urban observatories are designed to study the dynamic processes of complex urban systems (Dobler et al. Citation2021) with growing interest in the topic due to social, economic and environmental implications associated with revolutions of urbanisation, transport and data availability and technological developments (Miller et al. Citation2021). Urban observatories have been adopted by the United Nations as important mechanisms that support policy development and action towards the 2030 Agenda for Sustainable Development, particularly Sustainable Development Goal (SDG) 11 of Sustainable cities and communities, SDG 3 of Good health and wellbeing and SDG 17 of Partnership for the goals encouraging measurement, monitoring and reporting of progress (Habitat Citation2020b). The UN has even developed a guide on setting up an urban observatory (Habitat Citation2020a) to help governments and local authorities to collect, analyse and disseminate information on urban development at the city and national levels to support decision making and evidence-informed policy development. Observatories can provide both an awareness and evaluation of the SDGs when directly linked to their 169 targets.
Digital urban data platforms like observatories play an important role in bringing together academic research, government and the private sector (Miller et al. Citation2021), and link urban policies to public health and spatially based health inequities (Caiaffa et al. Citation2014). These platforms have an important role in translating and connecting urban planning, sustainability and social determinants of health research using indicators to link evidence to public policy and planning practice (Bannan et al. Citation2022). Urban observatories have been used to identify urban health inequities, support good governance and democratic decision making (Corburn and Cohen Citation2012) and sustainable recovery from the COVID-19 pandemic (Acuto et al. Citation2021).
Before development of the Australian Urban Observatory (AUO),Footnote1 there was no capacity for governments or local authorities in Australia to assess the impact of urban policies and urban development over time on the liveability of local neighbourhoods, municipalities, or cities. Australia is a country characterised by cities with sprawling low density development and ongoing consumption of urban land (Rahnama et al. Citation2020) readily available on the boundaries of urban areas. Early research showed that the liveability of Australian cities was being compromised by urban policy and planning practices (Arundel et al. Citation2017), despite liveability being a preeminent goal in urban planning and awareness that built environment planning influences health (McGreevy et al. Citation2020). Consequently, the AUO was developed to share detailed evidence on the (changing) liveability of Australian cities with urban policy and planning decision-makers and influence evidence-informed policy development.
The concept of the urban observatory has been credited to Robert Wood in 1962 and his objective to connect urban science to political form and for academics to improve their methods of translating urban research knowledge into accessible tools for government audiences to solve metropolitan problems (Williams Citation1972). It could also be argued that Sir Patrick Geddes was an earlier proponent of the urban observatory, connecting urban and spatial form based on sociological and geographical approaches to town planning and regional self-determination (Meller Citation2005). Geddes designed an Outlook Tower in the 1890s that used a camera obscura to observe the city of Edinburgh. He has been described as a patriarch of modern urban planning connecting visual interpretation, dwellings, society, citizenship, regional surveying and immersive learning (Amati et al. Citation2017). He argued that observations of geographical and social environments, and associated inequity, should be interpreted and understood with knowledge of the past to really discern and identify future needs and city design (Geddes Citation1919). He was a transdisciplinary leader of the 19th century, well before the term ‘transdisciplinary’ would be commonly understood. All of his work was based on assumptions of life phenomena and sciences being intrinsically related despite their descriptions as different and independent disciplines (Goist Citation1974). At the same time that Geddes was connecting geography, housing and sociology in Scotland, Charles Booth had begun his census like surveys into London life and labour connecting place to poverty, industry and religion across London streets (Booth Citation1893).
Observatories of the 20th century
More modern history associated with the development of urban observatories can be traced back to a developing indicators movement of the late 20th century in the USA. The US Department of Housing and Urban Development developed the program in 1968 with cooperation from the National League of cities (Williams, Citation1972) and expanded the program across 10 cities from 1974 to 1977. The programs involved matched funding from partner cities to test the idea that university research and resources could be applied to improve public policy and administration. During this initial program testing phase, smaller cities were the focus, supporting public officials who lacked the resources needed to effectively deal with planning problems. The ingenuity of the urban observatory program was partnership between scholars, public administrators and politicians to address public policy agendas with applied objective inquiry (Irwin Citation1972).
Several public health observatories were also developed during the 1970s. Beginning in Canada and France in 1974, the first public health observatories were concerned with social and physical environments, health outcomes and inequities, and were designed to aid evidence-informed health planning (Hemmings and Wilkinson Citation2003). Later in 1990, the Liverpool Public Health Observatory was developed and the initiative was later supported by national public health policy in the Blair government that developed public health observatories in partnerships with universities across the UK (Ashton Citation2000). These public health observatories were designed to identify gaps in health information, increase accessibility to data, facilitate the use of evidence working with all tiers of government, non-government and private sectors and support evidence-informed policy and practice (Hunter et al. Citation2000). The term ‘observatory’ was used to emphasise objectivity in analysis and descriptions of patterns and interrelationships, with eight regional public health observatories developed in the UK and numerous others in France, Switzerland and Western Europe (Ashton Citation2000). Later this would be expanded to Africa, Asia, Latin America and North America with many established with support of the World Health Organisation (Aspinall et al. Citation2016). Although numerous public health observatories have been established across the globe (Hemmings and Wilkinson Citation2003, Caiaffa et al. Citation2014, Castillo-Salgado Citation2015), others have focused on sustainability (Holden Citation2006) and most recently, real-time dashboarding of COVID-19 incidence and social determinants of health (Brakefield et al. Citation2020).
UN-Habitat has continued to play a key role in facilitating partnership and collaboration with urban observatories worldwide with interest in applied data and indicators to support decision making and monitoring progress towards the SDGs. This has included establishment of a global urban network of observatories in 1997 through the Global Urban Observatory (GUO) Unit that is currently coordinating 374 observatories worldwide (UN-Habitat Citation2022) and developed a guide on how to set up an observatory (UN-HABITAT Citation2020). Although not specific to health, common characteristics of observatories include the following: indicators produced at neighbourhood-level geography; strong partnership engagement with public and private sectors; capacity building support; dissemination of meaningful indicators prioritising sustainable development; measurement and monitoring that supports sustainable urban systems and decision making; and participatory planning across society to support good governance, democracy and information sharing. The first Australian Urban Observatory (Davern et al. Citation2020) was established in 2020 and developed based on these principles as well as the learnings of current and historical urban observatories.
Methods
This paper provides a case study analysis of the Australian Urban Observatory including the rationale and theory behind development, the conceptual framework, intended audience, capacity building activities, tools and resources, current policy applications and future directions.
Results
Introducing the Australian Urban Observatory
Development of the AUO occurred over several years with the major stages summarised in . This process was based on five major stages as described in : (i) a program of published liveability research with contributions from a team of academics; (ii) development, testing and production of area-based liveability indicators across 21 Australian cities; (iii) development of an open-source digital platform to support research translation, dissemination and analysis; (iv) ongoing development of a system of resources, features and support tools in the digital platform in response to decision-maker’s needs; and (v) ongoing development of new liveability indicators in the portal and replication of existing indicators to support time series analysis. The idea for a digital urban observatory in Australia was conceived during stage 2 when liveability indicators were being developed and based on previous expertise in the development of indicator systems as explained below.
Figure 1. Liveability systems thinking framework and indicator domains included in the Australian Urban Observatory.
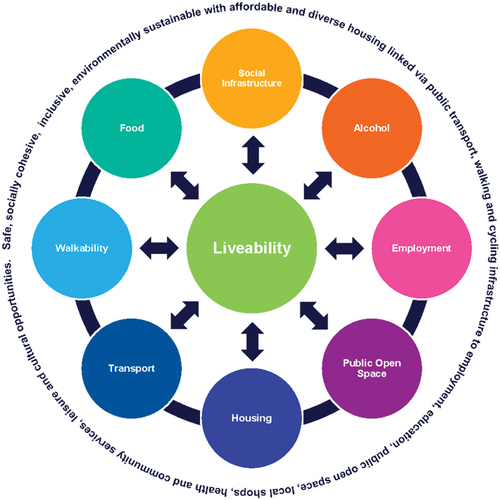
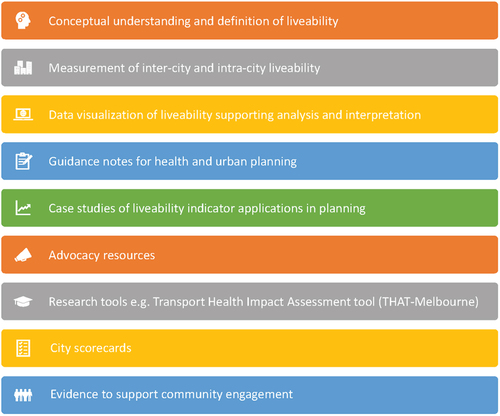
Figure 2. The multiple roles of the Australian Urban Observatory.
Liveability is the conceptual framework and inspiration behind the AUO developed through a program of liveability research and can be understood as the connection between urban planning and the social determinants of health. This conception of liveability is based on extensive review of both academic and grey literature that identified key neighbourhood indicators that support liveable, healthy and sustainable neighbourhoods (Lowe et al. Citation2013, Citation2015). The review addressed growing international and Australian interest on the use of the term ‘liveability’ and the application of evidence-based indicators in policy development. A clear definition of liveability was developed through the review with a liveable place described as: safe, attractive, cohesive and inclusive, environmentally sustainable with affordable public transport, walking and cycling infrastructure, connected to affordable and diverse housing, employment, education and public open space, local shops and services, leisure and culture opportunities (Lowe et al. Citation2013). In short, liveable places consist of three key components – a quality place, linked by active and sustainable transport to local services and amenities. These components of liveability are all influenced by urban planning and also represent the social determinants of health, linking the social environment to health, and the need for research evidence in the development of public policy (Wilkinson and Marmot Citation2003).
Conceptual frameworks and liveability indicator development
Neighbourhood area liveability indicators included in the AUO are based on this definition of liveability (Badland et al. Citation2014) and an extensive body of previously published research. The development of these indicators was also informed by Community Indicators Victoria which was the first state-based indicators system in Australia (Davern et al. Citation2017). Community Indicators Victoria was in operation between 2007 and 2016 and effective in supporting evidence-informed health planning in Victoria through the use of aggregated municipal-level indicators (Browne et al. Citation2017). However, planning, policy and advocacy organisations had expressed the need for more fine-grained analysis of social, economic, and environmental issues specific to local areas. Social and health planners were dealing with local-level health inequities that were masked by aggregated municipal-level results. Consequently, smaller area spatial analyses were trialled using Geographic Information Systems (GIS) to develop neighbourhood or Census tract indicators (Davern et al. Citation2015) to identify neighbourhood-level differences within larger municipalities. These indicators proved useful in detecting local area strengths and weaknesses, facilitating community engagement and discussion, building partnership across organisations and identifying shared priority areas for strategic planning (Davern et al. Citation2020). The model proved worthy of further expansion linking applied research to current policy and planning needs that was mutually beneficial for all partners.
While experimentation with local area indicators occurred in practice, conceptual models of liveability indicators were also being developed and tested over a number of years. This began with a broad understanding of the social determinants and liveability at the local level (Badland et al. Citation2014), and then conceptual models of public open space (Villanueva et al. Citation2015), transport and walkability (Badland et al. Citation2015, Citation2017), employment (Badland et al. Citation2016), housing (Badland et al. Citation2017) social infrastructure (Davern et al. Citation2017) food environments (Murphy et al. Citation2018) and an overall liveability index (Higgs et al. Citation2019). Social Infrastructure, housing, food environments and walkability were also validated using health outcomes data to confirm the connection between the social determinants of health, liveability, urban planning and health outcomes.
Development and validation of these liveability indicators built conceptual knowledge of liveability in Australia, as was also tested in other international cities (Alderton et al. Citation2019, Citation2021). However, this suite of liveability indicators needed to be accessible to decision makers for it to be used in policy and planning. National indicators had been developed but limited to print resources (Arundel et al. Citation2017). Consequently, new customised technology was designed to create an interactive liveability planning platform that would become the AUO. The major objective in creating the digital platform was to communicate and disseminate evidence-informed liveability indicators for the largest cities of Australia that could be easily visualised at the neighbourhood, suburb and municipal levels. Urban environments are a key influence of health and wellbeing, and spatial indicators are critical because this type of measurement is linked to monitoring, reporting, identifying spatial inequities and informing future policy action (De Sa et al. Citation2022).
Whilst developing this granular understanding of individual liveability indicators, our work with the NHMRC-funded Australian Prevention Partnership Centre sought to take a Systems Thinking approach to liveability. This approach provides a framework for the AUO to visualize both the urban system and its component parts. The AUO maps liveability indicators for specific ABS geographies: (i) Local Government Areas (LGA); (ii) Suburbs (SSC); and (iii) Neighbourhoods (SA1). Using scorecards to present a range of liveability domains at the same time was also important to emphasise the interactive and dynamic nature of an urban system.
Development of the Australian Urban Observatory (AUO) digital liveability planning platform
Data-driven digital platforms that support urban governance play an important role in strengthening and fostering a culture of urban experimentation and innovation in sustainability planning (Rehm et al. Citation2021). However, off-the —shelf software can limit the co-creation of new digital support tools that are relevant to a range of target audiences including policymakers and planners. Our approach to software design can be described as end-user software engineering (Ko et al. Citation2011) and was iteratively co-produced understanding the needs of the end-user, from ideation through to design and testing. To be adopted by policymakers it was essential that the platform responded to their needs, was easy to use and not just created for a technical audience. Smart city platforms have previously been criticised as being too techno-centric (Rehm et al. Citation2021). To be successful these platforms need to incorporate holistic and people-driven factors into development to bring together researchers, policymakers and practitioners (Mora et al. Citation2019).
The AUO platform was designed based on three major sources of information: (i) extensive experience working in partnership with policymakers, planners, practitioners, community and advocacy organisations; (ii) product development workshops with these key audiences and academic researchers; and (iii) customized software engineering supporting the development of new tools to support indicator visualisation and application. The aim was to turn social, economic and environmental raw urban data into curated policy-relevant, evidence-informed, neighbourhood-level liveability indicators visualised and disseminated to decision makers through a customised digital platform. The longer-term aim was to support evidence-informed policy development, planning and evaluation of metropolitan and regional city growth across Australia.
A suite of liveability indicators were developed for inclusion in the AUO based on a liveability framework aligned to the conceptual understanding and definition described earlier (Lowe et al. Citation2013, Badland et al. Citation2014). The framework of liveability underpinning the AUO () connects this liveability definition to indicators within an interconnected and dynamic urban system.
AUO geographic coverage
Liveability indicators are calculated for the largest Australian cities. This includes all 8 capital cities and 13 regional cities () and accounts for approximately 70% of the Australian population (State Government of Victoria Citation2017). The cities of Sydney and Melbourne are located in the states of New South Wales and Victoria respectively, with these states home to over 57% of Australia’s population (Australian Government Department of Infrastructure, Transport, Regional Development and Communications Citation2021). The 21 cities included in the AUO are also aligned with the National Cities Performance Framework in Australia responsible for major infrastructure policy, planning and city monitoring (Australian Government Department of Infrastructure, Transport, Regional Development and Communications Citation2021). This Performance Framework also provides city-level indicators that are some of the most appropriate measures for tracking progress on the SDGs (particularly Goal 11) in Australia.
Table 1. Major cities included in the Australian Urban Observatory.
AUO liveability indicators () were calculated for all 21 cities at the geographic areas of Local Government Area (i.e. municipality), suburb, and neighbourhood level. These liveability indicators are currently available for two time periods: 2018 and 2021. The 2018 indicators were made available when the AUO was first launched in February 2020, and the 2021 indicators have been replicated and released across 2022. Liveability indicator results will continue to be replicated every three years to monitor and measure liveability changes within and across cities. This replication schedule also balances the time needed to capture implemented changes to city-based policy and planning, and the resource intensive activity of measuring liveability across 40,000 neighbourhoods, 3100 suburbs and 170 municipalities within the 21 cities of the AUO.
Table 2. Liveability indicators included in the Australian Urban Observatory.
A number of demographic indicators are also planned for release in the AUO in 2023 and will be derived from 2021 and 2016 Census data (State Government of Victoria Citation2017) collected every 5 years in Australia. This adds additional capability to the AUO connecting liveability assessment of place with demographic analysis of the people who reside in those places. Future research will also be supported by linking both liveability and demographic indicators with additional area-based health outcomes indicators to demonstrate health inequities related to decision making and liveability. This includes new health indicators derived from a new 2021 Census question on doctor diagnosed long-term health conditions including cardiovascular disease, diabetes, dementia, cancer, asthma, lung, and mental health conditions.
Geospatial methodology supporting development of AUO liveability indicators
A range of geospatial methodologies support the development of the liveability indicators in the AUO. Initially, this included identification of in-scope geographic areas for the 21 cities defined by the Australian Bureau of Statistics (ABS) including Greater Capital City Statistical Areas and urban areas within Significant Urban Areas for capital cities and regional cities respectively. Mesh Blocks are the smallest unit of aggregated geography used by the ABS and are the building blocks of larger regions in the social geography of the Australian Statistical Geography Standard (Australian Bureau of Statistics Citation2016). These Mesh Blocks were used as the unit of analysis in creation of spatial liveability indicators for all 21 cities included in the AUO to enable accurate and efficient spatial processing across areas.
To generate the indicators, three primary components were required: a set of home locations (residential dwellings); a road network to route through; and set of destination locations to reach. Destination locations are meaningful places people want to reach from their homes, such as public transport stops, supermarkets and public open spaces. In order to better represent the reality of navigating cities on foot, routing between homes and destinations was restricted to the road network, meaning that network distance was used instead of Euclidean distance, which is simpler to calculate, but less accurate (Lu et al. Citation2014). Processing a road dataset into a format suitable for routing is detailed in CitationJafari et al. (2022). In order to make use of network-based routing, homes and destinations were ‘snapped’ to the closest part of the road network.
Two categories of measures were then constructed based on the distances between homes and destinations: density-based measures, which counts the number of destinations within a specific distance (e.g. number of cafes within 800 m); and distance-based measures, which reports the closest destination (e.g. distance to closest bus stop). By combining and analysing these various measures, indicators could then be constructed. For example, the indicator ‘percentage of dwellings within 400 m of a bus stop’ was created by calculating the distance to the closest bus stop for all homes within a Mesh Block (the smallest geographic area defined by the Australian Bureau of Statistics), and then determining which percentage of them had a distance of 400 m or less. Similarly, the indicator ‘average number of off-licences within 800 m’ was created by calculating the number of off-licences within 800 m of each home within a Mesh Block, and then averaging the number.
Results were aggregated to municipality, suburb, and neighbourhood-level using the population-weighted average of the indicators calculated for the Mesh Blocks. Population-based weighting was used instead of area-based weighting to ensure that results accurately reflect the underlying population’s experience, and not just what areas are larger in size.
The workflow for generating these results consists of a set of modular scripts written in the R and SQL programming languages, with the R scripts making use of libraries for manipulating data, interfacing with databases, performing spatial analysis, and calculating routes between homes and destinations. Results from all stages of the workflow were stored within a Postgres database with PostGIS functionality for ease of access and processing.
Capacity building, tools and resources in the Australian Urban Observatory
One of the major objectives of the AUO is the translation of research knowledge into policy and planning practice. The first major challenge to achieving this goal is making people aware of the existence of the AUO and assessment of liveability across Australian cities. Since being launched 3 years ago in 2020, the AUO has been accessed by approximately 40,000 people in 60,000 sessions with 245,000 page views from over 164 countries. The majority of people using the AUO are located in Australia, United States, India, China, United Kingdom, Japan, Saudi Arabia, Canada, Malaysia, Spain and New Zealand. Capacity building, tools and resources, local knowledge and policy uptake are critical to the success of any indicator (Holden Citation2006, Davern et al. Citation2017) or observatory system (Williams Citation1972). The AUO is a system of resources and support on planning liveable and healthy places well beyond dissemination of area-based evidence-informed liveability indicators (as described in ). The project was designed to achieve the following objectives: (i) make research knowledge and evidence available and accessible to decision-makers; (ii) support democratic process by making this knowledge available and accessible to the public; and (iii), bring research evidence into the development, monitoring and evaluation of urban and health policy and planning across Australia. Research evidence is made accessible via a customised digital platform developed with open-source software applications to enable full flexibility for future development and co-designed in response to decision-maker’s needs.
Scorecards and capacity building tools
One of the most frequently accessed resources in the AUO have been city-level Liveability Scorecards (https://auo.org.au/measure/scorecards/). These scorecards provide high-level city-wide results for all nine liveability domains enabling city-to-city (or inter-city) comparison. This is different to the detailed within city (intra-city) liveability assessments according to neighbourhoods, suburbs and municipalities included in the AUO digital map portal. These multiple assessment methods were developed with knowledge of the target audience and varying needs of largely local, state and federal government audiences with policy and planning responsibilities. More members of the target audience sought intra-city comparison with research evidence addressing localised policy issues relating to health, planning and inequities. Caiaffa et al. (Citation2014) has noted a global shortage of capacity analysing intra-urban health issues with neighbourhood-level analysis restricted by data availability, accuracy and mechanisms supporting collation, analysis and dissemination. The AUO has addressed these problems by first trialling the concept (Davern et al. Citation2020) then providing national capability for both inter-city (between cities) and intra-city (within city) liveability linking urban health evidence (observation) and improved understanding to support action across Australia.
Additional scorecards are also being developed to assist with policy implementation and evaluation and have been developed in response to local and state government planning needs In Victoria. Plan Melbourne is the strategic metropolitan planning strategy for Melbourne, the second largest capital city in Australia. The strategy will operate over the next 35 years and liveable local 20-Minute Neighbourhoods are one of nine key principles guiding implementation of the plan (State Government of Victoria Citation2017). In terms of urban design and health, the 20-Minute Neighbourhood principle encourages walking and cycling to local services and a good example of integrated strategic planning promoting health and wellbeing. One of the major barriers to adoption of the principle in planning has been that it can be unattainable if applied literally (Thornton et al. Citation2022) rather than using the principles to encourage policy aspiration. Many local governments have sought assistance in understanding how to measure this key planning principle, so the AUO developed a scorecard template tool to support self-assessment of 20-Minute Neighbourhoods applied at the neighbourhood, suburb or municipal level. The tool and was developed in partnership with local and state government partners in response to planning needs. It also provides another example of how the AUO is translating and linking research evidence from liveability indicators into tools that support policy evaluation and urban planning that promotes health and wellbeing. Guidance notes are also available in the AUO and describe how area-based liveability indicators can be used to support municipal-level public health planning and meet the United Nations Sustainable Development Goals. The tools are designed to support the development of policies that support health and wellbeing planning and promotion, strategic planning, monitoring, evaluation and goal setting, good governance (van Doeveren Citation2011), partnership and advocacy.
Beyond the scorecards and Guidance Notes, the AUO enables capacity building through a range of digital and in-person activities that include: (i) presentations and demonstrations of the AUO and intra-city liveability inequities and digital portal functionality; (ii) Community of Practice events with practitioners, enabling both the sharing of implementation experiences and an opportunity for the AUO to understand issues of immediate importance to our partners; (iii) downloadable advocacy resources to support the use of the AUO by practitioners for infrastructure planning, policy development and deliberative democracy; (iv) regular newsletters advising our users of relevant RMIT research, indicator development and mapping tools; (v) news blog posts to the AUO website; and (vi) social media updates through Twitter and LinkedIn. As members of the RMIT academic community the AUO is also regularly used in urban planning and computer science teaching and research. Finally, the AUO is currently working with the Geography Teachers Association of Victoria to develop curriculum materials for use by teachers and students. The AUO provides a valuable and engaging geospatial teaching resource relevant to Year 7 curriculum on Place and Liveability, Year 9 Geographies of Interconnection and Year 10 Human Wellbeing units.
Impact and policy applications
AUO liveability evidence has been used to shape city-based policy and planning across Australia working in partnership with decision-makers across local, state and federal jurisdictions. Translating research evidence into practice is well aligned with global interest in measuring research impact (Deeming et al. Citation2018) and achieving economic and social benefit from research beyond academia. In Canada, this is reflected through knowledge mobilization policies, while the UK uses the Research Excellence Framework and Australia uses the Excellence in Research Australia with many researchers personally and emotionally committed to research impact (Chubb et al. Citation2017). The AUO was created with the objective to translate applied research and inform public policy by providing evidence that connected four priority issues: local lived environments comprising built and natural environments (Davern et al. Citation2020); the social determinants of health; urban policy and planning (i.e. liveability) and deliberative democracy (Curato et al. Citation2020). Consequently, the AUO has shaped planning policies in cities across Australia. This includes the most populous capital cities of Sydney and Melbourne, regional cities of Victoria and large growth area cities in Australia’s northern state of Queensland. Together, Sydney, Melbourne and South-East Queensland account for approximately 75% of Australia’s population (Australian Bureau of Statistics Citation2022).
National examples of policy and planning impact of the AUO include partnership with the Federal Department of Infrastructure, Transport, Regional Development, Communications and the Arts. City deals are described as place-based partnerships between federal, state and local governments, business and the community (Pill et al. Citation2020). City deal partnerships aim to align planning, investment, job creation and urban renewal to ensure future liveability (Department of Prime Minister and Cabinet Citation2017). The Federal Department of Infrastructure have used AUO liveability indicators, particularly liveability, transport and social infrastructure indicators to identify existing area-based planning gaps and needs for the future. The social infrastructure index (Davern et al. Citation2017) included in the AUO has been of particular interest to the Department for planning new local services in growth areas. The original index included 16 essential societal service types supporting wellbeing and the Department requested separation of the index into 4 major sub-domains: health infrastructure; education infrastructure; community and sport infrastructure; and cultural infrastructure. All of these indicators were used to identify planning needs and future gaps in service provision in growth areas related to city deals. They were also replicated for 2018 indicators and made publicly available to identify social infrastructure planning gaps and changes over time for all cities included in the AUO. Similarly, public transport needs and the impact and benefits of large-scale public transport infrastructure projects have been evaluated using AUO liveability indicators in city deal locations across the time periods of 2018 and 2021.
A state example of AUO policy and planning impact includes partnership with the Victorian government Department of Planning who are using AUO liveability indicators to inform and evaluate ‘Plan Melbourne’ the 30-year strategic plan for the city (Department of Environment, Land Water and Planning Citation2019). Melbourne is predicted to be th e largest city in Australia by 2031 (Centre for Population Citation2022) and the ‘Plan Melbourne’ aims to enhance neighbourhood liveability across the city throughout this period based on the concept of 20-Minute Neighbourhoods (Department of Environment Citation2019) where most important local services are accessible within 800 m or a 10-minute walk. Both 2018 and 2021 AUO liveability indicators are being used to assess key features of 20-Minute Neighbourhoods including walkability, social infrastructure and local services, access to supermarkets and activity centres, density, housing affordability, public transport, public open space and local employment. All of these neighbourhood features affect the way that local residents live, work, play and learn and have direct impact on physical and mental health outcomes. The AUO has even created additional customised liveability indicators for the Victorian government to support additional planning evaluation needs and shaping policy and planning needs across the city.
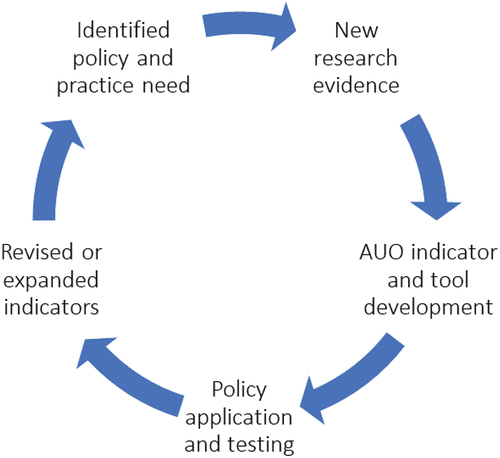
Local Health Districts in New South Wales have also been innovators and early adopters (Kaminski Citation2011) of the AUO and provide a good example of how the AUO is shaping local health planning. These Local Health Districts (LHDs) are responsible for local area health service planning and health promotion activities across the state of New South Wales, currently the most populous state of Australia. LHDs cover large geographic areas and usually include multiple municipalities with service agreements to the state-led New South Wales Ministry of Health addressing broad health planning needs (Merritt et al. Citation2016, Rychetnik et al. Citation2018, Clarke et al. Citation2019). Fifteen LHDs exist across the state of New South Wales and numerous LHDs have partnered with the AUO. Their partnerships have been driven by the need to improve understanding about local area built and natural environment factors and community demographics in place-based strategic health planning. This has already included submissions to local and state government using AUO indicators as evidence to support health promotion. Some of the most popular indicators used by LHDs in health planning have included overall liveability, walkability, access to supermarkets, schools, public open space, public transport, active transport and access to alcohol. Specific examples of how AUO indicators have been used include advocating for improved walking or cycling infrastructure to increase physical activity, using indicator results to advocate against additional alcohol outlets in areas of high alcohol consumption or increased access to shops selling healthy foods. This evidence has helped to build partnerships between health planners and local governments and informed Community Strategic Plans with municipalities and informed liquor licensing submissions, open space planning and advocacy actions. A Community of Practice has also been established between LHD partners of the AUO (covering 30 municipalities of Sydney) to share knowledge and experience about how they are using AUO evidence and resources in strategic health planning and promotion. This is a mutually beneficial practice informing the development of future tools, features and indicators included in the AUO, ensuring policy and practice relevance. It also emphasises the interrelated cyclic nature and co-design in AUO development and expansion over time ().
Figure 3. The cyclic nature of research, policy and practice in development and expansion of the Australian Urban Observatory.
An additional research into practice tool included in the AUO designed for planning practitioners and creating research impact is the Transport Health Assessment Tool for Melbourne (THAT-Melbourne) developed in collaboration with the Victorian Government Department of Transport. The interactive tool is based on a physical activity population-level health impact assessment (Zapata-Diomedi et al. Citation2019) where short car trips are replaced with walking or cycling (Gunn et al. Citation2022). The tool was designed to provide health evidence of the benefits of active transport and support advocacy and planning actions for new walking and cycling infrastructure in communities (Gunn et al. Citation2021). In 2022, THAT-Melbourne was awarded a national research excellence award from the Planning Institute of Australia and has been accessed over 4,500 times since being launched in April 2021. The tool is currently being replicated for the Australian city of Brisbane with plans for replication in other cities included in the AUO.
Journalists have also made use of AUO liveability indicators during analysis of infrastructure and planning policy announcements and community debate supporting democratic decision-making principles. A prime example relates to a federal government policy announcement in 2019 to fund car parks near train stations in marginal electorates that were largely held by the government of that time. Journalists sought AUO walkability and access to transport indicators to cast doubt on the policy decision and demonstrated that 50% of the locations targeted were in highly walkable areas with frequent public transport (Curtis and Wright Citation2021). Other examples include the use of AUO indicators to identify needs and inequities related to health planning and service provision (Nicholas Citation2022) particularly in greenfield development locations common to sprawling Australian cities (Newton Citation2010, Newton and Glackin Citation2014, Kroen and De Gruyter Citation2021).
Lessons learnt and limitations
Development of the AUO was a long-term project that culminated with the launch of a digital portal and access to the public in 2020. However, it required many years of research before this occurred and a similar amount to enable ongoing development and improvement. Funding has been one of the greatest challenges for an urban observatory partnering with government, while simultaneously creating new research and supporting evidence-informed policymaking and planning. Urban observatories cross both research and government sectors, and each sector has unique concerns and limitations. The government sector is concerned about the changing policy environment, the need for quick responses, timelines, trust, and political implications of negative results. In contrast, researchers operate with limited funding and resources, complex or missing urban datasets across multiple jurisdictions, negotiations with data custodians and large area spatial analysis (e.g. over 40,000 neighbourhoods included in the AUO). Respectful, realistic, and open relationship management has been essential to overcoming these challenges and essential to developing the AUO as an observatory that responds to the needs of the decision-makers that it has been targeted at. This has also been supported by decision to use of open-source software in the digital platform development. Including commercial software might have been more cost effective in the early stages of the project, but it wouldn’t have supported iterative and user-informed development. It also would have increased operational costs and required users to have access to associated proprietary software and licensing. The AUO being located in a university has also been helpful with computer science student projects focusing on usability research that has resulted in improved usability and design.
The AUO was developed to improve health and liveability using evidence-informed policy and planning with community engagement but ongoing sustainability and funding were also priority concerns. This resulted in the development of a hybrid model of access to liveability indicators which has proved successful to date. All liveability indicators are available free to the public at the Local Government Area or municipal area-level in all 21 cities included in the AUO. In addition, the overall Liveability Index and social infrastructure indicators are also freely available at the detailed suburb and neighbourhood levels to encourage investigation of local liveability and support community access. Remaining indicators at the suburb and neighbourhood levels require financial contribution to the AUO to support ongoing development of new indicators and features. This not-for-profit sustainability approach was a leap in faith in the beginning of the AUO but has proven itself to be a successful hybrid approach. Additional research funding supports staff salaries and ongoing development activities, and has been a benefit of being located in a university setting.
An additional challenge of working with government partners is tracking the impact of the AUO in organisations where privacy and public scrutiny is a concern. Web analytics help to understand the reach of the AUO but documenting policy application has often been restricted to the availability and release of public documents. This is an ongoing challenge and ongoing engagement with policy partners important to determine ‘hidden’ policy impact. Future research directly aimed at understanding research impact will be an important activity for the AUO or any newly established urban observatory in the future.
Transferability of the AUO liveability framework and application is another topic of future interest with urban observatories of interest to government and researchers across the world. This has already been tested in additional international contexts and proven successful in both Thailand and Japan. The Australian liveability definition provides a useful place to begin from with customisation according to the specific context, culture and country. Bangkok has been the city of focus in Thailand (Alderton et al. Citation2019, Citation2021), while the Smart Cities Institute of Japan has been working with federal and municipal governments across Japan to apply a modified liveability model across Japan.
Summary and conclusion
This paper introduces the Australian Urban Observatory, the first national-level urban observatory measuring liveability of Australian cities certified by the UN-Habitat Global Urban Observatories network. The AUO includes a comprehensive suite of aggregated, place-based urban liveability indicators linked to the Sustainable Development Goals, social determinants of health and urban planning. Like many other urban observatories across the globe, the AUO employs digital infrastructure and derived indicators to generate transdisciplinary insights, engage with decision-makers and mobilize knowledge on urbanisation (Acuto et al. Citation2021, Miller et al. Citation2021). In Australia, the AUO was developed to translate research evidence to improve observation, understanding about inequities, and action through policy, planning and advocacy to create equitable, sustainable, healthy and liveable places. Bi-directional and authentic partnership (e.g. ) between researchers and decision-makers guides AUO development. It is based on responsive technological innovation, small area liveability indicators and time series monitoring have been critical components of early success of the AUO.
Urban observatories are built on the growing interest in the connection between place, health and urban design. These relationships are well established (McCormack et al. Citation2014, Kärmeniemi et al. Citation2018, Frehlich et al. Citation2021) and transdisciplinary (Stokols et al. Citation2013, Pineo et al. Citation2021) research models and spatial planning (UN Habitat Citation2021) are necessary to address the complex relationships between cities and health. The way we plan, build and design cities is an important determinant of individual health and global environments (Barton and Tsourou Citation2013) and easy-to-use tools provide a critical link between policy and research evidence and knowledge mobilization into policy and practice (Fudge et al. Citation2020). Liveability indicators included in the AUO are representative of transdisciplinary research and aim to support integrated policy and planning development across policy portfolios and enhance deliberative democracy. Importantly, indicators developed with consideration for health also provide evidence to strengthen urban governance and support health equity (Corburn and Cohen Citation2012). The AUO model will continue to grow and expand over time with additional indicators, tools and features that are co-designed in response to the needs and applications of decision-makers.
Disclosure statement
No potential conflict of interest was reported by the authors.
Additional information
Funding
Notes on contributors
Melanie Davern
All authors are based within the Centre for Urban Research at RMIT University in Melbourne Australia where the Australian Urban Observatory is located. Research in the Centre for Urban Research focuses on dynamic interdisciplinary research of global importance to cities that are liveable, equitable and sustainable.
Notes
1. auo.org.au.
References
- Acuto, M., et al., 2021. Mobilising urban knowledge in an infodemic: Urban observatories, sustainable development and the COVID-19 crisis. World development, 140, 105295. doi:10.1016/j.worlddev.2020.105295.
- Alderton, A., et al., 2019. What is the meaning of urban liveability for a city in a low-to-middle-income country? Contextualising liveability for Bangkok, Thailand. Globalization and health, 15 (1), 1–13. doi:10.1186/s12992-019-0484-8.
- Alderton, A., et al., 2021. Measuring and monitoring liveability in a low-to-middle income country: a proof-of-concept for Bangkok, Thailand and lessons from an international partnership. Cities & health, 5 (3), 320–328. doi:10.1080/23748834.2020.1813537.
- Amati, M., Freestone, R., and Robertson, S., 2017. “Learning the city”: Patrick Geddes, exhibitions, and communicating planning ideas. Landscape and Urban planning, 166, 97–105. doi:10.1016/j.landurbplan.2016.09.006.
- Arundel, J., et al., 2017. Creating liveable cities in Australia. Melbourne: RMIT University.
- Ashton, J.R., 2000. Public health observatories—the key to timely public health intelligence in the new century. Journal of epidemiology & community health, 54, 724–725. doi:10.1136/jech.54.10.724.
- Aspinall, P.J., Jacobson, B., and Castillo-Salgado, C., 2016. Establishing and sustaining health observatories serving urbanized populations around the world: scoping study and survey. European journal of public health, 26 (4), 681–686. doi:10.1093/eurpub/ckw007.
- Australian Bureau of Statistics. 2016. Australian Statistical Geography Standard (ASGS): volume 1 - main structure and greater capital city statistical areas. (cat. no. 1270.0.55.001).
- Australian Bureau of Statistics, 2022. Count of persons by State and territory. Census: Population. 2021.
- Australian Government Department of Infrastructure, Transport, Regional Development and Communications. 2021. Review of the National Cities Performance Framework - Final Report. Canberra ACT.
- Badland, H., et al., 2014. Urban liveability: emerging lessons from Australia for exploring the potential for indicators to measure the social determinants of health. Social science & medicine, 111, 64–73. doi:10.1016/j.socscimed.2014.04.003.
- Badland, H., et al., 2015. The development of policy-relevant transport indicators to monitor health behaviours and outcomes. Journal of transport & health, 2 (2), 103–110. doi:10.1016/j.jth.2014.07.005.
- Badland, H., et al., 2016. Conceptualising and measuring spatial indicators of employment through a liveability lens. Social indicators research, 127 (2), 565–576. doi:10.1007/s11205-015-0978-6.
- Badland, H., et al., 2017. Examining associations between area-level spatial measures of housing with selected health and wellbeing behaviours and outcomes in an urban context. Health & place, 43, 17–24. doi:10.1016/j.healthplace.2016.11.003.
- Bannan, T.J., et al., 2022. Monitoring and Understanding Urban Transformation: a Mixed Method Approach. Frontiers in sustainable cities, 3, 3. doi:10.3389/frsc.2021.787484.
- Barton, H. and Tsourou, C., 2013. Healthy urban planning. Routledge.
- Booth, C., 1893. Life and labour of the people in London/Vol.4, the trades of East London. London: Macmillan.
- Brakefield, W.S., et al., 2020. Implementing an Urban public health observatory for (near) real-time surveillance for the COVID-19 Pandemic. Studies in health technology and informatics, 275, 22–26. doi:10.3233/shti200687.
- Browne, G.R., Davern, M., and Giles-Corti, B., 2017. What evidence is being used to inform municipal strategic planning for health and wellbeing? Victoria, Australia, a case study. Evidence & policy: A journal of research, debate and practice, 13 (3), 401–416. doi:10.1332/174426416X14655655062000.
- Caiaffa, W.T., et al., 2014. Developing a conceptual framework of urban health observatories toward integrating research and evidence into urban policy for health and health equity. Journal of Urban health-bulletin of the New York academy of medicine, 91 (1), 1–16. doi:10.1007/s11524-013-9812-0.
- Castillo-Salgado, C., 2015. Developing an academia-based public health observatory: the new global public health observatory with emphasis on urban health at Johns Hopkins Bloomberg school of public health. Cadernos de saude publica, 31 (Suppl 1), 286–293. doi:10.1590/0102-311x00132914.
- Centre for Population, 2022. 2022 population statement. Canberra, Australia: Australian Government.
- Chubb, J., Watermeyer, R., and Wakeling, P., 2017. Fear and loathing in the academy? The role of emotion in response to an impact agenda in the UK and Australia. Higher education research & development, 36 (3), 555–568. doi:10.1080/07294360.2017.1288709.
- Clarke, L., et al., 2019. Direct access colonoscopy service for bowel cancer screening produces a positive financial benefit for patients and local health districts. Internal medicine journal, 49 (6), 729–733. doi:10.1111/imj.14149.
- Corburn, J. and Cohen, A.K., 2012. Why we need urban health equity indicators: integrating science, policy, and community. PLoS medicine, 9 (8), e1001285. doi:10.1371/journal.pmed.1001285.
- Curato, N., et al., 2020. Deliberative democracy in the age of serial crisis. International political science review, 43 (1), 55–66. doi:10.1177/0192512120941882.
- Curtis, K. and Wright, S. 2021. Corruption watchdog coming as car parks drive more questions. The Sydney Morning Herald. Available from: https://www.smh.com.au/politics/federal/corruption-watchdog-coming-as-car-parks-drive-more-questions-20210725-p58cnb.html
- Davern, M., et al., 2017. Best practice principles for community indicator systems and a case study analysis: how community indicators Victoria is creating impact and bridging policy, practice and research. Social indicators research, 131 (2), 567–586. doi:10.1007/s11205-016-1259-8.
- Davern, M., et al., 2017. Using spatial measures to test a conceptual model of social infrastructure that supports health and wellbeing. Cities & health, 1 (2), 194–209. doi:10.1080/23748834.2018.1443620.
- Davern, M., et al, 2020. Australian Urban Observatory. RMIT University. Online resource. https://doi.org/10.25439/rmt.12380576.v1. Available from: www.auo.org.au
- Davern, M., et al., 2020. How can the lived environment support healthy ageing? A spatial indicators framework for the assessment of age-friendly communities. International journal of environmental research and public health, 17 (20), 7685. doi:10.3390/ijerph17207685.
- Davern, M., Buckley, P.D., and Bucello, P., 2020. Indicators supporting public health, partnership, liveability and integrated planning practice: the case study of the Cardinia Shire growth area in Melbourne, Australia. In: Community Quality-of-Life Indicators. Springer, 115–135.
- Davern, M., Gunn, L., and Roberts, R. 2015. Living in Boroondara: Using Indicators to Assess Areas and Promote Healthy Communities. Melbourne, Victoria: University of Melbourne.
- Deeming, S., et al., 2018. Measuring research impact in medical research institutes: a qualitative study of the attitudes and opinions of Australian medical research institutes towards research impact assessment frameworks. Health research policy and systems / BioMed Central, 16 (1), 28. doi:10.1186/s12961-018-0300-6.
- Department of Environment, L., Water and Planning, 2019. 20-minute neighbourhoods: creating a more liveable Melbourne. Melbourne, Victoria: Victorian Government.
- Department of Prime Minister and Cabinet, 2017. Delivering City Deals. Canberra Available from: https://www.infrastructure.gov.au/sites/default/files/migrated/cities/city-deals/files/City-Deal-Process-factsheet.pdf
- De Sa, T.H., et al., 2022. Urban design is key to healthy environments for all. The Lancet Global Health, 10 (6), e786–787. doi:10.1016/S2214-109X(22)00202-9.
- Dobler, G., et al., 2021. The urban observatory: a multi-modal imaging platform for the study of dynamics in complex urban systems. Remote sensing, 13 (8), 1426. doi:10.3390/rs13081426.
- Frehlich, L., et al., 2021. Association between neighborhood built environment and health-related fitness: a systematic review protocol. Jbi evidence synthesis, 19 (9), 2350–2358. doi:10.11124/jbies-20-00354.
- Fudge, C., Grant, M., and Wallbaum, H., 2020. Transforming cities and health: policy, action, and meaning. Cities & health, 4 (2), 135–151. doi:10.1080/23748834.2020.1792729.
- Geddes, P., 1919. Beginnings of a survey of Edinburgh. Scottish geographical magazine, 35 (8), 281–298. doi:10.1080/00369225.1919.10749978.
- Goist, P.D., 1974. Patrick Geddes and the city. Journal of the American Institute of planners, 40 (1), 31–37. doi:10.1080/01944367408977444.
- Gunn, L., et al., 2021. Helping planners understand health benefits through the Transport Health Assessment Tool for Melbourne (THAT-Melbourne). Planning News, 47 (5), 23.
- Gunn, L., et al., 2022. Including health impacts in transport modelling and economic appraisal: a partnership project between. Melbourne: RMIT University and the Victorian Department of Transport.
- Hemmings, J. and Wilkinson, J., 2003. What is a public health observatory? Journal of epidemiology and community health, 57 (5), 324–326. doi:10.1136/jech.57.5.324.
- Higgs, C., et al., 2019. The Urban liveability index: developing a policy-relevant urban liveability composite measure and evaluating associations with transport mode choice. International journal of health geographics, 18 (1), 1–25. doi:10.1186/s12942-019-0178-8.
- Holden, M., 2006. Urban indicators and the integrative ideals of cities. Cities, 23 (3), 170–183. doi:10.1016/j.cities.2006.03.001.
- Hunter, D.J., Fulop, N., and Warner, M., 2000. From “Health of the Nation” to “Our Healthier Nation”. In: Policy Learning Curve Series. Copenhagen: World Health Organisation, Regional Office for Europe.
- Irwin, W.P., 1972. The Urban Observatories: Groping about in a new chemistry. Urban affairs quarterly, 8 (1), 21–34. https://doi.org/10.1177/107808747200800103
- Jafari, A., et al., 2022. Building the road network for city-scale active transport simulation models. Simulation modelling practice and theory, 114, 102398. doi:10.1016/j.simpat.2021.102398.
- Kaminski, J., 2011. Diffusion of innovation theory. Canadian journal of nursing informatics, 6 (2), 1–6.
- Kärmeniemi, M., et al., 2018. The built environment as a determinant of physical activity: a systematic review of longitudinal studies and natural experiments. Annals of behavioral medicine: a publication of the society of behavioral medicine, 52 (3), 239–251. doi:10.1093/abm/kax043.
- Ko, A.J., et al., 2011. The state of the art in end-user software engineering. ACM Computing Surveys (CSUR), 43 (3), 1–44. doi:10.1145/1922649.1922658.
- Kroen, A. and De Gruyter, C., 2021. Development contributions for regional and state infrastructure–a case study of Melbourne, Australia. Urban policy and research, 39 (2), 157–174. doi:10.1080/08111146.2020.1816542.
- Lowe, M., et al., 2013. Liveable, healthy, sustainable: what are the key indicators for Melbourne neighbourhoods? Research Paper 1, Place, Health and Liveability Research Program, University of Melbourne.
- Lowe, M., et al., 2015. Planning healthy, liveable and sustainable cities: how can indicators inform policy? Urban policy and research, 33 (2), 131–144. doi:10.1080/08111146.2014.1002606.
- Lu, B., et al., 2014. Geographically weighted regression with a non-Euclidean distance metric: a case study using hedonic house price data. International journal of geographical information science, 28 (4), 660–681. doi:10.1080/13658816.2013.865739.
- McCormack, G.R., et al., 2014. Subpopulation differences in the association between neighborhood urban form and neighborhood-based physical activity. Health & place, 28, 109–115. doi:10.1016/j.healthplace.2014.04.001.
- McGreevy, M., et al., 2020. How well do Australian government urban planning policies respond to the social determinants of health and health equity? Land use policy, 99, 105053. doi:10.1016/j.landusepol.2020.105053.
- Meller, H., 2005. Patrick Geddes: social evolutionist and city planner. London: Routledge.
- Merritt, T. et al., 2016. Effect of antiviral prophylaxis on influenza outbreaks in aged care facilities in three local health districts in New South Wales, Australia, 2014. Western Pacific surveillance and response journal: WPSAR, 7(1), 14.
- Miller, H.J., et al., 2021. Urban sustainability observatories: leveraging Urban experimentation for sustainability science and policy. Harvard data science review. doi:10.1162/99608f92.2025202b.
- Mora, L., Deakin, M., and Reid, A., 2019. Combining co-citation clustering and text-based analysis to reveal the main development paths of smart cities. Technological forecasting and social change, 142, 56–69. doi:10.1016/j.techfore.2018.07.019.
- Murayama, Y. and Murayama, Y., 2000. Study of Urban Systems: Outcomes and Issues. Japanese Urban System, 9–33.
- Murphy, M., et al., 2018. Local food environments, suburban development, and BMI: a mixed methods study. International journal of environmental research and public health, 15 (7), 1392. doi:10.3390/ijerph15071392.
- Newton, P., 2010. Beyond greenfield and brownfield: the challenge of regenerating Australia’s greyfield suburbs. Built environment, 36 (1), 81–104. doi:10.2148/benv.36.1.81.
- Newton, P. and Glackin, S., 2014. Understanding infill: towards new policy and practice for urban regeneration in the established suburbs of Australia’s cities. Urban policy and research, 32 (2), 121–143. doi:10.1080/08111146.2013.877389.
- Nicholas, J. 2022. Australia’s Doctor Deserts: see how your suburb compares in access to healthcare. The Guardian. Available from: https://www.theguardian.com/australia-news/datablog/2022/jun/27/australias-doctor-deserts-city-fringes-lag-behind-centres-in-healthcare
- Pill, M., et al., 2020. Strategic planning, ‘city deals’ and affordable housing. Melbourne, Australia: Australian Housing and Urban Research Institute.
- Pineo, H., et al., 2021. A new transdisciplinary research model to investigate and improve the health of the public. Journal of health promotion international, 36 (2), 481–492. doi:10.1093/heapro/daaa125.
- Rahnama, M.R., Wyatt, R., and Shaddel, L., 2020. A spatial-temporal analysis of urban growth in Melbourne; Were local government areas moving toward compact or sprawl from 2001–2016? Applied geography, 124, 102318. doi:10.1016/j.apgeog.2020.102318.
- Rehm, S.V., McLoughlin, S., and Maccani, G., 2021. Experimentation platforms as bridges to urban sustainability. Smart cities, 4 (2), 569–587. doi:10.3390/smartcities4020030.
- Rychetnik, L., Sainsbury, P., and Stewart, G., 2018. How Local Health Districts can prepare for the effects of climate change: an adaptation model applied to metropolitan Sydney. Australian health review, 43 (6), 601–610. doi:10.1071/AH18153.
- State Government of Victoria, 2017. Plan Melbourne 2017-2050. Melbourne, Victoria. Available from: https://www.abs.gov.au/statistics/people/population/national-state-and-territory-population/mar-2020#key-statistics
- Stevenson, M. and Gleeson, B., 2019. Complex Urban Systems: compact cities, transport and health. In: M. Nieuwenhuijsen and H. Khreis, eds. Integrating human health into urban and transport planning: a framework. Cham: Springer International Publishing, 271–285.
- Stokols, D., et al., 2013. Transdisciplinary public health: definitions, core characteristics, and strategies for success. In: D. Joshu and T.D. McBride, eds. Transdisciplinary public health: research, methods, and practice. San Francisco, USA: Jossey-Bass Publishers, 3–30.
- Thornton, L.E., et al., 2022. Operationalising the 20-minute neighbourhood. The international journal of behavioral nutrition and physical activity, 19 (1), 15. doi:10.1186/s12966-021-01243-3.
- UN-Habitat, 2020a. A guide to setting up an urban observatory.
- UN-Habitat, 2020b. World cities report 2020: the value of sustainable Urbanization. Nairobi, Kenya: United Nations Human Settlements Programme (UN-Habitat).
- UN Habitat, 2021. Integrating health in urban and territorial planning.
- UN-Habitat, 2022. Global Urban Observatories. Available from: https://unhabitat.org/programme/global-urban-observatories
- United Nations, Department of Economic and Social Affairs, Population Division, 2019. World Urbanization Prospects: The 2018 Revision (ST/ESA/SER.A/420). New York: United Nations.
- United Nations Development Program, 2015. Sustainable Development Goals. Available from: https://www.un.org/sustainabledevelopment/sustainable-development-goals/
- van Doeveren, V., 2011. Rethinking good governance. Public integrity, 13 (4), 301–318. doi:10.2753/PIN1099-9922130401.
- Villanueva, K., et al., 2015. Developing indicators of public open space to promote health and wellbeing in communities. Applied geography, 57, 112–119. doi:10.1016/j.apgeog.2014.12.003.
- Wilkinson, R.G. and Marmot, M., 2003. Social determinants of health: the solid facts. 2nd ed. World Health Organization. Regional Office for Europe. https://apps.who.int/iris/handle/10665/326568
- Williams, L.A., 1972. The Urban Observatory Approach: a decade of conceptual ization and Experimentation. Urban affairs quarterly, 8 (1), 5–20. doi:10.1177/107808747200800102.
- Zapata-Diomedi, B., et al., 2019. Physical activity-related health and economic benefits of building walkable neighbourhoods: a modelled comparison between brownfield and greenfield developments. The international journal of behavioral nutrition and physical activity, 16 (1), 11. doi:10.1186/s12966-019-0775-8.