
ABSTRACT
Systematic Social Observation provides supplementary information about the micro-scale neighborhood environment. This study explored the feasibility of neighborhood audits for the first time in the city of Limassol, Cyprus (population size, 2021 census: 258.900). The prevalence and variability of audited features were investigated using the 126-item CyNOTes inventory, organised along a typology of 17 domains. Two independent audits, with a repeat in two weeks, were performed across 30 randomly selected street segments, stratified in three groups of neighborhoods according to the educational attainment of residents. Associations with census indicators and survey data on SF-36 Quality of Life among residents aged 45–64 (N = 150) were explored. More adverse conditions were recorded in low educational attainment neighborhoods, with differences apparent in domains with generally high as well as low scores. Neighborhood scores correlated with census indicators of the built environment, while negative correlations where observed with sociodemographic indicators, such as population aged over 65 and non-Cypriot population, suggesting social inequities. In neighborhoods with more adverse features, lower physical and mental health-related quality of life were reported. Overall, the study documented environmental inequity. CyNOTes offers the potential for further development and scaling-up for public health research, policy, and advocacy.
Introduction
The socio-physical and socio-economic context of the neighborhood environment can positively or negatively impact the health of citizens either directly or indirectly (Saelens and Handy Citation2010, James et al. Citation2016,Papadopoulos and Twaddle Citation2016). Various community assessment methods can be used to profile communities, all with strengths as well as shortcomings. Traditionally, area-level indicators or composite indices of socio-economic deprivation or disadvantage are used to profile communities, advocate for better community conditions, and guide resource allocation. Even though such indices have a long history elsewhere in Europe (Guillaume et al. Citation2015, Middleton et al. Citation2018), there are no generally accepted measures of the area measures of socioeconomic disadvantage in Cyprus.
More importantly, such area-level single indicators or composite indices, often originating from census or other routine data sources, are not truly ecological. With some exceptions that may represent the macro-scale residential environment (e.g. population density, median household income, crime rates, etc.), these indicators commonly reflect the socio-demographic composition of a community’s residents rather than actual features of the neighborhood environment itself. Similarly, other approaches, such as GIS measures, are restricted to capturing specific features pertaining to the built, rather than social environment, often at the meso-scale (defined as environmental features at the neighborhood-level), such as traffic density, land use diversity, destinations, street connectivity etc. (Kim et al. Citation2014). As such, they do not capture important features of the microscale environment. Micro-scale environment is defined as features at the street rather than neighborhood level, such as presence and width of sidewalks, obstructions and barriers for walkability, street lighting, trees, gardens, graffiti, and other physical evidence of physical disorder etc.) (Kim et al. Citation2014). A different approach is resident surveys, whereby aggregated measures of residents’ perceptions are used either targeted or opportunistically to characterize the community environment. While these are versatile and can refer to features of the built environment, such as walkability, or the psycho-social environment, such as trust and reciprocity, they are subjective (Mujahid et al. Citation2007, Augusta et al. Citation2012).
Unlike other European countries, availability of good-quality geospatial information is not extensive in Cyprus. In fact, the use of GIS rarely features in Public Health research in Cyprus. More importantly, the concept of ‘Place’ itself is not reflected on the Public Health agenda and, thus, it is rarely considered in Public health discussions as an issue of citizens’ well-being. An audit study will allow the depiction of variability and explore the social gradient in the residential environment within the city. It is of note that the term ‘social gradient’ in social epidemiology refers to the universal and systematic phenomenon of inequality, whereby progressively, often linear albeit with varying steepness, worse performance (of individuals, population groups, or communities) is observed along the socio-economic disadvantage continuum (which itself can be operationalised in various ways, commonly using various proxy indicators both at the individual and/or community level). Thus, the term may refer to health outcomes (e.g. mortality, morbidity, well-being, quality of life) and other outcomes (e.g. educational performance, quality of healthcare services) as well as their determinants (e.g. smoking, physical activity, healthcare access and opportunity), including differing neighborhood environment (i.e. environmental inequity).
There is a need for the integration of methodological approaches in profiling the neighborhood environment in the context of a better understanding of the context of health inequalities at the local level. Observer-based audits have been proposed as an alternative. Systematic social observation, as a research method, was defined by Alber J. Reiss, Jr. (1971) as a measure independent of the perceptions of survey respondents and can tap into aspects of the social and physical environment that survey respondents have difficulty describing accurately (Reiss (1971) as cited in Sampson and Raudenbush (Citation1999)).
In the context of neighborhood assessments, this commonly takes the form of a field audit, whereby researchers walk or drive (termed, windshield surveys) through an area of interest and records their observations on a standard form or inventory. Even though these approaches do not replace other community assessment methods, they hold the potential to provide useful supplementary information, which in combination with other approaches would provide a more comprehensive neighborhood profile. One of the first studies to use SSO for community assessment was the landmark ‘Project on Human Development’, also known as the Chicago neighborhood study (Sampson and Raudenbush Citation1999). In recent years, a number of neighborhood audit tools have been developed for observer-based audits either in-field or even virtually with the use of geospatial tools, such as Google Street view. Two published reviews have identified as many as 44 tools (with items ranging from 5 to 241), the vast majority originating from cities in the US, and less so from Europe (Schaefer-McDaniel et al. Citation2010, Nickelson et al. Citation2013). Some of these tools are generic (Knapp et al. Citation2016), while others focus on specific features, such as the pedestrian environment (Clifton et al. Citation2007). This field of research continues to grow rapidly with more recent studies originating from several settings in North America, Europe, and Asia (Millstein et al. Citation2013, Alfonzo et al. Citation2014, Bethlehem et al. Citation2014, Malecki et al. Citation2014, Sallis et al. Citation2015, Milam et al. Citation2016, Kepper et al. Citation2017, Lafontaine et al. Citation2017, Poortinga et al. Citation2017). Many of the tools have interesting acronyms, such as EPOCH (Chow et al. Citation2010), COURAGE (Quintas et al. Citation2014), MAPS (Millstein et al. Citation2013), WASABE (Malecki et al. Citation2014), SPOTLIGHT (Bethlehem et al. Citation2014), CUBEST (Su et al. Citation2014), CANVAS (Bader et al. Citation2015), CASCADDE (Knapp et al. Citation2016).
The cultural-specificity of different urban environments (i.e. North American Vs European Vs Mediterranean cities) raises questions as to the transferability of audit tools. Both the prevalence as well as perceived importance of features for a ‘healthy neighborhood’ may be country- or even city-specific. Hence, there is a need to assess the cross-national transferability, field test and tailor such tools to the local environment. This study contributes to the literature since, beyond testing the performance of an audit tool in the urban environment of a Cypriot city, it employs an iterative methodology for assessing several metric properties of a tool. While previous similar studies explore aspects of reliability of measurement, such as inter- and intra-rater agreement, this study employed multi-validation procedures in an iterative way. The series of analyses presented tap on different aspects of reliability and validity, namely known-group (social gradient), criterion (census data), construct (clustering) and predictive validity (health-related Quality of Life).
It was beyond the scope of this study to operationalize the multidimensionality concept of a ‘Healthy Neighbourhood’ and no audit tool can comprehensively capture the construct. The concept of a ‘Healthy Neighbourhood’ is a multidimensional (e.g. in terms of the built, physical, service, psycho-social and cultural domains) and multifaceted (e.g. in terms of objective observation versus subjective lived experience). Furthermore, the mechanisms by which aspects of the neighborhood environment are linked to health are complex and not always easy to unpack as they are commonly synergistic, and involve direct pathways as well as indirect, both through socio-behavioural pathways (e.g. an adverse environment promotes, hinders, or sustains adverse health-related behaviours) and psycho-social pathways (e.g. differential exposure, vulnerability, or outcomes as result of social inequity and sustain exposure to stressful environments) (Diez-Roux and Mair Citation2010). It is not the intention of the study to provide a comprehensive profile of the urban neighborhood environment of Limassol or to investigate the degree of socio-geographical inequality and unpack the place-health association (the social gradient in health).
Aim
The purpose of the study was to assess the feasibility of neighborhood audits in the urban environment of a Cypriot city for the first time. This methodological study is embedded in a wider Quality of Life community survey (Ellina et al. Citation2021). The study aimed to develop and field test an audit tool with the purpose of depicting the degree of variability in the residential environment within the city of Limassol (based on existing neighborhood audit tools) and assessing the inequity that might exist along the socio-economic disadvantage continuum (as indicated by the educational attainment of residents as a proxy to classify neighborhoods). Towards this purpose, the extent to which the observed variability in the residential environment displays a ‘social gradient’ is an indication of ‘known-group’ validity. Given the cultural-specificity of such audit tools, the objectives were to (a) use and adapt an audit tool, capitalizing on similar tools in the literature, to assess its metric properties (intra and inter-rater agreement), (b) profile a diverse set of the city’s neighborhoods and assess the prevalence and variability of health-related micro-scale features across Limassol urban neighborhoods, (c) depict the social gradient in the urban neighborhood environment, (d) assess the correlation with a wider set of census-based indicators (criterion validity) as well as (e) health-related Quality of Life among a sample of residents (predictive validity).
Methods
Study setting
The metropolitan area of Limassol consists of 7 municipalities with a population size of 235,300 as per 2011 census and 258,900 as per 2021 census (official statistics, https://www.cystat.gov.cy/en). Limassol is further divided for administrative and census purposes into 38 city quarters (median population 3894, IQR: 434-6169) and 124 postcodes (median population 1320, IQR: 798-2014), with significant variability in terms of both population size as well as their socio-demographic profile. In the absence of a composite index or a generally accepted indicator of socio-economic deprivation or disadvantage, the percentage of the adult population with tertiary education (2011 census) was used to place neighborhoods along the continuum of socioeconomic disadvantage. This ranges substantially across city quarters from a low of 2.9% in the parish of Jedi Mosque, Municipality of Limassol (also the smallest quarter in population size) to 38.9% in Agios Georgios Frangoudis, Municipality of Agios Athanasios. At the postcode level, this ranges from 2.9% to 52.2% (Median: 21.1%, IQR: 15.0%–29.4%).
Area-level indicators (i.e. single variables) and indices (e.g. composite measures) of deprivation or socio-economic disadvantage are commonly used to quantify geographical inequalities or assess independent area effect on health over and above individual socioeconomic position (e.g. multilevel studies). In Cyprus, there are no generally accepted composite Socioeconomic Disadvantage (SED) indices. It is only recently that research studies have started to look into the development and validation of a small-area index of socioeconomic deprivation for Cypriot communities and its association with the spatial distribution of all-cause premature adult mortality (Lamnisos et al. Citation2019). In this study, educational attainment is used as a proxy to stratify and place neighborhoods on the socio-economic continuum. Educational attainment is one of the most commonly used indicators in both Cyprus as well as a component in several SED composite indices at the European level (Middleton et al. Citation2018).
Sampling
Fifteen street addresses were chosen to be audited that were previously sampled as part of set of 45 street addresses included in the Quality of Life study (Ellina et al. Citation2021). The original set of sampled addresses were randomly selected among all addresses listed in official post-office files while applying two criteria: (a) each located in a different city quarter, across all municipalities for maximum geographical coverage and (b) stratified by three groups of neighborhoods, classified according to the proportion of adult residents with tertiary education as per the 2011 census to represent the continuum of sociodemographic disadvantage (<15%, lowest quartile, ∼20%, and >30%, highest quartile). In the first instance, three times larger number of street addresses were sampled using the above criteria, which were then subsequently mapped and narrowed down to purposefully exclude any streets that were in close proximity to main roads or other focal points in the city (e.g. waterfront promenade).
For the purposes of the present study, in addition to the first set of street addresses (N = 15), an additional neighboring street (N = 15) was audited in each case to double the sample of audited streets with limited resources. The final set of audited streets (N = 30) were homogeneous in that they were located in local residential neighborhoods and did not pertain to central roads or were in immediate proximity to any major roads or focal points. The boundaries of the street to be audited were set a priori as the full length of the selected street segment from start to finish, past any intersections (average 250 m, IQR: 150-300), considering both block faces.
Audit tool
The bulk of items for the first draft of CyNOTes (Cyprus Neighborhood Observation Tool for auditing urban community environments) were sourced from two generic audit tools, namely the 140-item Healthy Environments Partnership’s Neighborhood Observational Checklist – HEP NOC (Zenk et al. Citation2007) and the 98-item St Michael’s Neighborhood Observation Data Collection Tool (Parsons et al. Citation2010), after permission was granted by the authors. Repetitive items were identified and the face validity of each item in terms of relevance to the urban environment of a Cypriot city was discussed and debated among the research team. It was deemed necessary to adapt or slightly modify a number of items, mainly in terms of wording either in the stem and/or the response set, while items not considered relevant by consensus were not included. A number of other commonly used feature-specific audit tools were consulted in the process of making modifications, such as the Irvine-Minnesota Inventory (Boarnet et al. Citation2006) on the built environment as related to physical activity, PEDs scan (Clifton et al. Citation2007) for the pedestrian environment and NIfETy (Furr-Holden et al. Citation2008) for physical and social disorder.
The first draft of CyNOTes consisted of 123 items, purposefully organized into 8 sections to facilitate the audit starting from more general aspects to more specific features, namely: A. General land use, B. General environment, streets and sidewalks, C. Services and Amenities, D. Residential land use, E. Non-residential land use, F. Parks, playgrounds, and other public spaces, G. People and H. Incivilities. Items in CyNOTes require the auditor either (1) to note the presence or absence of certain features (Yes/No) and/or (2) give a rating on a 4- or 5-point response scale in terms of the condition (e.g. maintenance of residential buildings, parks, and public spaces), quality (e.g. pavements and paved roads) or frequency of certain features (e.g. window security bars, traffic flow, rubbish, etc). A number of items are in the form of checklists (e.g. marking all features that are present in the neighborhood or people’s activity and behaviour), commonly serving the purpose of more detailed profiling if relevant without necessarily forming part of an aggregate score. In the first instance, a pre-set typology based on Nickelson et al. (Citation2013) was used to capture an overall neighborhood profile and CyNOTes items were matched to this typology by consensus, as shown in the relevant table (Supplementary Table S1). The first draft of CyNOTes appears in full in Supplementary Material file 2. The typology consists of 21 thematic domains, after the inclusion of Social Disorder which was not explicitly considered by Nickelson et al. (Citation2013). However, for score calculation purposes, some domains were subsequently merged with conceptually similar domains or not considered due to small number of items, resulting in a total of 17 domains.
Data collection procedure
To evaluate the reliability of the measurement, two trained auditors rated the selected neighborhoods independently of each other and blinded as per the socio-economic status of that postcode (intra-rater agreement). One of the auditors returned to the neighborhood two weeks later for the second assessment (inter-rater agreement). For neighborhood profiling, the ratings of the second assessment were used, since a number of modifications in the item and/or response scale wording were made between the two assessments. The audit was performed on foot using paper and pencil. Auditors were asked to walk the full length of the selected street segment to observe the general area before filling the first section of the tool, and then walk back-and-forth as many times as necessary to observe more closely the detailed featured to fill the next sections of the tool. Finally, the auditors were asked to fill in the last sections about ‘People and Incivilities’ based on their overall experience and observations while in the area. Auditors were also asked to document in a general section at the end of the overall experience, any interaction or reaction of residents and, more importantly, to note which items were difficult to assess and why in order to inform necessary changes (e.g. misleading or ambiguous wording, inappropriate response scale, additional features or aspects that seemed important or relevant but not covered by any of the items on the tool etc). The start and finish time were recorded, as well as the starting and finishing point of the specific audited street in order to calculate the approximate length in Google maps. All observations were collected between 4:00 PM and 7:00 PM during daylight hours during the same month (March). Audits required 30–40 min to complete. Although considered standard practice in similar studies elsewhere, no photographs were taken during the audit visits in this study, as per the ethical approval of the study protocol.
Data for Health-related Quality of Life of residents originated from the original community survey (Ellina et al. Citation2021). This was a door-to-door survey which included a sample of residents aged 45–64 from 45 neighborhoods, 15 of which are the neighborhoods audited here (N = 150, 15 per street, with 50:50 gender quota). Health-related Quality of Life in the original study was measured using the widely used SF-36 questionnaire, which provides a summative score for physical and mental components of quality of life.
Data analysis
The prevalence of each audited feature across neighborhoods was calculated as the frequency (proportion) of occurrence across the response set of each item. To assess the observed variability in each item across audited neighborhoods, the Index of Qualitative Variation (IQV)) was estimated. This is a measure of dispersion for categorical variables. It is based on the ratio of the total number of differences in the distribution to the maximum number of possible differences within the same distribution. It varies from 0 to 1 (or 0% to 100%) with higher numbers indicating maximal variation (equal spread over all possible categories in the response set i.e. evenly distributed). Items with IQV>80% were considered to show high variation, 50–80% moderate and 20–50% low. Items with IQV less than 20% were considered to exhibit very low variation across audited neighborhoods. The observed lack of variability in certain features, either due to floor or ceiling effects, was identified, discussed, and debated in terms of their suitability.
To assess the reliability of measurement for each item and/or stability over time, both intra-rater (i.e. test-re-test a week apart) and inter-rater agreement (i.e. between two different auditors) were calculated for each item. Exact agreement and kappa scores were calculated. As there were numerous ordinal variables, a weighted kappa score of agreement (and equivalently % weighted agreement) was also calculated giving more weight to adjacent responses and progressively less weight/zero to those further away/opposite ends of the scale. Kappa score adjusts the observed agreement for agreement occurring by chance. Score > 0.60 and > 0.80 is commonly considered to indicate substantial to high agreement, respectively, 0.4-0.59 moderate, 0.2-0.4 low, and <0.2 very little agreement (Sim and Wright Citation2005). Often low kappa scores can be seen, even though agreement is quite high; for example, in items with low variability or floor/ceiling effect. Thus, prevalence-adjusted kappa scores % agreement (uncorrected for chance agreement) were used in parallel to assess the reliability (Boarnet et al. Citation2006).
Internal consistency of items within pre-set domains was calculated using Cronbach’s alpha coefficient. For each neighborhood, a summative score of items was calculated for each of the 17 domains, expressed in all cases on a 0–100 scale for comparability, with higher scores suggesting more favourable features. Summary statistics (mean, median, SD, IQR) and Spearman’s correlation coefficient between domains were calculated. One-way ANOVA as well as Kruskal–Wallis tests were used to assess differences in CyNOTes domain scores and depict the social gradient across the three types of neighborhoods defined by educational attainment. Neighborhood composite profiles were constructed using cluster analysis of all CyNOTes domain scores and the magnitude of differences in Health-related Quality of Life by neighborhood profiles were assessed using one-way ANOVA.
The association between summary domain scores and other census-based area-indicators of the built environment or socio-demographic composition was also assessed by calculating Pearson and Spearman correlation coefficients. Namely, the indicators used were: % population over 65+, % houses built prior 1980, % non-Cypriot population, % single-parent households, % apartment blocks/mixed use, % vacant/for demolition units. The data were publicly available at city quarter (enoria) and postcode level from the 2011 census, Cyprus Statistical Services. The 2021 census data were not available at the time of the study, and due to COVID-19-related delays they have still not been released to this date.
Ethical issues
The study protocol was approved by the Departmental Postgraduate Studies Committee and the Cyprus National Bioethics Committee (EEBK EΠ 2018.01.131). There was no participation of individuals at any stage of the present study while the SF-36 data reported here originated from a previously completed Quality of Life survey approved by the Cyprus National Bioethics Committee (ΕΕΒΚ ΕΠ 2016.01.49). Although photographic material is a common feature in similar field audits, the approved protocol for the present study ensured that no photographic material would be taken in order to avoid the likelihood of people featuring unintentionally without their consent and/or putting the field researcher in the vulnerable position to justify the activity during potential interactions with residents and/or identification or labelling of specific neighborhoods. While not keeping a photo archive deprives the opportunity of creating a photo-indexed Guide to standardize the training and evaluation process in the future, any ethical considerations were considered more important at this stage.
Results
The first CyNOTes draft consisted of 123 items tapping on features of the physical, built and social environment. The prevalence of each audited feature was calculated for all three audits (main and repeat). Most of the CyNOTes items (78%) exhibited high (IQV>80%) or at least moderate (IQV = 50-80%) variability across the audited streets according to the Index of Qualitative Variation (IQV). Supplementary Table S3 presents a summary of the observed variability across audited items (first audit), organized according to the different sections of the tool. An example of an item with high variability (IQV = 96.9%) was the ‘frequency of litter’ which was recorded as: none in 36.7%, a little/light in 26.7%, some in 20% and a lot/heavy in 16.7% of the audited streets. An example of moderate variability (IQV = 73.2%) was ‘street traffic’ which varied as follows across audited streets: No traffic or very light in 63.3%, Light or Occasional in 16.7%, Moderate in 13.3%, Heavy in 6.7% and Very heavy in 0.0% of cases. Twenty-four items showed low (IQV = 20–50%) or very low (IQV < 20%) variability; nevertheless, these items were not excluded from further analysis due to their conceptual importance. Very low variability across audited neighborhoods was due to either floor (i.e. featuring in none or nearly none of the audited streets) or ceiling effects (i.e. featuring in all or nearly all). Very low IQV items due to floor effects were: speed reducing measures (IQV = 0.0), pedestrian crossings (IQV = 0), advertisements of unhealthy products (IQV = 0), vandalism (IQV = 0.0), misbehaving teenagers (IQV = 0), misbehaving children (IQV = 0), misbehaving adults (IQV = 12.9), greenbelts trails or paths (IQV = 12.9), bicycle facilities (IQV = 8.6), bikeability rating (IQV = 12.9), drinking alcohol (IQV = 12.9) and loud music (IQV = 12.9). Very low IQV items due to ceiling effects were: sidewalks on both sides of the street (IQV = 12.9) and sidewalk continuity (IQV = 12.9).
With a few exceptions, most items showed at least moderate intra- (in a 2 week-period) and inter-rater (between the two auditors) agreement. Supplementary Table S4 presents a summary of the intra- and inter-rater agreement, with a focus on items with poor (20%–40%) or very poor (<20%) agreement. In terms of the intra-rater agreement, the large majority of items showed high agreement, especially when weighted rather than exact agreement was considered. Only a small number of items (N = 5) showed poor intra-rater agreement. In one case, namely ‘parking arrangements’, this could be justified due to possible temporal variability between audits, while for the other four items (namely, neighborhood markers, security bars – residential or commercial, and vacant/undeveloped lots), unclear definitions may have contributed; thus further clarifications were provided for these items according to the auditors’ free comments. In terms of inter-rater agreement, the exact agreement was generally higher for items recording presence vs absence of features, rather than items with a more subjective response scale (e.g. condition of houses, residential grounds, street surfaces, sidewalks, public spaces, vacant lots). Nevertheless, inter-rater agreement appeared much improved when weighted agreement was considered. Agreement was poor for 15 items. For five (N = 5), this could be attributed to possible temporal variability between audits, namely, parking arrangements, parking violations, piles of garbage, barking dogs, and renovations. For the other ten items (N = 10), low agreement was attributed to problematic definitions and/or unclear instructions. No items were removed and the necessary clarifications were provided to improve the reliability of measurement.
Supplementary Table S1 shows the arrangement of the 123-CyNOTes items in the domain typology as classified by consensus for the purposes of the calculation of composite scores, along with a definition of each domain. Eighteen items referred to general auditing questions (i.e. mode of transportation, weather conditions, similarity of streets in wider neighborhood) or non-ordinal checklist items for the purposes of further profiling (e.g. park and playground occupants, people’s activity, etc.), and hence were not considered in the calculation of composite scores. For three of the typology domains, a composite score was not computed since they consisted of only one or two items (namely, neighborhood identification, views/enclosure and steepness). Barriers (two items) and Sidewalks (four items) were combined into a single domain. Furthermore, a separate domain for Social Disorder (six items), not included in the published typology was added. Finally, at the analysis stage, six items were excluded due to problematic coding and/or low internal consistency with the rest of the items in their domain.
Overall, 94 of the CyNOTes items were included in the calculation of 17 domain composite scores, ranging from 3 to 10 items. Only five items were considered in more than one domain, namely (1) ‘Predominant type of residential housing’ in both Architecture & Building Characteristics and Land Use, (2) ‘Decoration and external beautification features’ in both Architecture & Building Characteristics and Maintenance & Appearance, (3) ‘General area attractiveness’ in both Architecture & Building Characteristics and Landscape & Nature features, (4) ‘Obstructions for walkability’ in both Sidewalks & Barriers and Pedestrian Environment, (5) ‘Obstructions for bikeability’ in both Sidewalks & Barriers and Cycling Environment.
presents Cronbach’s alpha coefficients for internal consistency of the items by domain as well as summary statistics of the 17 composite scores. With the exception of four domains, namely amenities for outdoor public spaces (α = 0.50), ethnic identification (α = 0.42), signs/messages (α = 0.44) and smell, pollution, noise (α = 0.29), the other domains showed acceptable internal consistency across the items that comprise them. The highest alpha coefficients between items were observed for architecture and building characteristics (α = 0.87, 10 items), landscape & nature features (α = 0.91, 4 items), maintenance & appearance (α = 0.83, 10 items), physical disorder (α = 0.79), public spaces & recreational use (α = 0.78) and social disorder (α = 0.75). The remaining domains showed moderate internal consistency (0.50-0.70); however, all items were retained since removing any items did not result in a meaningful improvement of the internal consistency. Supplementary Table S5 presents bivariate Spearman correlation coefficients between domain scores. The strongest correlations were observed between maintenance and appearance with architecture and building characteristics (ρ = 0.82), parking & driveways with maintenance & appearance (ρ = 0.71), parking & driveways and architecture & building characteristics (ρ = 0.64), while the safety domain (referring to lack of security-related features) was strongly negatively correlated with architecture & building characteristics (ρ =-0.71) and maintenance and appearance (ρ =-0.70).
Table 1. Summary statistics (original and transformed 0–100 range, with lower scores reflecting adverse features) and Cronbach’s alpha coefficient for internal consistency by domain.
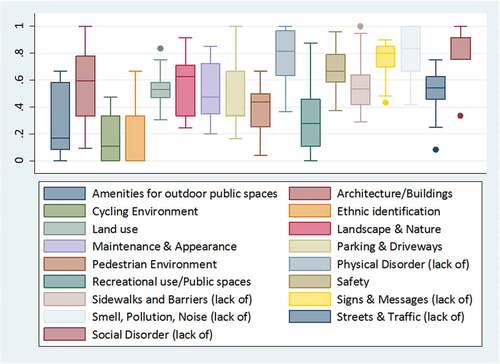
presents the distribution of scores for all 17 domains across the 30 audited neighborhoods. Even though a direct comparison across domains should be avoided, it should be noted that the three domains with generally higher scores were: absence of social disorder (6 items), absence of smell, pollution & noise (6 items) and absence of physical disorder (10 items). Generally, lower scores were recorded for amenities for outdoor public spaces (4 items), public spaces and recreational uses (6 items), cycling environment (3 items), pedestrian environment (8 items) and ethnic identification (3 items). There was wide variability between audited neighborhoods in nearly all domains. A notable exception was lack of social disorder for which most neighborhoods scored relatively high, with not much variability. The domains with the largest variability were: architecture and building characteristics, landscape and nature features and maintenance and appearance.
Figure 1. Box-plots of the observed range and distribution of domain scores across audited neighborhoods.
There was evidence of a social gradient in most domains. presents differences in median domain scores across the three groups of neighborhoods classified according to the educational attainment of adult residents. More adverse conditions were generally recorded in neighborhoods with lower education attainment across all domains with a few exceptions. As also portrayed graphically in , there was a stepwise pattern of higher scores in several domains across increasing educational attainment even if observed differences were not always statistically significant (p-value for trend<0.10 in at least half of the domains). Safety features (in this case, tapping on security-related features such as CCTV cameras, security bars etc.) was the exception, as these features were more prevalent in higher education neighborhoods.
Figure 2. Radial plot profiles of observed differences in domain scores across three groups of neighborhoods stratified by the educational attainment of the residents.
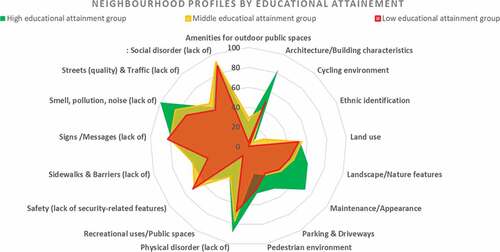
Table 2. Differences in CyNOTes domain summary scores across neighborhood groups according to educational attainment.
A social gradient was apparent in domains for which neighborhoods scored relatively high (e.g. lack of physical disorder) as well as in domains for which neighborhoods generally scored low (e.g. recreational/public spaces). Across the three groups of neighborhoods, differences appeared larger in terms of resident-related features i.e. appearance and maintenance of residential buildings, rather than public-related infrastructure, which tend to be equally low across the board. Good quality sidewalks, condition of streets, and other publicly controlled features are not the most defining features of lower vs higher Socio-economic Status (SES) neighborhoods. On the other hand, better quality housing; private gardens, etc. are more defining features in the higher SES neighborhoods. In contrast, safety-related features, such as alarm systems, security bars, and higher fences around private residences are more likely to be found in higher SES neighborhoods.
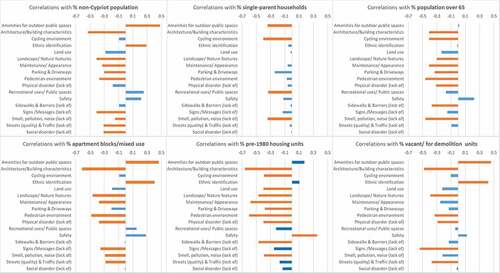
The criterion validity of the tool was further assessed in terms of the correlation with other census-based indicators. The strongest correlations were observed with indicators of the built environment, such as the proportion of older built dwellings (pre-1980), the proportion of vacant or demolition houses and the proportion of blocks or mixed-use units. graphs the Spearman’s correlations coefficients between each of the census-based indicators (at postcode level) and each of the CyNOTes domains. Correlations higher than 0.3 or −0.3 are depicted in the Figure, and in bold those which were statistically significant. There were negative correlations between several domains and census indicators reflecting the sociodemographic composition of an area, such as the proportion of population over 65 and proportion of non-Cypriot population, suggesting more adverse experience for certain population groups; further supporting the criterion validity of the tool. Interestingly, correlations with % single-person households did not seem to follow the same pattern – see . Unlike most CyNOTes domains, safety (which nevertheless focuses on lack of security-related features) showed positive correlations with most census indicators of socio-economic disadvantage. It is also indicative to note that ethnic identification (measuring signs of ethnic diversity, other than Cypriot or Greek) showed positive correlations with postcode-level proportion of non-Cypriot population, as well as proportion of apartment blocks, mixed-used buildings, and vacant/for demolition housing units.
Figure 3. Correlations between CyNOTes domain scores and select census-based community indicators across audited neighborhoods.
In terms of the health-related quality of life (as measured by SF-36 among 10 residents per audited neighborhood in a previous community-based study), there was clear evidence of a social gradient across the three groups of neighborhoods defined by differing educational attainment levels. Specifically, there was a statistically significant increase of 2.41 (95% CI 0.81, 4.01; p-valued for trend < 0.001) and 1.70 (95% CI 0.25, 3.16; p-value for trend = 0.22) points in the physical and mental component score of the SF-36, respectively, across the three groups of neighborhoods, not shown in detail. There was also evidence of effect modification by gender (p = 0.04 and 0.03 for physical and mental quality of life), with larger differences observed among female residents in the magnitude of 4.5 (95% CI 2.1, 6.8) and 3.0 (95% CI 0.8, 5.2) for physical and mental quality of life, respectively, which is considered clinically significant on the SF-36 scale. To facilitate a comparison of health-related quality of life between neighborhoods with differing micro-environment profiles, cluster analysis was performed to classify the audited neighborhoods based on all domain scores. The analysis revealed two profiles of neighborhoods – see . The first group consisted of neighborhoods with generally more adverse conditions in most domains, namely, quality of housing, pedestrian environment, physical and social disorder; however, not in terms of the presence of public spaces and outdoor amenities which did not appear to be a discriminatory feature between neighborhoods with more or less favourable conditions. In contrast, neighborhoods with generally more favourable features tended to score lower in terms of safety-related features. The first cluster consisted of neighborhoods with generally higher socio-economic disadvantage, as also attested by the observed statistically significant difference in terms of the proportion of adult residents with tertiary education. A comparison of SF-36 quality of life scores of residents between neighborhoods with more adverse vs more favourable features revealed statistically significant differences in both physical (48.0, SD 8.9 vs 50.7 SD 7.2, respectively; p = 0.05) as well as mental (48.3 SD 7.9 vs 50.9 SD7.2; p = 0.04) health-related quality of life, with larger differences recorded among female residents – see .
Table 3. Classification of audited neighborhoods according to CyNOTes domain scores along with observed differences in proportion of adult population with tertiary education and SF-36 health-related Quality of Life scores.
Discussion
Main findings
CyNOTes showed good metric properties in profiling the variability in the urban neighborhood environment in Cyprus for the first time. While this study was based on a small sample of neighborhoods, statistically significant differences were observed along the socio-economic disadvantage continuum, depicting quantifiable evidence of the social inequity in the Cypriot neighborhood environment. In terms of domains, lower scores were observed in terms of built features (e.g. cycling & pedestrian environment) and public services & infrastructure (e.g. parks & recreational use). With the exception of security-related features, more adverse conditions were generally recorded in neighborhoods with low educational attainment. Differences were apparent in domains with generally high (e.g. lack of physical disorder) or generally low scores (e.g. existence of recreational and public spaces). Observed associations of several CyNOTes domain scores with both census-based area indicators support the criterion validity of the tool. The study also showed differences in health-related physical and mental quality of life among residents aged 45–64 in the cluster of neighborhoods with more adverse conditions.
Limitations
This feasibility study field-tested the audit tool, as well as the process of auditing itself, in the urban environment of a Cypriot city for the first time. The process assisted in guiding the further development of the CyNOTes tool. Limited resources and time (two audits, two weeks apart) were a drawback. As a result, it was decided to restrict the assessment of the neighborhood to the 15 randomly selected streets as well as only one of its adjacent streets. A number of audited streets were located in more central parts of the city (generally, more disadvantaged) and hence, by default, in closer geographical proximity to commercial centres or public spaces (e.g. squares, waterfront promenade) and/or destinations (e.g. shops and other facilities). In contrast, generally more privileged areas tend to be located in more peripheral areas. Nevertheless, other than this heterogeneity, which was necessary for the purposes of the study, all of the audited streets segments were homogeneous in that they were all located in local residential neighborhoods and did not pertain to central or major roads. It should also be acknowledged that using 2011 census data is a limitation. It cannot be assumed that there haven’t been changes that would have affected the classification of neighborhoods in the period between census years. Nevertheless, the classification into three groups used here is very broad (<15%, around 20% and>30% of adult residents with tertiary education). A further consideration is that the Quality of Life data do not refer to all age-groups but specifically to residents aged 45–64 (late working life). The reason behind the choice of this particular age-group is explained in the original survey (Ellina et al. Citation2021). Briefly, merging two diverging theories about the trajectory of health inequalities by age (namely ‘cumulative disadvantage/advantage’ and ‘age as a leveller’), this is the age-group more safely assumed to show differences according to both hypotheses.
The majority of items in the first draft of the CyNOTes tool were mainly based on US- or Canada-based tools. Therefore, some of the items might not be as culturally relevant while, similarly, other features of a Cypriot neighborhood environment that would have been more appropriate might have been missed out. This became apparent during the participatory process of assessing the cultural appropriateness of the tool in focus groups (not presented here), which resulted in a number of additional items being added to the updated version of CyNOTes, including cultural manifestations of a positive, rather than negative, social environment. Commonly, previous tools tend to include negative aspects of the social environment, such as drinking alcohol in public or delinquent behaviours, which were not prevalent features in this study. Perhaps a better measure of a positive social environment may be evidenced by socializing activity among neighbors on front terraces, or open front doors, a typical feature in more traditional Cypriot neighborhoods.
Furthermore, even though the two auditors received initial training and worked independently from each other, the fact that they did not have a standard manual is a limitation. Commonly, audit tools are supplemented by a training manual that contains a list of definitions for features to be assessed, a glossary of terms, and often but not always, photographic material which accompanies the response set of all or some of the items to be assessed. This is especially relevant in the case of rating scales e.g. what constitutes poor to excellent housing maintenance or condition of sidewalks etc. The ethical approval precluded us from using the opportunity of the pilot study to develop a photographic manual. Future implementations need to standardize the training and assessment, especially if more auditors might need to be involved in the process.
Development of the tool
As this was the first application of a new audit tool in a new setting, it was important to assess its metric properties, beyond the standard assessment of inter- and intra-rater agreement. Thus, this methodological study was designed to incorporate the assessment of aspects of the validity of the tool, not always included in similar studies. The sampling scheme from a diverse set of neighborhoods along the socio-economic disadvantage continuum was specifically chosen in order to assess the known-group validity of the measure based on the extent to which it captures the social inequity in the neighborhood environment. Furthermore, unlike many similar studies, the present study assessed the criterion validity of the measure against census-based are-level indicators as well as the predictive validity of the tool in identifying meaningful differences in the health-related Quality of Life among a sample of residents. Nevertheless, it should be noted that the study design and the descriptive analysis does not allow any casual inferences to be drawn. Other than the fact that the cluster analysis shows a tendency for the cluster of neighborhoods with a more adverse profile of features to be more socio-economically disadvantage, any observed differences in quality of life cannot be attributed to the actual quality of the neighborhood environment without also controlling for individual-level social status and other characteristics.
Assessing inter- and intra-observer reliability (Paquet et al. Citation2010, Andresen et al. Citation2013, Freitas et al. Citation2013, Bethlehem et al. Citation2014, Malecki et al. Citation2014, Su et al. Citation2014, Milam et al. Citation2016, Scribner et al. Citation2018) is common practice when developing an objective community assessment tool. Similar to this study, most studies involve a pair or more independent auditors (Chaudhury et al. Citation2011, Poortinga et al. Citation2017) and/or provide prior training (Paquet et al. Citation2010, Poortinga et al. Citation2017). For example, the study by Malecki et al. (Citation2014) used inter-rater reliability exploring the percentage agreement across segments rated by the auditors within a week of one another aiming to assess comparability and reproducibility across a number of different pairs of raters (Malecki et al. Citation2014). The study by Bethlehem et al. (Citation2014) also performed inter-rater and intra-rater reliability procedures, even though in this case these were performed virtually by two auditors independently from each other. In the case of intra-observer reliability, the virtual audit was performed twice by the same auditor with ten-days lag between the two audits to reduce recall bias. Like in our study, they found that both intra- and inter-observer reliability showed a high degree of agreement with a few exceptions, such as Litter and ‘Graffiti’ for intra-observer reliability, possibly due to the higher temporal variability of such features, and for inter-observer reliability ‘Aesthetics’ and ‘Land use mix’, which may be more subjective and/or dependent on definitions used.
This study also assessed construct, criterion and predictive validity. Further development should focus on assessing content validity with the involvement of stakeholders adopting a participatory approach. In the literature, a range of approaches to assess content validity have been employed (Parsons et al. Citation2010, Paquet et al. Citation2010, Chaudhury et al. Citation2011, Shareck et al. Citation2012, Gullón et al. Citation2015). Some studies use additional qualitative observations (Chaudhury et al. Citation2011) while other studies employ focus groups with expert panels to deduct ‘reflective indicators’ of latent constructs. Examples included constructs postulated to relate to smoking (Shareck et al. Citation2012); or the role of social interactions with residents (et al. Citation2010).
Criterion validity is also operationalized differently across studies; for example, using the Walk-Score to explore positive correlations with overall neighborhood quality scores (Knapp et al. Citation2016, Adu-Brimpong et al. Citation2017). Other studies assessed known-group construct validity (Leung et al. Citation2010, Taylor et al. Citation2012, Malecki et al. Citation2014, Gullón et al. Citation2015, Knapp et al. Citation2016, Lafontaine et al. Citation2017). For example, the study by Taylor et al. (Citation2012) assessed physical activity-promoting environments in more affluent neighborhoods. The study by Malecki et al. (Citation2014) investigated the prevalence and density of features across strata formed according to several sociodemographic and urbanicity factors (Malecki et al. Citation2014). Lastly, some studies assessed the predictive validity by exploring associations with a health outcome (Leung et al. Citation2010, Boarnet et al. Citation2011, Leonard et al. Citation2011, Alfonzo et al. Citation2014, Su et al. Citation2014, Sallis et al. Citation2015, Poortinga et al. Citation2017); for instance, associations with physical activity and obesity data (Alfonzo et al. Citation2014) or walking (Boarnet et al. Citation2011); or total energy intake and physical activity levels (Leung et al. Citation2010) depending on the specific aspect of neighborhood environment the audit tool was assessing. In this study, a general measure of well-being, such as health-related quality of life, was deemed preferable.
Social gradient in the neighborhood environment
CyNOTes captured the inequity in the urban neighborhood environment in the city of Limassol. As expected, a social gradient of more adverse features in the neighborhood environment was observed in neighborhoods with lower educational attainment. A number of studies in the literature have taken a similar approach in validating the audited tool through exploring the social gradient in the residential environment (Malecki et al. Citation2014, Marco et al. Citation2017). For instance, the study by Marco et al. (Citation2017) assessed correlations between the neighborhood factor scores and socioeconomic and criminality area indicators. The study indicated that the neighborhood conditions were highly correlated with area indicators of socioeconomic disadvantage, such as lower neighborhood education level and lower cadastral property (Marco et al. Citation2017). In addition, the study by Malecki et al. (Citation2014) investigated the prevalence and density of neighborhood features across strata formed according to several sociodemographic and urbanicity factors (Malecki et al. Citation2014). Higher prevalence of non-residential destinations and sidewalk density were observed in lower SES/high EHI census block groups. The cluster of neighborhoods with generally worse features in several domains were not necessarily worst-off in terms of public spaces, amenities, and street quality – possibly because they might be more socio-economically disadvantaged but they tend to be closer to the city centre (Malecki et al. Citation2014, p. 8). In fact, this is not a rare finding in the literature, even though studies have suggested that disadvantaged areas may have more ‘quantity’ but not necessarily ‘quality’. This is also reflected in this study where neighborhoods with lower educational attainment did not necessarily score lower scores in terms of amenities and public spaces, most likely because they also tend to be located in or closer to the city-centre. Finally, it should be mentioned that, while social disorder was not frequent in terms of direct observable behaviours (i.e. misbehaving), it can be inferred from indirect physical evidence, e.g. more garbage, more dog droppings, more abandoned vehicles, more parking violations in neighborhoods with lower educational attainment.
CyNOTes addition to the literature and implications for future research
CyNOTes is a generic tool which aims to tap on many domains without the intention to focus on specific domains, such as land use, walkable streets or public spaces. Such audit tools are commonly used in Public Health research and policy to operationalize some aspects of the residential environment, either for descriptive purposes (e.g. to depict environmental inequity, such as here) or explore the association between certain neighborhood features and outcomes of interest. For urban planning and neighborhood regeneration purposes, there are much more sophisticated methods and tools, for example LEED-ND (Leadership in Energy and Environmental Design for Neighborhood Development (Smith Citation2015). This comprehensive rating and certification system includes measurable indicators and standards for neighborhood design, integrating principles of sustainable health-supporting urban design, Other than urban policy, it has also been used extensively within a research-context and lends itself to a detailed and focused investigation of the health impact of urban design. For instance, in terms of walkability, the system organizes design elements related to physical activity into nine categories, namely, connectivity, land use, density, traffic safety, surveillance, parking, experience, greenspace, and community (Zuniga-Teran et al. Citation2016). While a valuable direction for future studies, this approach goes beyond the purposes of the present work.
CyNOTes can provide a snapshot, even if sub-optimal, of the residential environment. In the literature, there is a variety of neighborhood audit tools. Similarly to this study, previous studies (Caughy et al. Citation2001, Dunstan et al. Citation2005, Parsons et al. Citation2010) have developed generic audit tools tapping on features of the physical, built, and social environments. However, many audit tools tend to be more feature-specific, tapping on certain qualities of the neighborhood environment that more directly relate to a particular health issue, such as obesity, diabetes or hypertension. For instance, studies may be focusing on environmental aspects that encourage physical activity (Boarnet et al. Citation2006), such as the pedestrian infrastructure and walkability (Pikora et al. Citation2002) or bikeability (Clifton et al. Citation2007). Other studies are interested on the impact of the neighborhood environment on mental health outcomes; therefore, they may focus on social environment features related to social cohesion, collective efficacy, and physical disorder (Milam et al. Citation2016). Finally, a number of studies focus on issues related to a specific population group, such as improvement of quality of life among senior population (Chaudhury et al. Citation2011) or safe routes to school for children (Adkins et al. Citation2012).
The reviews of Schaefer-McDaniel et al. (Citation2010) and Nickelson et al. (Citation2013) identify a large range of existing tools, even though these seem to mainly originate from a small set of urban settings. Nevertheless, they provide an opportunity for researchers to identify a ‘core’ group of properties that are universal while also exploring which aspects and features may be more country- and setting-specific to ‘tailor’ and culturally adapt audit tools.
CyNOTes is adding to the literature an objective and valid generic tool suitable for the Cypriot-urban physical, built, and social environment. There are plans for the tool to be developed further and tested across a larger sample of urban neighborhoods in Cyprus. It may also be adapted for use, through a structured process of cultural adaptation, in other urban settings in the Eastern Mediterranean, which may share similar features to Cypriot cities. Audit tools do not replace other community needs assessment methods, but can provide useful supplementary method to allow a more comprehensive profiling of a community. This will allow planning and implementation of relevant neighborhood regeneration programs and the formulation of targeted measures and interventions based on the actual observable needs of the community. However, the most important anticipated benefit of the study is in terms of advocacy. The tool will offer citizens, either as individuals or as organized groups a means by which to showcase systematically and comparatively the needs of their own community.
An indication of the growing interest in neighborhood audits is the fact that a review on the topic has identified 13 studies which used virtual neighborhood assessment methods (Charreire et al. Citation2014). Unlike other European cities, a virtual walk-through using Google Street View is currently not possible for any of the Cypriot cities. Nevertheless, the possibility of carrying out neighborhood assessments remotely offers great potential for scaling-up this method. In recent years, several more audit tools have been developed since the last published reviews.
As the first version of CyNOTes mainly included items from similar audit tools developed elsewhere, further development of the tool is needed to assess its content validity and cultural appropriateness both (a) with regard to the items already included in the tool as well as (b) further items that might need to be incorporated. Further validation of the tool in terms of its convergent validity has been planned using the residents’ perceptions of the quality of their neighborhood environment. For this purpose, the ‘Place Standard’ tool developed by NHS Scotland (Scottish Government Citation2017) will be used in a door-to-door survey in a larger sample of audited neighborhoods. The Greek-translated version of the tool has already been validated, after permission from the developers, in the context of an online island-wide survey (Kleopa et al. Citation2022). In addition, further content validation of the CyNOTes is planned adopting a participatory approach in structured workshops and focus groups with residents, Municipality officials, urban planners, public health inspectors and other community professionals or stakeholders.
Furthermore, while it was important for the purposes of this field study to sample heterogenous neighborhoods in terms of educational attainment, future studies may alternatively compare neighborhoods, which are similar in terms of their socio-economic profile, but vary in terms of their physical and spatial attributes. Future research would also need to gauge the effect of certain elements and characteristics of the neighborhood environment on health and well-being; however, much larger multi-level studies would be required in order to adjust for the confounding effect of both area-level and individual-level socio-economic and behavioural characteristics. Other interesting concepts to explore include level of home ownership and stability of tenure in the neighborhood, which may be associated both with health and well-being community indicators but also impact on residents’ attachment and identification with the neighborhood, which in turn may impact the physical attributes of place.
Conclusion
This community-based study evaluated the feasibility, reliability, and validity of a comprehensive and systematic approach for community audits. This is the first study to depict the health-related environment of the Cypriot urban neighborhood. Alongside more traditional approaches, such as census-based indices, GIS measures, quantitative residents’ perceptions surveys and qualitative studies, CyNOTes can provide a more comprehensive neighborhood profile and, thus, more accurately assess the neighborhood characteristics and their association with community health. This is aligned with the WHO Healthy Cities movement, which is promoting the integration of such methodological approaches in profiling a neighborhood in the context of better understating health inequalities at the local level.
Community health and health inequalities are not prominent features in the public health debate in Cyprus. By providing the first quantifiable evidence of the unequal experience of citizens, it is expected that the study will trigger and widen the conversation among the local research community and policy-makers alike with regard to the wider social determinants of health, and the role of the neighborhood environment in promoting health and health-related behaviours. The main achievement is the CyNOTes tool itself, which offers the potential for scaling-up in the context of community needs assessment and health surveys in an integrated, systematic and comparative approach. Furthermore, future development and testing of the tool in a participatory action research framework offers the potential to promote awareness of the important of place and to advocate for targeted neighborhood improvement programmes and policies.
Supplemental Material
Download Zip (390.6 KB)Disclosure statement
No potential conflict of interest was reported by the author(s).
Supplementary material
Supplemental data for this article can be accessed online at https://doi.org/10.1080/23748834.2023.2192895
Additional information
Funding
References
- Adkins, A., et al., 2012. Unpacking walkability: testing the influence of urban design features on perceptions of walking environment attractiveness. Journal of urban design, 17 (4), 499–510. doi:10.1080/13574809.2012.706365.
- Adu-Brimpong, J., et al., 2017. Optimizing scoring and sampling methods for assessing built neighborhood environment quality in residential areas. International journal of environmental research and public health, 14 (3), 273. doi:10.3390/ijerph14030273.
- Alfonzo, M., et al., 2014. Walking, obesity and urban design in Chinese neighborhoods. Preventive medicine, 69 (S), S79–85. doi:10.1016/j.ypmed.2014.10.002.
- Andresen, E.M., et al., 2013. Observer ratings of neighborhoods: comparison of two methods. BMC public health, 13 (1). doi:10.1186/1471-2458-13-1024.
- Augusta, A., et al., 2012. Assessing the psychometric and ecometric properties of neighborhood scales in developing countries: saúde em Beagá study, Belo Horizonte, Brazil, 2008–2009. Journal of urban health, 90 (2), 246–261. doi:10.1007/s11524-012-9737-z.
- Bader, M.D., et al., 2015. Development and deployment of the Computer Assisted Neighborhood Visual Assessment System (CANVAS) to measure health-related neighborhood conditions. Health & place, 31, 163–172.
- Bethlehem, J.R., et al., 2014. The SPOTLIGHT virtual audit tool: a valid and reliable tool to assess obesogenic characteristics of the built environment. International journal of health geographics, 13 (1), 52. doi:10.1186/1476-072X-13-52.
- Boarnet, M.G., et al., 2006. The Irvine-Minnesota inventory to measure built environments: reliability tests. American journal of preventive medicine, 30 (2), 153–159. doi:10.1016/j.amepre.2005.09.018.
- Boarnet, M.G., et al., 2011. The street level built environment and physical activity and walking: results of a predictive validity study for the Irvine Minnesota inventory. Environment and behavior, 43 (6), 735–775. doi:10.1177/0013916510379760.
- Caughy, M.O., O’campo, P.J., and Patterson, J., 2001. A brief observational measure for urban neighborhoods. Health & place, 7 (3), 225–236. doi:10.1016/S1353-8292(01)00012-0.
- Charreire, H., et al., 2014. Using remote sensing to define environmental characteristics related to physical activity and dietary behaviours: a systematic review (the SPOTLIGHT project). Health & Place, 25, 1–9. doi:10.1016/j.healthplace.2013.09.017
- Chaudhury, H., et al., 2011. Use of a systematic observational measure to assess and compare walkability for older adults in Vancouver, British Columbia and Portland, Oregon neighbourhoods. Journal of urban design, 16 (4), 433–454. doi:10.1080/13574809.2011.585847.
- Chow, C.K., et al., 2010. Environmental Profile of a Community's Health (EPOCH): an instrument to measure environmental determinants of cardiovascular health in five countries. Plos One, 5 (12), e14294.
- Clifton, K.J., Livi Smith, A.D., and Rodriguez, D., 2007. The development and testing of an audit for the pedestrian environment. Landscape and urban planning, 80 (1–2), 95–110. doi:10.1016/j.landurbplan.2006.06.008.
- Diez Roux, A.V. and Mair, C., 2010. Neighborhoods and health. Annals of the New York Academy of Sciences, 1186 (1), 125–145.
- Dunstan, F., et al., 2005. An observation tool to assist with the assessment of urban residential environments. Journal of environmental psychology, 25 (3), 293–305. doi:10.1016/j.jenvp.2005.07.004.
- Ellina, P., et al., 2021. Social gradient in health-related quality of life among urban middle-age residents in Limassol. Cyprus: research article. BMC Public Health, 21, 608. doi:10.1186/s12889-020-10027-6.
- Freitas, E.D.D., et al., 2013. Instrumento para condução de observação social sistemática: métodos e resultados da concordância interobservadores. Cadernos de Saúde Pública, 29 (10), 2093–2104. doi:10.1590/0102-311x00086812.
- Furr-Holden, C.D., et al., 2008. The NIfETy method for environmental assessment of neighborhood-level indicators of violence, alcohol, and other drug exposure. Prevention Science, 9, 245–255.
- Guillaume, E., et al., 2015. Development of a cross-cultural deprivation index in five European countries. Journal of epidemiology and community health, 70, 493–499.
- Gullón, P., et al., 2015. Assessing walking and cycling environments in the streets of Madrid: comparing on-field and virtual audits. Journal of urban health, 92 (5), 923–939. doi:10.1007/s11524-015-9982-z.
- James, P., et al., 2016. Exposure to greenness and mortality in a nationwide prospective cohort study of women. Environmental health perspectives, 124 (9), 1344–1352. doi:10.1289/ehp.1510363.
- Kepper, M.M., et al., 2017. A reliable, feasible method to observe neighborhoods at high spatial resolution. American journal of preventive medicine, 52 (1), S20–30.
- Kim, S., Park, S., and Lee, J.S., 2014. Meso- or micro-scale? Environmental factors influencing pedestrian satisfaction. Transportation research Part D: transport and environment, 30, 10–20. doi:10.1016/j.trd.2014.05.005
- Kleopa, D., et al., 2022. Profiling the variability and inequity in the residential environment in Cyprus according to citizens’ ratings: a cross-sectional internet-based “Place Standard” survey. BMC Public Health, 22 (1), 1–22.
- Knapp, E.A., et al., 2016. Community audit of social, civil, and activity domains in diverse environments (CASCADDE). American journal of preventive medicine, 1–11. doi:10.1016/j.amepre.2016.11.013.
- Lafontaine, S.J.V., Sawada, M., and Kristjansson, E., 2017. A direct observation method for auditing large urban centers using stratified sampling, mobile GIS technology and virtual environments. International journal of health geographics, 16 (1), 1–15. doi:10.1186/s12942-017-0079-7.
- Lamnisos, D., Lambrianidou, G., and Middleton, N., 2019. Small-area socioeconomic deprivation indices in Cyprus: development and association with premature mortality. BMC Public Health, 19 (1), 1–1.
- Leonard, T.C.M., et al., 2011. Systematic neighborhood observations at high spatial resolution: methodology and assessment of potential benefits. Plos One, 6 (6), e20225. doi:10.1371/journal.pone.0020225.
- Leung, C.W., et al., 2010. Measuring the neighborhood environment: associations with young girls’ energy intake and expenditure in a cross-sectional study. The international journal of behavioral nutrition and physical activity, 7 (1), 1–10. doi:10.1186/1479-5868-7-52.
- Malecki, K.C., et al., 2014. The Wisconsin assessment of the social and built environment (WASABE): a multi-dimensional objective audit instrument for examining neighborhood effects on health. BMC public health, 14 (1), 1–15. doi:10.1186/1471-2458-14-1165.
- Marco, M., et al., 2017. Validation of a Google street view-based neighborhood disorder observational scale. Journal of urban health, 94 (2), 190–198. doi:10.1007/s11524-017-0134-5.
- Middleton, N., et al., 2018. Socio-economic inequality in health: individual- and area-level measures of socio-economic position. In: A.K. Uskul and S. Oishi, eds, Socio-economic environment and human psychology: Social, ecological and Cultural perspective. Oxford: Oxford University Press, 129–170.
- Milam, A.J., et al., 2016. Evaluating nighttime observational measures of neighborhood disorder: validity of the nighttime NIfETy assessment. Journal of environmental psychology, 45, 97–102. doi:10.1016/j.jenvp.2015.11.010
- Millstein, R.A., et al., 2013. Development, scoring, and reliability of the Microscale Audit of Pedestrian Streetscapes (MAPS). BMC Public Health, 13 (1), 1–5.
- Mujahid, M.S., et al., 2007. Assessing the measurement properties of neighborhood scales: from psychometrics to ecometrics. American journal of epidemiology, 165 (8), 858–867. doi:10.1093/aje/kwm040.
- Nickelson, J., et al., 2013. Inventory of the physical environment domains and subdomains measured by neighborhood audit tools: a systematic literature review. Journal of environmental psychology, 36, 179–189. doi:10.1016/j.jenvp.2013.07.009
- Papadopoulos, C. and Twaddle, B.J., 2016. Differences in physical activity and built environment perceptions between younger and older adults living in the same rural. International journal of public health science (IJPHS), 5 (2), 142–150. doi:10.11591/ijphs.v5i2.4778.
- Paquet, C., et al., 2010. Reliability of an instrument for direct observation of urban neighbourhoods. Landscape and urban planning, 97 (3), 194–201. doi:10.1016/j.landurbplan.2010.06.001.
- Parsons, J.A., et al., 2010. Standardized observation of neighbourhood disorder: does it work in Canada? International journal of health geographics, 9 (1), 1–19. doi:10.1186/1476-072X-9-6.
- Pikora, T.J., et al., 2002. Developing a reliable audit instrument to measure the physical environment for physical activity. American journal of preventive medicine, 23 (3), 187–194. doi:10.1016/S0749-3797(02)00498-1.
- Poortinga, W., et al., 2017. Neighborhood quality and attachment: validation of the revised residential environment assessment tool. Environment and behavior, 49 (3), 255–282. doi:10.1177/0013916516634403.
- Quintas, R., et al., 2014. The COURAGE Built Environment Outdoor Checklist: an objective built environment instrument to investigate the impact of the environment on health and disability. Clinical Psychology & Psychotherapy, 21 (3), 204–214.
- Saelens, B.E. and Handy, S.L., 2010. NIH public access. 40 (206). doi:10.1249/MSS.0b013e31817c67a4.Built.
- Sallis, J.F., et al., 2015. Is your neighborhood designed to support physical activity? A brief streetscape audit tool. Preventing chronic disease, 12 (9). doi:10.5888/pcd12.150098.
- Sampson, R.J. and Raudenbush, S.W., 1999. Systematic social observation of public spaces: a new look at disorder in urban neighborhoods. The American journal of sociology, 105 (3), 603–651. doi:10.1086/210356.
- Schaefer-McDaniel, N., Caughy, O., and O’campo, M.P., & Gearey, W., 2010. Examining methodological details of neighbourhood observations and the relationship to health: a literature review. Social science and medicine, 70 (2), 277–292. doi:10.1016/j.socscimed.2009.10.018.
- Scottish Government, 2017. Place standard. Available from: https://www.placestandard.scot/ [Accessed 2 March, 2021].
- Scribner, R., Tseng, T., and Schaettle, P., 2018. HHS public access, 52. doi:10.1016/j.amepre.2016.06.010.A.
- Shareck, M., Dassa, C., and Frohlich, K.L., 2012. Improving the measurement of neighbourhood characteristics through systematic observation: inequalities in smoking as a case study. Health & place, 18 (3), 671–682. doi:10.1016/j.healthplace.2011.11.008.
- Sim, J. and Wright, C.C., 2005. The kappa statistic in reliability studies: use, interpretation, and sample size requirements. Physical therapy, 85 (3), 257–268. doi:10.1093/ptj/85.3.257.
- Smith, R.M., 2015. Planning for urban sustainability: the geography of LEED®–Neighborhood Development™(LEED®–ND™) projects in the United States. International journal of urban sustainable development, 7 (1), 15–32.
- Su, M., et al., 2014. Objective assessment of urban built environment related to physical activity–development, reliability and validity of the China Urban Built Environment Scan Tool (CUBEST). BMC public health, 14 (1), 109. doi:10.1186/1471-2458-14-109.
- Taylor, W.C., et al., 2012. Environmental audits of friendliness toward physical activity in three income levels. Journal of urban health, 89 (2), 296–307. doi:10.1007/s11524-011-9663-5.
- Zenk, S.N., et al., 2007. Inter-rater and test-retest reliability: methods and results for the neighborhood observational checklist. Health & place, 13 (2), 452–465. doi:10.1016/j.healthplace.2006.05.003.
- Zuniga-Teran, A.A., et al., 2016. Designing healthy communities: a walkability analysis of LEED-ND. Frontiers of Architectural Research, 5 (4), 433–452.