
ABSTRACT
Several studies have revealed that beta-diversity patterns are tightly coupled to differences in habitat heterogeneity and the spatial distance among headwaters. However, addressing the relative role of these factors over time is yet to be done, particularly in those factors acting at the local scale. Here, we investigated the temporal responses of stream invertebrate communities to habitat simplification and flow variability in two stretches of a high-Andean stream: an undisturbed and a channelized stretch. Both stretches were sampled every month in two hydrologically different years: a “regular year” and a year under the influence of the La Niña phenomenon. Using four types of beta diversity (Jaccard, Percentage difference, Raup-Crick, and Gower), we tested two hypotheses: (H1) the temporal flow dynamics affect beta diversity, increasing its temporal variability. (H2) The effect of flow temporal dynamics would change because of the habitat simplification, being the temporal variability of beta diversity higher in the simplified (channelized) stretch. Contrarily to our expectations, we observed a significant mismatch between beta diversity metrics: while some indicated an increase, others indicated a decrease in the temporal variability. Nevertheless, taken together and interpreted in an ecological context, our results indicate that habitat simplification changes the temporal patterns of beta diversity. Specifically, our findings suggest that habitat simplification induces the functional homogenization of the community and diminishes the extent of change in community composition between sampling occasions. At the channelized stretch, we found that the community comprised species with adaptations to flow-related constraints primarily whose occurrence varied little among sampling occasions. These findings are relevant to Andean streams’ bioassessment, as certain programs rely on taking a ‘snapshot” to assess the ecosystem’s health or the effect of an anthropogenic stressor. Our study suggests that this snapshot may be biased if both the habitat heterogeneity and the history of high-flow events are not explicitly considered.
Resumen
Estudios previos resaltan que la heterogeneidad del hábitat y la distancia espacial entre cuerpos de agua son factores que modulan los patrones de diversidad beta (diferencia composicional de especies entre dos o más comunidades) en ríos de cabecera. Sin embargo, a la fecha, son pocos los estudios que han ahondado en cómo la influencia de estos factores varía temporalmente, particularmente en la escala local. En este estudio investigamos la respuesta temporal de las comunidades de macroinvertebrados a la pérdida de la heterogeneidad del hábitat a causa de la simplificación del lecho y al incremento de la variabilidad hidrológica a causa del fenómeno de La Niña. Con este fin, realizamos muestreos mensuales en dos tramos de un río altoandino (uno canalizado y otro de referencia) durante dos años hidrológicamente distintos. La variabilidad temporal de las comunidades la cuantificamos por medio de cuatro índices de diversidad beta (Jaccard, Diferencia porcentual, Raup-Crick y Gower), y con estos datos evaluamos si (H1) la variabilidad hidrológica tendrá un efecto sobre la diversidad beta, aumentando su variabilidad temporal; y (H2) si el efecto de la variabilidad hidrológica cambiará debido a la pérdida en la heterogeneidad del hábitat en el tramo canalizado. Encontramos que, contrario a lo esperado, no hay una respuesta consistente entre todos los índices de diversidad beta: mientras unos indicaron un aumento, otros indicaron una disminución en la variabilidad temporal. Sin embargo, la interpretación conjunta de los cuatro índices en un contexto ecológico indica que la simplificación del hábitat podría inducir a una homogeneización funcional de la comunidad: donde en el tramo canalizado coexisten menos especies con adaptaciones especiales para sobrevivir en condiciones de mayor inestabilidad hidrológica y menor disponibilidad de recursos. Estos hallazgos son especialmente relevantes para el biomonitoreo de los ríos altoandinos, ya que sugieren que un único muestreo para evaluar la salud del ecosistema o el efecto de un estresor antropogénico podría estar sesgado si no se consideran explícitamente tanto la disponibilidad del refugio como la variabilidad hidrológica que precede al muestreo.
Introduction
Flow is a major factor constraining the occurrence of invertebrate taxa in streams [Citation1,Citation2]. While there are species well-adapted to temporal dynamics of water flow, there are other species that are not so well fitted [Citation3]. To survive, the former species take advantage on the specialized niches associated with stream’s habitat heterogeneity, since habitat not only provides resources for individual’s development but serves as refugia for species not adapted to disturbances such as extremely high- and low-flow events [Citation4–6]. Consequently, higher habitat heterogeneity is expected to facilitate species coexistence; and, therefore, increase the beta diversity within and among streams. Previous studies have confirmed this expectation and demonstrated that beta-diversity patterns within and among streams are coupled to differences in habitat heterogeneity [Citation7–9]. However, to date, few studies have assessed how habitat simplification may change beta-diversity patterns in a temporal dimension.
In high-Andean streams, the substrate heterogeneity and the unpredictable high-flow events during rainy seasons are relevant determinants of invertebrate community structure in a temporal dimension [Citation10,Citation11]. Indeed, previous studies have shown that higher hydraulic stress and streambed movement during high-flow events alter community composition [Citation6,Citation12]; and consequently, shape beta-diversity patterns at lower spatiotemporal scales. The findings of Jacobsen [Citation6], in particular, suggest that the flow regime primarily drives temporal beta-diversity patterns in Andean communities, since species composition is determined at random after a high-flow event. Subsequent studies revealed mixed shreds of evidence; while some support a random assembly after spate events [Citation12,Citation13], others found no significant differences before and after high-flow events [Citation14,Citation15]. These conflicting results may be explained by differences in habitat heterogeneity or species life histories as well as by methodological differences (e.g., distinct diversity indices). However, to date, the interaction between the three factors remains scarcely explored in high-Andean streams.
The beta diversity, defined as the extent of change in community composition between sampling sites or occasions [Citation16], has become a fundamental component for connecting spatiotemporal patterns to the underlying ecological mechanisms [Citation17]. However, due to its multifaceted nature, there are multiple ways to estimate and interpret the observed values [Citation16]. For example, concerning its estimation, differences in abundances, richness, or sampling bias are some factors that may affect beta-diversity patterns [Citation18,Citation19]. In light of this, beta diversity may be higher due to sampling bias (e.g., sampling only one type of substratum), since species occurrence and abundances are tightly coupled with the substratum type in tropical headwaters [Citation12,Citation20]. On the other hand, beta diversity could be higher if the used metric gives more weight to species abundances rather than to species identities since spates tend to affect species abundances rather than their occurrences [Citation11,Citation15]. Therefore, including different metrics is likely to improve our knowledge of the drivers of temporal beta-diversity patterns.
In this study, we investigated the temporal patterns of beta-diversity and their relationship with habitat simplification and hydrological variability in two stretches of a high-Andean stream. To address the effect of habitat simplification, we chose two stretches, one channelized and one undisturbed. Both stretches were sampled monthly in two hydrologically different years: a “regular year” and a year under the influence of La Niña phenomena. We quantified four types of beta diversity to test the following two hypotheses.
H1: we predicted that higher hydrological variability (under La Niña influence – 2016) would increase temporal beta diversity because of frequent resets of natural community successions [Citation21,Citation22]. Such an increase may be driven by differences in species richness, abundance, and the replacement of species non-adapted to flow-related constraints. Thus, we would observe higher values of beta diversity in 2016 than in 2012 when the four indices were assessed.
H2: we hypothesized that habitat simplification would change the patterns, as mentioned earlier. Channelization reduces the spatial heterogeneity and the temporal variability of habitats’ distribution, reducing the resource and refugium availability for invertebrate taxa [Citation12,Citation23,Citation24]. Thus, we hypothesized that the effect of the hydrological variability on beta diversity would be higher at the channelized stretch than at undisturbed stretch.
We used a set of four metrics which consider incidence-, abundance- and trait-based data, and one metric that controls for sampling bias associated with differences in alpha diversity, such as the Raup-Crick index [Citation25]. By using this set of metrics, we aim to assess the influence of species richness, identity, abundance, and traits on the temporal beta-diversity patterns as well as the influence of methodological differences.
Methods
Study zone
“La Vieja” is a first-order stream located in the hills east of Bogotá, Colombia 4º38ʹ49” N, 74º02ʹ38” W; 2690–2900 m.a.s.l.). The stream flows through a natural reserve and later enters the underground pipe system of the city. The reserve covers an area of approximately 40 km2 and is protected by Bogotá’s water company. It contains a secondary forest composed of native species such as Weinmannia tomentosa L.f., Clusia multiflora Kunth, and Myrcianthes leucoxyla Ortega as well as exotic species such as Eucalyptus globulus Labill, Acacia melanoxylon R.Br. and Pinus patula Schlecht et Cham, which were introduced as part of a local reforestation plan in 1960. Because it has a steep slope, la Vieja stream mainly consists of riffle sections, whose streambeds are primarily made up of gravel, boulders, and leaf litter packages.
La Vieja has a flow regime with a bimodal distribution, being the first peak between April and May, and the second peak between October and November (Hydrological data from EAB, data available upon request to authors). However, the effect of La Niña alters this seasonal trend. Specifically, La Niña phenomenon, which is originated from the cooling of the ocean surface in the central and eastern tropical Pacific Ocean [Citation26], generally causes an increase in the average rainfall in the central Andes of Colombia; and consequently, in the occurrence of catastrophic high-flow events.
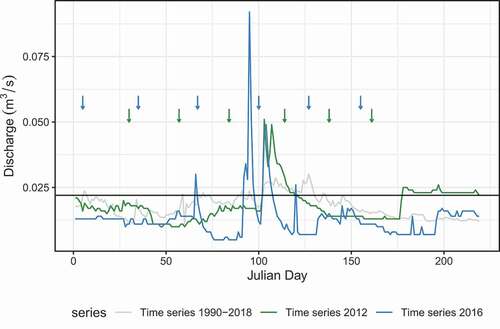
In 2016, for instance, we observed a change in the daily flow patterns compared to 2012. Daily water flow during 2016 exhibited no significant correlation with daily water flow during 2012 (Pearson correlation test: r2 = −0.0088, t = −0.17, df = 364, p-value = 0.87). During 2016, there was greater variability in daily flow discharge as well as a greater number of high- and low-flow events (). In our sampling window, in particular, there were unusual low-flow periods followed by high flow events from March to May 2016 ().
Table 1. Summary statistics of daily flow discharge in La Vieja stream estimated from 2012 and 2016 datasets as well as from an historical dataset from 1990 to 2018
Figure 1. Daily discharge hydrograph as a function of sampling date (arrows) for the two study years in La Vieja stream. Multiannual (1990–2018), 2012, and 2016 daily flows are represented in light gray, green and blue, respectively. Q75 (= 0.022 m3/s) is the flow threshold for high-flow events (horizontal black line). Data Provided by EAB (2018)
Study stretches
We selected two 10-m long stretches of La Vieja stream, one channelized (simplified streambed), and one undisturbed stretch upstream from the channel. The channelized stretch had been artificially straightened to build a channel with a trapezoidal cross-section covered with concrete and flattened boulders. At this stretch, there is a reduced number of mesohabitats available for invertebrate colonization and greater hydraulic instability. Meanwhile, the undisturbed stretch reflects the flow and the substratum diversity in reference conditions. González-Trujillo [Citation12] showed that both the riparian forest and the physical-chemical characteristics were similar in both sections.
To assess the temporal variability in beta diversity patterns, we used monthly samples in two hydrologically distinct years: a regular hydrological year (2012) and a wetter year due to the influence of “La Niña” phenomenon (2016). Samples were taken from January to June, as this interval of time covers the transition from the dry period (January) to the wettest period (May). At each stretch, quantitative sampling was carried out with a mini-Surber (0.01 m2, 200 μm mesh size) to obtain individual samples from different Mesohabitats. Following González-Trujillo [Citation12], four types of Mesohabitats were identified and sampled: 1. Boulder, composed of boulders and rocks in “riffles,” with particle sizes between 64 and 512 mm. 2. Gravel, composed of gravel and sand from “pools” with particle size <63 mm. 3. Moss, composed of Bryophytes covering boulders in riffle areas. 4. Litter, composed of wood and leaf-packs retained by obstructions.
For every mesohabitat at each stretch, ten random samples were taken and preserved in 95% ethanol. A total of 24 (2 years x 6 months x 2 mesohabitat types) and 48 (2 years x 6 months x 4 mesohabitat types) samples were taken at the channelized and undisturbed stretches, respectively. In the laboratory, invertebrate larvae and adults were sorted from the samples and identified to the genus level using specialized taxonomic keys [Citation27,Citation28]. Chironomidae were also identified to the genus level using specialized taxonomic keys [Citation29–31]. We found some individuals of Oligochaeta and Acari, however, due to the absence of specialized keys and their low abundance, we did not include them in the analysis.
As we found two mesohabitats at the channel (Boulder and moss) and four at the undisturbed stretch (Boulder, moss, gravel and litter), it was not completely feasible to make comparisons at the mesohabitat scale. Therefore, we weighted genus abundances according to the mesohabitat coverage at each stretch at each sampling occasion. The resulting array (“species-abundance array”) has 24 rows (2 stretches x 2 years x 6 sampling occasions) and 57 columns (genera). By doing this, we were able to compare the beta diversity between stretches with different sampling intensity. Mesohabitat coverage was monthly mapped on graph paper with a scale of 1:10. The mini-Surber quadrat (10 x 9 × 10 cm) was selected as the mapping unit.
Biological traits
The trait composition of each assemblage was described in terms of seven traits, selected given their relation to habitat heterogeneity in temporal (flow’s variability and substrata instability) and spatial dimensions (stream’s bed composition of substrate). Data for every trait were gathered from laboratory measurements and field observations as well as from previous studies from the Neotropical zone [Citation4,Citation12]. Each trait was resolved into different states () and, a fuzzing code procedure [Citation32] was used to describe each genus’s affinity to each trait state. A value between 0 (no affinity) and 3 (high affinity) was assigned to each trait category (“Trait database,” Supplementary Material 1). The affinity values of each trait for each genus were standardized so that their sum for a given genus and a given trait was 1 (“trait-proportions array”).
Table 2. Biological traits, and their states used to assess the functional structure of invertebrate communities
Data analysis
Beta diversity was estimated through four different indices: Jaccard, percentage difference (a.k.a. Bray Curtis), Raup-Crick, and Gower (a trait-based dissimilarity index). The Jaccard dissimilarity index is one of the most common metrics to calculate beta diversity using incidence-based data. The percentage difference is a Jaccard-based metric that considers the abundance of each taxon. The Raup–Crick dissimilarity index was included in our study as it estimates beta diversity after considering the differences in species richness between both stretches. Finally, we used the Gower index to estimate the dissimilarity in terms of the assemblages’ trait-based diversity. The Gower distances were estimated by using a matrix of invertebrate relative abundances multiplied by the “trait-proportions array.” The resulting array (“species-abundance-per-trait array”) has 57 rows (genera) and 35 columns (the 35 states of the seven traits). We used a weighted Fuzzy Correspondence Analysis (“FCA” [Citation32]) to describe and compare the trait composition of the communities.
Differences in temporal beta-diversity patterns were evaluated among years (H1) and between stretches in both years (H2) using the PERMDISP analysis [Citation33]. The PERMDISP analysis tests whether the mean within-group dispersion (measured by the mean distance of samples to its group centroid/median in the full-dimensional space calculated in a Principal Coordinates Analysis) is similar. We firstly assessed the potential effect of La Niña on temporal beta diversity by comparing dispersions between years. Secondly, we assessed the potential effect of habitat simplification on temporal beta diversity by comparing dispersions between stretches. This comparison was performed independently, in datasets of 2012 and 2016. The significance of these comparisons was tested using 9,999 permutations at a significance level of 0.05. We used the default option in the “betadisper” function of the vegan package [Citation34] for the R environment [Citation35] which uses medians instead of centroids, but hereafter, we termed it centroid as it is more familiar to ecologists.
As beta diversity cannot be fully explained without considering alpha diversity, we also estimated a series of alpha diversity metrics. Following Avolio et al. [Citation36], we chose some descriptors of rank abundance curves (RAC) as they are complementary to multivariate methods and detail species-level community changes. Specifically, four aspects of change in RACs were quantified and compared among sampling occasions in 2012 and 2016: (i) species richness (the length of the RAC); (ii) species evenness, measured as the slope of the RAC; (iii) species losses, which are partially underlying species temporal turnover; and (iv) the curve change. Changes in species richness are bound between −1 and 1, where larger values indicate more enormous changes in species richness. Changes in evenness are bound between −1 and 1, where larger negative values indicate greater decreases in evenness. Species losses are quantified as the proportion (between 0 and 1) of species lost between sampling occasions. Finally, the curve change is an unbounded index which represents the summed area between the two curves. The summatory between curves is estimated as the difference in the cumulative abundance between ranked species in t and t + 1. Refer to Avolio et al. [Citation35] for details on the calculations of every descriptor (see for instance their supplementary material 4 for a detailed example on the computation of curve change).
Results
Invertebrate communities
We identified a total of 21,758 individuals from 57 genera belonging to 25 families and nine orders. The most diverse family in terms of taxon richness was Chironomidae (22 genera). We identified 50 and 51 genera at the undisturbed stretch during 2012 and 2016, respectively. At the channelized stretch, on the other hand, we identified 36 and 43 genera during 2012 and 2016, respectively.
H1: effect of flow temporal dynamics on beta diversity
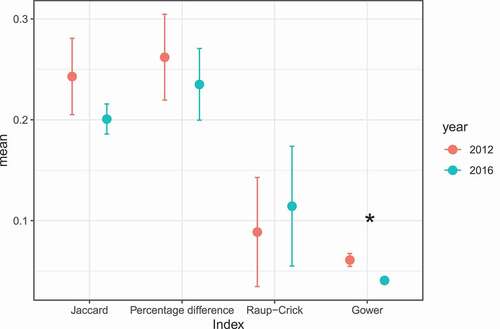
Temporal beta diversity did not differ significantly between years, except when compared with the functional-based index (“Gower,” ). The average dispersion of functional beta diversity was significantly higher during 2012 (PERMDISP test, F1,10 = 8.21, p < 0.01).
H2: effect of habitat simplification on the temporal patterns of beta diversity
Figure 2. Comparisons of beta diversity (average distance to centroid) between years. Distances were estimated by using Jaccard, percentage of difference (Bray-Curtis), Raup–Crick, and Gower indices. The asterisks represent comparisons in which P-values were below 0.05 (P < 0.05)
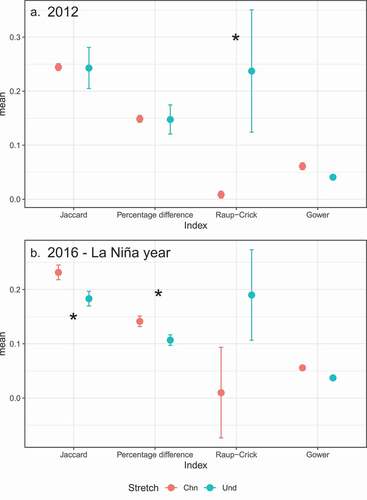
Habitat simplification changes temporal patterns of beta diversity during 2012 and 2016 (). In 2012, we observed a difference in the Raup-Crick-based beta diversity between stretches (PERMDISP test, F1,10 = 4.623, p < 0.003). The average dispersion of the Raup-Crick index was significantly higher at the undisturbed stretch ()). In 2016, we observed differences in the Jaccard (PERMDISP test, F1,10 = 7.712, p < 0.008) and percentage-difference (PERMDISP test, F1,10 = 7.317, p < 0.011) beta diversities between stretches. The average dispersions of both indices were significantly higher at the channelized stretch ()).
Figure 3. Comparisons of beta diversity (average distance to centroid) between stretches during 2012 (A) and 2016 (B). Distances were estimated by using Jaccard, percentage of difference (Bray-Curtis), Raup–Crick, and Gower indices.The asterisks represent comparisons in which P-values were below 0.05 (P < 0.05)
When assessed monthly changes in Rank abundance curves (), we observed that differences in beta diversity between stretches are generally associated with changes in species richness and abundance distribution. In 2012, we observed minor differences in RAC descriptors between undisturbed and channelized stretches (). Most notable differences were observed in the most abundant species and their respective ranks after the high-flow event (3rd sampling occasion of 2012) ()). After the high-flow event, the rank order at the undisturbed stretch varied slightly compared to the channelized stretch’s rank order.
Table 3. Differences in alpha diversity metrics between undisturbed and channelized stretches during sampling occasions in 2012 and 2016
Figure 4. Monthly ranks of the ten most abundant species at the channelized (A and C) and undisturbed (B and D) stretches. Species represented in squares and diamonds appeared in the ranks after the first sampling campaign – dashed-lines represent species that did not appear in the ranks during all sampling campaigns
In 2016, we observed minor changes in species richness at the channelized stretch compared to the undisturbed stretch (). At the channel, the significant increase in Jaccard and percentage-difference values was linked to the observed changes in the abundance of dominant species and species losses: we found a higher proportion of species losses every month (up to 25%). Additionally, we observed that the ranks of the most abundant species changed after every sampling occasion ()). The later did not occur at the undisturbed stretch, where Lauternborniella and Smicridea were the most abundant genera during the sampling window ()).
Trait-based responses
About 70% of the variation in the functional structure was described by the first (51.3%) and second (18.3%) FCA axes (total inertia = 0.14) (). When assessed the FCA (), we observed a different functional structure at the undisturbed stretch during 2012 and 2016, explaining the significant differences observed in . At this stretch, the functional structure of the community during 2016 was mainly associated with the first axis (F1). The most discriminating traits along F1 included: spiracular and plastron respiration forms, medium body size (‘BS4ʹ: 10–20 mm), filterer or predator FFGs, passive aquatic dispersal, and burrower, full water swimmer or permanently attached. On the other hand, the functional structure of the community during 2012 was mainly associated with the second axis (F2). The most discriminating traits along F2 included: blood-based respiration system, large body size (‘BS6ʹ: >40 mm), full water swimmer, and suckers as adaptations to flow constraints ().
Figure 5. Ordination of invertebrate samples by fuzzy correspondence analysis (FCA). A. The distribution of each of the seven traits and their categories on the first two axes of the factorial plane (see for the meaning of each label). B. The distribution of each sample has been plotted in the first factorial plane, as have the weighted averages of these distributions
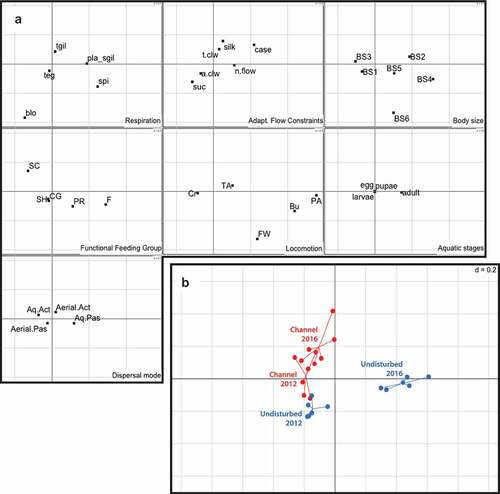
The channelized stretch communities did not exhibit interannual variability in terms of their functional structure ()). In both years, communities at this stretch primarily consisted of genera with the following traits ()): tracheal gills; scrapper FFG; crawler locomotion; small or medium body sizes (‘BS1ʹ or ‘BS3ʹ); active aquatic dispersal; and silk glands and claws as adaptations to flow constraints.
Discussion
As stated in Hypothesis 1 and Hypothesis 2, we found that the interaction between the hydrological variability and the habitat simplification affects the temporal patterns of beta diversity in a high-Andean stream. However, the interactive effect of these factors does not necessarily increase the temporal variability of all beta-diversity metrics. Contrarily to our expectations, we observed a significant mismatch among the four metrics: while some indicated an increase, others indicated a decrease in the temporal variability. Nevertheless, taken together and interpreted in an ecological context, the observed patterns indicate that habitat simplification due to channelization is inducing to the biotic homogenization of the community. A more similar biota in functional terms, as well as the reduced availability of refugia, led to a divergence between the beta-diversity patterns observed at the channelized and undisturbed stretches.
The non-congruence of beta-diversity metrics seems to be contradictory as we expected the reduction in habitat heterogeneity to increase beta diversity in all its facets (H1 and H2). Indeed, previous studies highlighted that higher habitat heterogeneity is linked to greater availability of refugia, which in turn allows a higher number of species to coexist in space and time [Citation2,Citation37,Citation38]. However, as previously stated, the trends of distinct beta-diversity metrics should not necessarily be congruent, as every metric can be affected distinctly by differences in species richness, functional traits, and abundance distributions [Citation39]. In our study, differences in species richness between stretches, as well as differences in the functional traits of the most abundant taxa, seem to be underlying the non-congruent patterns observed among beta-diversity metrics.
Although we could not directly relate the specific increases in beta diversity with specific hydrological events, we provide some evidence indicating that changes in the hydrological variability can affect the temporal patterns of beta diversity at reference conditions (H1). During La Niña year, we observed an unexpected sequence of high-flow events followed by periods of low flows. This sequence might create novel conditions in the stream that promote the establishment of taxa with specific adaptations. In line with Brooks and Haeuesler [Citation40], we found a greater abundance of filterers and of taxa without gills (e.g., Rheotanytarsus and Lauternborniella, and Smicridea), which suggests that the accumulation of organic matter under low flows might be driving the functional composition of the communities during La Niña year. We also observed a great abundance of taxa with adaptations to resist high-flow events, such as “case”, “permanently attached” and “Burrower/Interstitial” (affine to Rheotanytarsus, and Grumichella) [Citation12,Citation24,Citation38]. The dominance of these taxa seemed to be contradictory to the occurrence of low flows, for it indicates that the functional composition might also be driven by the occurrence high-flow events. However, both findings indicate that streams with higher habitat heterogeneity may host different assemblages characterised by different ecological and hydrological requirements.
At the channelized stretch, the functional composition did not vary when comparing between 2012 and 2016. Communities in both years tended to be similar in taxonomic and functional terms. This finding indicates that habitat simplification is reducing the number of coexisting species, inducing to the biotic homogenization of the community. Expressly, our findings suggest that habitat simplification is filtering taxa according to their adaptations to flow-related constrains. In both years, the most abundant species at the channel were those possessed of small bodies, claws, silk glands, and construction cases: such as Cricotopus, Genus 1, Grumichella, Baetodes or Contulma. All these have been previously reported as common species in communities inhabiting Andean streams with random spates or channelized sections [Citation4,Citation12]. Additionally, the trait profile of these species indicates that they are adapted to sort flow-related constrains such as high-flow events [Citation3,Citation4].
Our results also indicated that the community’s biotic homogenization did not reduce the temporal variability of beta diversity. Despite being a set of “resistant species,” we observed higher temporal variability of Jaccard and percentage-difference metrics at the Channelized stretch. Indeed, the average values of both metrics increased significantly at this stretch during “La Niña” year. This result, which is partially in line with our H2, highlights the potential role of refugia on ameliorating the effect of high-flow events on species occurrence. Previous studies have found that higher habitat heterogeneity is related to higher availability of refugia, which allows species to cope with hydrological disturbances and persist in time [Citation37,Citation38,Citation41]. Therefore, in the absence of local refugia, it seems that the occurrence of channel species was changing every month as affected by hydrological variability, such as it has been observed in temperate streams [Citation41,Citation42].
The temporal variability in species ranks and the results of the Raup-Crick index provide some support to the hypothesis that communities may be randomly assembled in high-Andean streams [Citation6], and notably, on those streams with lower habitat heterogeneity. The index values near zero suggest that high-flow events act primarily through random sampling effects [Citation25]. Therefore, the assembly of communities may be random after high-flow events in Andean streams with low habitat heterogeneity. However, we recognize that other processes, such as dispersal [Citation43,Citation44], may be involved in determining species rank order and the beta-diversity patterns observed at the channelized stretch. Previous studies in Andean streams have demonstrated that populations of chironomid and caddisfly species may be maintained in adverse conditions through mass effects [Citation45]. In light of this, determining the flow thresholds for substrate movements or species dislodgement will help us understand the role of flow peaks on beta-diversity patterns [Citation42]. It will be especially helpful to determine if the high-flow events are stochastic or deterministically decreasing diversity, which is essential to establish environmental flows [Citation22].
Although it is a small-scale study, the results were consistent with the view that habitat simplification leads to species- and trait-level responses in invertebrate communities, and therefore, to a divergence in the temporal patterns of beta diversity. These results reinforce that considering different metrics (including those describing alpha diversity) is essential to capture the temporal drivers of beta diversity accurately. Understanding these drivers can directly assist conservation [Citation46] and bioassessment planning [Citation47]. Among high-Andean basins, it is possible to observe headwaters with different substratum composition in streambeds [Citation15], as well as different stressors affecting in-stream habitats. Future studies should explore how differences in these local-scale factors affect the temporal patterns of beta diversity within and among basin headwaters. Exploring the causes of temporal patterns is of great importance in many aspects, and in particular, for the adequate bioassessment of Andean streams. These programs rely on taking a “snapshot” to assess the ecosystem’s health or the effect of an anthropogenic stressor. In this regard, our study suggests that this snapshot may be biased if both the refugium availability and the history of high-flow events are not explicitly considered.
Geolocation information
“La Vieja” is a first-order stream located in the hills east of Bogotá D.C, Colombia (4º38ʹ49” N, 74º02ʹ38” W; 2690–2900 m.a.s.l.). The stream flows through a natural reserve and later enters the underground pipe system of the city. The reserve, which covers an area of approximately 40 km2 and is protected by Bogotá’s water company
Author contributions
JDGT and YLAM designed the research, collected invertebrate samples and performed taxonomical identification of specimens. JDGT analyzed the data and wrote the first draft of the manuscript. JDGT and YLAM discussed equally the research as it developed and edited the manuscript.
Supplemental Material
Download MS Excel (21.2 KB)Acknowledgments
The authors would like to thank Sergi Sabater and two anonymous reviewers for their helpful comments on the manuscript. Special thanks to M. González Oviedo, E. C. González Trujillo, J. P. Álvarez-Silva, G. Giraldo, O. Combita, and R. Ospina for their help in the field and the laboratory, and to Nevardo and Carlos Bello (‘Acueducto de Bogota´ – E.A.B.’) who provided access to ‘La Vieja’ stream.
Disclosure statement
The authors declare that there is no conflict of interest.
Supplementary Data
Supplemental data for this article can be accessed here.
Related Research Data
References
- Poff NL, Allan JD, Bain MB, et al. Tahe natural flow regime. Biosci [Internet]. 1997 [cited 2019 Oct 15];47:769–784. Available from: https://academic.oup.com/bioscience/article-lookup/doi/10.2307/1313099
- Townsend CR, Scarsbrook MR, Dolédec S. The intermediate disturbance hypothesis, refugia, and biodiversity in streams. Limnol Oceanogr [Internet]. 1997 [cited 2019 Oct 13];42:938–949.
- Townsend CR, Hildrew AG. Species traits in relation to a habitat templet for river systems. Freshw Biol. 1994;31:265–275.
- Tomanova S, Usseglio-Polatera P. Patterns of benthic community traits in neotropical streams: relationship to mesoscale spatial variability. Fundam Appl Limnol/Arch Für Hydrobiol [Internet]. 2007;170:243–255. Available from: http://openurl.ingenta.com/content/xref?genre=article&=1863-9135&volume=170&issue=3&spage=243
- Hepp LU, Landeiro VL, Melo AS. Experimental assessment of the effects of environmental factors and longitudinal position on alpha and beta diversities of aquatic insects in a neotropical stream. Int Rev Hydrobiol [Internet]. 2012 [cited 2019 Oct 7];97:157–167.
- Jacobsen D. Temporally variable macroinvertebrate-stone relationships in streams. Hydrobiologia. 2005;544:201–214.
- Heino J, Muotka T, Paavola R. Determinants of macroinvertebrate diversity in headwater streams: regional and local influences. J Anim Ecol. 2003;72:425–434.
- Al-Shami SA, Heino J, Che Salmah MR, et al. Drivers of beta diversity of macroinvertebrate communities in tropical forest streams. Freshw Biol. 2013;58:1126–1137.
- Astorga A, Death R, Death F, et al. Habitat heterogeneity drives the geographical distribution of beta diversity: the case of New Zealand stream invertebrates. Ecol Evol. 2014;4:2693–2702.
- Jacobsen D, Encalada A. The macroinvertebrate fauna of Ecuadorian highland streams in the wet and dry season. Arch Fur Hydrobiol. 1998;142:53–70.
- González-Trujillo JD, Donato-Rondon JC. Changes in invertebrate assemblage structure as affected by the flow regulation of a páramo river. Ann Limnol. 2016;52:307–316.
- González-Trujillo JD. Trait-based responses of caddisfly assemblages to the partial channelization of a high-andean stream. Hydrobiologia. 2016;766:381–392.
- Ríos-Pulgarín MI, Barletta M, Arango-Jaramillo MC, et al. The role of the hydrological cycle on the temporal patterns of macroinvertebrate assemblages in an andean foothill stream in Colombia. J Limnol. 2016;75:107–120.
- Ríos-Touma B, Prat N, Encalada AC. Invertebrate drift and colonization processes in a tropical andean stream. Aquat Biol. 2011;14:233–246.
- Vimos-Lojano DJ, Martínez-Capel F, Hampel H, et al. Hydrological influences on aquatic communities at the mesohabitat scale in high Andean streams of southern Ecuador. Ecohydrology. 2019;12:1–17.
- Anderson MJ, Crist TO, Chase JM, et al. Navigating the multiple meanings of β diversity: A roadmap for the practicing ecologist. Ecol Lett [Internet]. 2011 [cited 2019 Oct 7];14:19–28.
- Tuomisto H. A diversity of beta diversities: straightening up a concept gone awry. Part 1. Defining beta diversity as a function of alpha and gamma diversity. Ecography (Cop). 2010;33:2–22.
- Legendre P, De Cáceres M, Morlon H. Beta diversity as the variance of community data: dissimilarity coefficients and partitioning. Ecol Lett. 2013;16:951–963.
- Jost L. Partitioning diversity into independent alpha and beta components. Ecology. 2007;88:2427–2439.
- Ligeiro R, Melo AS, Callisto M. Spatial scale and the diversity of macroinvertebrates in a Neotropical catchment. Freshw Biol. 2010;55:424–435.
- Crabot J, Heino J, Launay B, et al. Drying determines the temporal dynamics of stream invertebrate structural and functional beta diversity. Ecography (Cop). 2020;43:620–635.
- Rosero-López D, Walter MT, Flecker AS, et al. Streamlined eco-engineering approach helps define environmental flows for tropical Andean headwaters. Freshw Biol. 2019;64:1315–1325.
- Turunen J, Muotka T, Vuori KM, et al. Disentangling the responses of boreal stream assemblages to low stressor levels of diffuse pollution and altered channel morphology. Sci Total Environ [Internet]. 2016;544:954–962.
- Negishi JN, Inoue M, Nunokawa M. Effects of channelisation on stream habitat in relation to a spate and flow refugia for macroinvertebrates in northern Japan. Freshw Biol. 2002;47:1515–1529.
- Chase JM, Kraft NJB, Smith KG, et al. Using null models to disentangle variation in community dissimilarity from variation in α-diversity. Ecosphere. 2011;2:1–11.
- Poveda G, Mesa OJ. Las fases extremas del fenomeno ENSO (El Nino y La Nina) y su influencia sobre la hidrologia de Colombia. Ing Hidraul En Mex. 1996;11:21–37.
- Domínguez E Ephemeroptera of South America [Internet]. PENSOFT Publishers; 2006 [cited 2018 Aug 5]. Available from: https://books.google.es/books?hl=es&id=dwaJWle8OfkC&oi=fnd&pg=PA17&dq=dominguez+ephemeroptera&ots=BrLqKCGLEy&sig=Ne6AUcPmb3pO4prg_H995MbtxRE#v=onepage&q=dominguezephemeroptera&f=false.
- Merritt RW, Cummins KW An introduction to the Aquatic insects of North America [Internet]. Kendall/Hunt Pub. Co; 2008 [cited 2018 Aug 5]. Available from: https://books.google.com.mt/books?id=005FAQAAIAAJ&source=gbs_book_other_versions.
- Trivinho-Strixino S, Strixino G Larvas de Chironomidae (Diptera) do Estado de São Paulo: guia de identificação e diagnose dos gêneros. 1995.
- Prat N, González-Trujillo JD, Ospina-Torres R. Key to chironomid pupal exuviae (Diptera: chironomidae) of tropical high Andean streams. Rev Biol Trop. 2014;62:1385–1406.
- Prat N, Rieradevall M, Acosta R, et al. Guía para el reconocimiento de las larvas de Chironomidae (díptera) de los ríos altoandinos de Ecuador y Perú. Grup Investig FEM Dep Ecol Univ Barcelona, España. 2011;78.
- Chevene F, Dolédec S, Chessel D. A fuzzy coding approach for the analysis of long‐term ecological data. Freshw Biol [Internet]. 1994 [cited 2019 Oct 7];31:295–309.
- Anderson MJ. Distance-based tests for homogeneity of multivariate dispersions. Biometrics. 2006;62:245–253.
- Oksanen J, Blanchet FG, Kindt R, et al. Package ‘vegan.’. Community Ecol Packag Version. 2013;2:1–295.
- R Core Team. R: a language and environment for statistical computing [Internet]. ISBN 3-900051-07-0: URL http://www. R-project. org; 2018. Accesed 27/04/2020. Available from: https://www.r-project.org/.
- Avolio ML, Carroll IT, Collins SL, et al. A comprehensive approach to analyzing community dynamics using rank abundance curves. Ecosphere. 2019;10:e02881.
- Petsch DK, Dos Santos Bertoncin AP, Gentilin-Avanci C, et al. High water flow velocity reduces beta diversity and leads to a distinct composition of Oligochaeta in Neotropical lotic ecosystems. Limnol [Internet]. 2020;21:297–304.
- Milesi SV, Dolédec S, Melo AS. Substrate heterogeneity influences the trait composition of stream insect communities: an experimental in situ study. Freshw Sci. 2016;35:1321–1329.
- Devictor V, Mouillot D, Meynard C, et al. Spatial mismatch and congruence between taxonomic, phylogenetic and functional diversity: the need for integrative conservation strategies in a changing world. Ecol Lett [Internet]. 2010 [cited 2019 Oct 13];13:1030–1040.
- Brooks AJ, Haeusler T. Invertebrate responses to flow: trait-velocity relationships during low and moderate flows. Hydrobiologia [Internet]. 2016;773:23–34.
- Gjerløv C, Hildrew AG, Jones JI. Mobility of stream invertebrates in relation to disturbance and refugia: A test of habitat templet theory. J North Am Benthol Soc. 2003;22:207–223.
- Brown BL. Habitat heterogeneity and disturbance influence patterns of community temporal variability in a small temperate stream. Hydrobiologia. 2007;586:93–106.
- Heino J, Grönroos M, Ilmonen J, et al. Environmental heterogeneity and β diversity of stream macroinvertebrate communities at intermediate spatial scales. Freshw Sci. 2013;32:142–154.
- Heino J, Melo AS, Bini LM. Reconceptualising the beta diversity-environmental heterogeneity relationship in running water systems. Freshw Biol. 2015;60:223–235.
- González-Trujillo JD, Petsch DK, Córdoba-Ariza G, et al. Upstream refugia and dispersal ability may override benthic-community responses to high-Andean streams deforestation. Biodivers Conserv. 2019;28:1513–1531.
- Socolar JB, Gilroy JJ, Kunin WE, et al. How should beta-diversity inform biodiversity conservation? Trends Ecol Evol [Internet]. 2016;31:67–80.
- Cook SC, Housley L, Back JA, et al. Freshwater eutrophication drives sharp reductions in temporal beta diversity. Ecology [Internet]. 2018;99:47–56. Available from: https://esajournals.onlinelibrary.wiley.com/doi/abs/10.1002/ecy.2069