
ABSTRACT
Acoustic monitoring is used to assess biodiversity across large spatial and temporal scales. However, extracting meaningful information from large data sets might be exceedingly time consuming. For this reason, acoustic indices have been proposed as proxies for biodiversity monitoring. Although acoustic indices hold great promise for standardizing acoustic data analysis, the complexity of acoustic conditions requires careful examination of the relationship between an index and the underlying process of interest. We evaluated 11 acoustic indices at two operational levels: (1) acoustic community level (an aggregation of species that produces sound), using birds as an example to assess how well acoustic indices predict bird indices (abundance, richness, evenness and diversity); and (2) soundscape level (the collection of biological, geophysical and anthropogenic sounds from a landscape), using acoustic indices to classify the study sites according to their ecological condition. To study the relationship among these variables, we selected two study sites with different ecological conditions (in terms of vegetation structure and traffic noise) within the Braulio Carrillo National Park (BCNP), Costa Rica. We sampled the soundscape and bird community using 12 sampling points and four visits to each study site from June 2017 to August 2018. We continuously recorded sounds at sunrise and sunset, and for 10 minutes every hour, during two consecutive days per visit. In addition, we performed four bird counts per visit (sunrise and sunset). We performed a correlation analysis between 11 acoustic indices and 4 community bird indices. We analyzed the ability of acoustic indices to predict bird indices. Furthermore, we used acoustic indices to classify the two sites according to their ecological condition. Bird abundance and richness were positively correlated with acoustic evenness indices and negatively correlated with the acoustic diversity index, but the whole set of acoustic indices predicted bird indices weakly. However, the classification of the sites using acoustic indices was conducted with a high average precision of 0.93 (sd = 0.08). Acoustic indices appear to be more promising for evaluating the ecological condition of a site than abundance, richness or diversity of specific animal groups, in this case birds, in tropical rainforests.
Introduction
Biodiversity faces growing pressures from human actions, including habitat conversion and degradation, habitat fragmentation, climate change, harvesting, and pollution, resulting in altered ecological conditions. Hence, the development of cost-effective methods for biodiversity monitoring at large scale is an urgent global imperative [Citation1]. However, large-scale ecological monitoring is challenging because it often relies on heterogeneous data collected at limited spatial and temporal scales [Citation2]. Several new technologies have been developed to meet the challenges of monitoring biodiversity change across ecosystems globally, including acoustic monitoring [Citation3]. This strategy is increasingly being applied to questions regarding ecosystem functioning across landscapes and offer a particularly promising approach for long-term, multiscale biodiversity-monitoring programs [Citation4]. This is theoretically feasible because, in most ecosystems, a large portion of animals from many different taxa emit sounds for territory defense, mate attraction, predator dissuasion, navigation, foraging, and maintenance of social groups [Citation5].
Large-scale acoustic monitoring relies on new disciplines such as soundscape ecology and ecoacoustics. Soundscape ecology examines the collection of anthropogenic, biological, and geological sounds of a soundscape, that vary over space and time [Citation6]. Ecoacoustics, investigates natural and anthropogenic sounds and their relationship with the environment over a wide range of study scales, both spatial and temporal, including populations, communities, and landscapes [Citation7]. Whereas bioacoustics infers behavioral information from intra- and interspecific signals, ecoacoustics investigates the ecological role of sound at higher organizational units from population and community up to landscapes [Citation8]. In this sense, sound is understood as a core ecological component and therefore indicator of ecological status (source of information) [Citation8].
Acoustic monitoring seeks to infer particular aspects of biodiversity at these higher levels of organization, through collection and analysis of large-scale acoustic recordings. Traditional aural analysis, i.e. listening large recording data sets by and experienced researcher is unfeasible; therefore, it is necessary to summarize acoustic information. Acoustic indices are designed to capture the distribution of acoustic energy across time and/or frequency in a digital audio file of fixed length [Citation8]. To date, several acoustics indices have been developed [Citation3,Citation9–12, among others]. However, the successful use of acoustic monitoring rests not only on developing indices, but also in demonstrating their predictive value of particular aspects of biodiversity or ecological condition [Citation8].
Acoustic indices have been found to reflect vocal species diversity and abundance, community composition, vegetation structure, habitat type, human activity, and ecological condition in terrestrial and aquatic habitats [Citation13]. Some indices, for example, are constructed assuming that species richness in a given community will produce a greater variety of signals, resulting in greater acoustic diversity [Citation3,Citation13,Citation14]. Several of these indices are designed to estimate amplitude (intensity), evenness (distribution of acoustic energy), richness (number of entities), and heterogeneity of the acoustic community [Citation13].
Results from studies on the relationship between acoustic indices with traditional biodiversity measures (for example from bird sampling) have been promising, but not fully consistent [Citation8,Citation15–17]. They demonstrate that current acoustic approaches could be potentially improved [Citation7]. Moreover, acoustic diversity can be influenced by sources of acoustic heterogeneity other than species richness, including variation in distance of animals to the sensors, inter- and intra-specific differences in calling patterns and characteristics, time, and frequency of overlap between sounds from different sources, or transitory or permanent background noise [Citation12–14,Citation18,Citation19].
On the other hand, soundscapes are an integrative measure reflecting characteristics of the biological community, its physical environment and the impacts of human activity [Citation6,Citation20,Citation21]. The analysis of an entire soundscape may produce valuable information on the dynamics of interactions between ecosystems and human activities [Citation22]. Some authors also have looked at soundscape measures as indicators of change in ecological condition with very favorable results [Citation16,Citation23–25]. Furthermore, soundscapes are considered good predictors of habitat type [Citation26,Citation27]. However, this is a relatively new approach, and more research is still needed in this area [Citation27].
It is imperative to understand whether information obtained with the use of acoustic indices accurately describes the ecological processes occurring within biodiversity components, in order to improve the current analytical tools, reduce bias, and generate a proper understanding of the ecosystem [Citation28]. For this reason, we evaluated several acoustic indices at two operational levels: (1) acoustic community level, using birds as examples to evaluate how well acoustic indices predict bird diversity indices; and (2) soundscape level, using acoustic indices to classify data according to the ecological condition of the study sites.
Methods
Study area
The study was conducted in two sites () within Braulio Carrillo National Park (BCNP, Costa Rica), selected based on degree of habitat alteration (see below). The sites were named “Quebrada” (10 ° 09ʹ42.35” N; 83 ° 56ʹ16.11” W; contiguous to Highway 32, and open to tourism activities) and “Ceibo” (10 ° 19ʹ14.25” N; 84 ° 04ʹ28.87” W; ~20 km from Highway 32, and ~10 km from any other paved road, and used only for research). These sites were classified within the life zone “Very Humid Tropical Forest Transition to Premontane” [Citation29] with an altitude between 500 and 600 m a.s.l [Citation30].
Figure 1. Location of “Ceibo” and “Quebrada” study sites within the Braulio Carrillo National Park, Costa Rica, 2017–2018
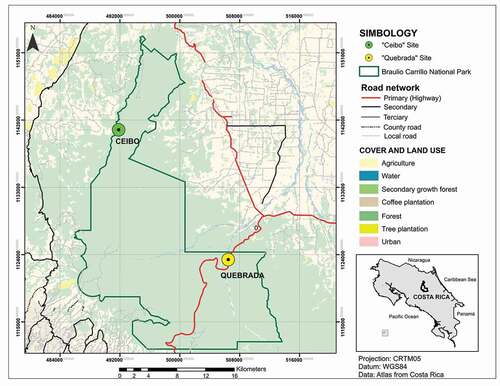
The BCNP is crossed by the Highway 32, a national highway of high vehicular traffic connecting the Central Valley with the Caribbean coast. This road was constructed in 1977 and, as a result, forest was opened in a radius of up to 1 km to allow machinery passing and to storage materials for construction. To avoid further destruction of the forest, the national park was created in 1978 [Citation31].
Study sites were different according to both the vegetation structure complexity and noise level related to road traffic [Citation32]. Ceibo showed higher density of trees with a diameter at breast height (DBH) of more than 5 cm, and shrubs with a DBH of 1–5 cm, and higher complexity of forest structure (both vertically and horizontally). In contrast, Quebrada showed more open vegetation structure than Ceibo, with larger gaps both vertically and horizontally [Citation32].
Sampling design
At each study site, we located 12 sampling points, separated by 200 m from each other, on already available trails. We used this distance to avoid the superposition of sounds between two adjacent recording points, ensuring a good spatial sampling of the soundscape [Citation33]. We conducted four visits to each site from June 2017 to August 2018, alternating between sites to ensure a representative sample of the events occurring throughout the year.
Soundscape survey
We placed 12 Song Meter Digital Field Recorders 2 Plus (SM2 +; Wildlife Acoustics Inc.), one at each sampling point and study site within the BCNP. We installed the recorders on the central tree of each sampling point, at an approximate height of 1.30 m. Two omnidirectional microphones were plugged to each recorder, so the recording was made through two channels (in stereo). The quality of the digital audio was compact disc with a sampling rate or frequency of 44.1 kHz and 16 bits of resolution. Audio files were recorded in Microsoft Wave format (.wav) and stored on 64 GB capacity SDHC memory cards.
The recorders were programmed to make continuous recordings during bird activity peaks (4:00–6:59 am, and 15:00–17:59 pm) and for 10-minute periods at the beginning of each hour during the rest of the day. This recording scheme was implemented for two consecutive days during each visit to each study, for a total of four separate visits to each study site.
Soundscape recordings were previewed aurally and visually to facilitate identification of undesired noise such as heavy rain in the audio file, using the Adobe Audition CC v.6 program. We did not consider for analysis those minute tracks showing heavy rains and finalized with a total of 708 h in Ceibo and 643 h in Quebrada. Additionally, we searched for sound data corresponding to the exact same time periods as the bird point counts.
We analyzed soundscape recordings using 11 of the most commonly used acoustic indices [Citation34] because they represent different components of the soundscape (, Appendix A). The acoustic indices ACI, ADI, AEI, and BIO were calculated using a maximum frequency of 11,000 Hz to account for high frequency bird vocalizations. All acoustic indices were calculated for one-minute recording fragments and averaged for each study site, sampling point and hour of the day (4:00 am to 17:00 pm).
Table 1. Description of bird and acoustic indices calculated for each sampling point at Ceibo and Quebrada sites, Braulio Carrillo National Park, Costa Rica, 2017–2018
Bird community survey
At each study site, we established 12 bird point counts, to collect bird data as an independent data set for analysis (Appendix B). We located the bird point counts 20 m apart from the location of the recorders, to avoid interference during recording times. We conducted two daily counting sessions (4 counts per visit), working during peak hours of bird activity (~6:00–8:00 and ~14:00–16:00). At each point, we recorded the species abundance detected visually and aurally during six minutes in a radius of 25 m, obtaining four bird indices for each sampling point (). However, we caution about bird measures we used because they represent the observed assemblages of bird species during the bird point counts, but not represent actual bird parameters estimated for the site.
Data analysis
We first assessed pair-based correlation of each bird index with each acoustic index, using Spearman correlation with a Bonferroni correction to account for family-wise error rates. Additionally, we used the group of acoustic indices to examine if they were good predictors of bird indices. We fitted a random forest regression [Citation37] to each bird index using the 11 acoustic indices and a two-level factor variable for study site as predictors. We split the data into 80 % for training and 20 % for testing each model. We evaluated the performance of each random forest regression with three metrics: (1) normalized mean absolute error (nmae), (2) normalized root mean square error (nrmse), and (3) coefficient of determination (rsquared).
To assess if acoustic indices were good predictors for site classification, we used a random forest classifier [Citation37]. Two sites with different levels of anthropogenic perturbation were considered: (1) the site with high level of anthropogenic perturbation (Quebrada) and (2) the site with low level of anthropogenic perturbation (Ceibo). We used a repeated cross validation of 10 folds, which were repeated five times, to evaluate the performance of the model. The variable importance assessment for the random forest classifier was done by permutation [Citation38].
Statistical analyses were conducted in R [Citation39]. To obtain acoustic indices, we used the following packages for R: Sinax (https://github.com/osoramirez/Sinax2), Soundecology version (1.3.3) [Citation40] and Seewave (version 2.0.5) [Citation41]. We analyzed bird data obtained by point count with the Biodiversity package [Citation42] for R (version 2.9–2). Random forest for regression and binary classification were performed using the Caret package [Citation43] for R (version 6.0–83).
Results
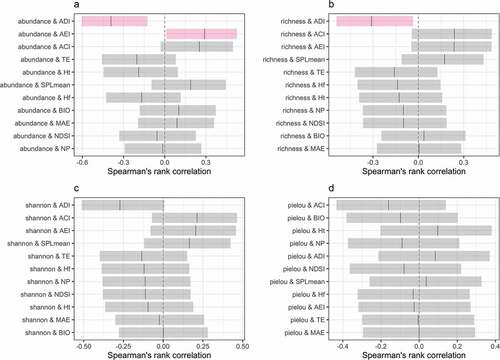
In general, most correlations among bird indices and acoustic indices were not strong, but there was a significant negative correlation (p < 0.0045) of acoustic diversity with bird abundance and bird richness. In contrast, acoustic evenness showed a statistically significant (p < 0.0045) positive relationship to bird abundance ().
Figure 2. Correlation analysis of acoustic indices and bird indices at Ceibo and Quebrada sites, Braulio Carrillo National Park, Costa Rica, 2017–2018
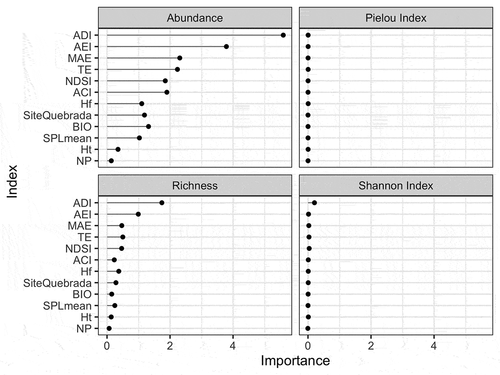
The random forest regression for the bird indices presented a low performance, with low values of the coefficient of determination (rsquared), and high error values, when considering the normalized root mean square error (). Furthermore, the importance assessment analysis showed that the set of acoustic indices used was not a good predictor of bird indices, although diversity and entropy indices showed a better performance related to bird abundance and richness ().
Figure 3. Normalized mean absolute error (nmae), coefficient of determination (rsquared), and normalized root mean square error (nrmse) for random forest regression on four bird indices (abundance, richness, Pielou Evenness Index, and Shannon Diversity Index) at Ceibo and Quebrada sites, Braulio Carrillo National Park, Costa Rica, 2017–2018
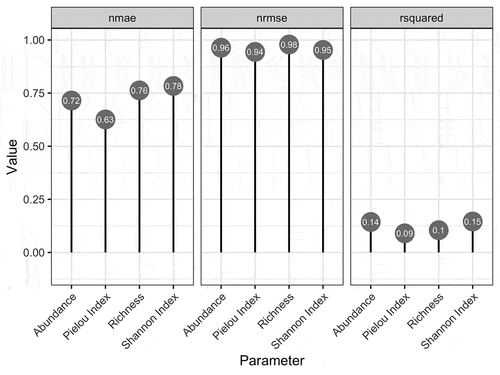
Figure 4. Variable importance for random forest regression on four bird indices (abundance, richness, Pielou Evenness Index, and Shannon Diversity Index) at Ceibo and Quebrada sites, Braulio Carrillo National Park, Costa Rica, 2017–2018
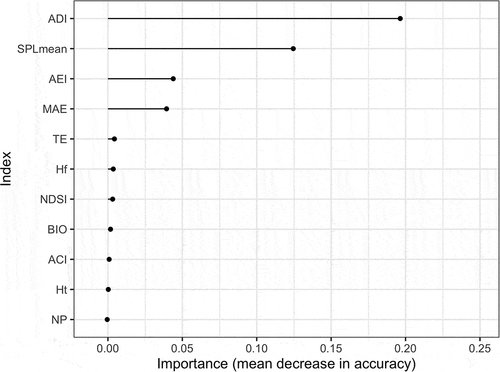
The acoustic indices classified the sites with high accuracy (mean accuracy of 0.93, sd = 0.08). The variable importance assessment for the random forest classifier indicated that the acoustic diversity index was the most important predictor ().
Figure 5. Variable importance for the random forest classifier for two sites with two different level of anthropogenic perturbation based on 11 acoustic indices at Ceibo and Quebrada sites, Braulio Carrillo National Park, Costa Rica, 2017–2018
Discussion
We found pair-wise correlations between some acoustic indices and bird abundance or richness; however, the whole set of acoustic indices predicted bird indices weakly, in contrast to our expectations. This is an unexpected result considering that it has been stated frequently that compound indices show superior performance over single indices to predict species richness [Citation8,Citation12,Citation44,Citation45]. For example, Eldridge et al. [Citation8] concluded that compound indices were stronger predictors of bird species richness than any single index in the United Kingdom, using multivariate random forest regression analysis. Additionally, Buxton et al. [Citation45] concluded that random forest models with a set of acoustic indices as covariates predicted Shannon diversity, richness, and the total number of biological sounds with high accuracy. We would like to acknowledge, however, that the data analyzed correspond to short time frames (where both sampling methods were applied concomitantly) and would need to be validated for extended periods.
Two factors might explain differences between our findings and other studies. They detected animal sounds aurally from the recordings used to calculate acoustics indices [Citation8,Citation45]. Alternatively, they considered biological sounds from different sources, including birds, mammals, and insects [Citation45]. However, we used an independent data set for birds using bird point counts. We reason that some circularity might occur when using the same data to compare approaches; thus, using an independent bird data set could be a more rigorous approach. Additionally, we must acknowledge that acoustic indices are not fundamentally species-specific and may represent various components of a soundscape [Citation46]. Moreover, the ability of acoustic indices to predict bird diversity may be affected by their sensitivity to other factors (such as insects, background noise, anthrophonies, among others) [Citation34,Citation47].
We found that the Acoustic Diversity Index and the Acoustic Evenness Index had better performance than other acoustic indices to predict bird indices. These indices have also shown good performance for predicting bird richness [Citation48] and abundance [Citation49] in other studies. Nevertheless, the pattern of both indices concerning bird indices was unexpected, given that a higher bird diversity, but a lower acoustic diversity, was found in this same study area [Citation32]. This finding is unexpected considering the assumption that acoustic energy distributes to a broader range of frequencies with increasing numbers of species in an acoustic community [Citation50]. However, this assumption is only true if the energy of the biophony sounds (the vocalizations of different animal species) are evenly distributed across all frequency bands analyzed [Citation51].
This pattern was also noted by Eldridge et al. [Citation8], who argued that the assumption that acoustic energy distributes to a broader range of frequencies with increasing numbers of species in an acoustic community applied in the range of frequencies mostly used by birds (around 2–8 kHz), where acoustic energy was more likely to be evenly distributed (resulting in a lower AEI value, as the index is counterintuitive) when the number of species increased. Eldridge et al. [Citation8] reasoned that in a broader frequency range, the inverse prediction could be observed (the higher the number of species, the higher the value of AEI, interpreted as a less even distribution of acoustic energy). This is because, as the acoustic energy of bird vocalizations becomes concentrated in the mid-frequency range, it increases the contrast with the upper and lower part of the spectrum, where bird activity is less common. Bradfer-Lawrence et al. [Citation51] demonstrated that this pattern was consistent across multiple habitat types. Thus, sites with higher avian species richness and abundance may also have less even soundscapes. This observation is coherent with the results found in this study and with other authors [Citation8,Citation52].
We did not find evidence of a correlation between bird indices evaluated and acoustic indices ACI, NDSI, Ht, Hf, NP, SPLmean, and BIO. This result suggests that these indices could be influenced by other sound sources and, therefore, be less specific to estimate bird indices. This finding was expected to some extent, given that tropical soundscapes are composed not only of bird biophonies but also those of insects or amphibians, among others. This complexity might be reflected in acoustic indices [Citation53]. For example, the acoustic complexity index acts as an event detector reflecting effective biological activity, which does not necessarily represents a more diverse bird community [Citation8]. The influence of other sources of biological activity with rapid acoustic modulation, such as insects, or even the presence of highly dominant bird species, may influence the values of the index [Citation9,Citation49], affecting the level of correlation between ACI and bird diversity [Citation49]. Additionally, in urban or disturbed habitats, ACI is sensitive to certain anthropogenic noises [Citation19] and geophonies, such as rain and wind [Citation17], making it difficult to find a real correlation with bird indices [Citation17,Citation19].
All these non-targeted sounds could have some effect on the results, considering that acoustic recorders generally pick up sounds at distances greater than the detection radius used for the bird point counts [Citation54]. Although most of the recorded acoustic energy is expected to come from sources closest to the recorder, due to sound attenuation [Citation55], there may still be some distant noises that affect the index values. Indeed, it has been shown that the performance of acoustic index models might be negatively affected by insects, weather conditions, and anthropogenic sounds [Citation45]. In our case, one of the study sites was located near the main highway and withstood high and consistent levels of antrophonies by vehicular traffic. Moreover, there were differences in vegetation structure and complexity between study sites [Citation32] that might affect the propagation of acoustic signals and account for additional differences in the soundscape, such as wind, ambient noise, signal attenuation, and degradation [Citation51,Citation56].
Nevertheless, we found a set of eleven acoustic indices to accurately classify the study sites according to their ecological condition. These results were consistent with other studies that found soundscapes measures were good indicators of change in ecological condition [Citation16,Citation23–25]. This result is not surprising if we consider that soundscapes are an integrative measure reflecting characteristics of the acoustic community, the physical environment, and the effects of human activity [Citation6,Citation20,Citation21]. Indeed, tropical soundscapes provide a complex and complete measure of biodiversity; their traits and function cannot be uniquely attributed to only one biophonic component, such as birds. Therefore, analysis of an entire soundscape could produce valuable information on the dynamics of ecological systems [Citation22]. Other authors expanded this idea, by using acoustic indices to identify habitat types as a new complementary tool, which alerted if new samples taken in these habitats were distant to the prototype conditions [Citation26]. Following this line, Do Nascimento et al. [Citation27] recorded soundscapes and collected vegetation data in 143 sites in six natural and two human-modified habitats in Viruá National Park, Brazil. They found that each habitat type had unique and predictable soundscapes; random forest models were 74% accurate at predicting eight habitat types and 87% accurate at predicting three broader habitats categories.
Additionally, the Acoustic Diversity Index was the most important predictor for the random forest classifier in our study, in contradiction with Eldridge et al. [Citation8], who question the assumption of acoustic diversity as a proxy for habitat health. Our results agreed with other studies, even though they used different methodological approaches. For example, Ng et al. [Citation25] found a significant correlation between AEI, ADI, and H with a BioCondition Score that discriminated among woodland condition types (cleared, regrowth, and remnant). In addition, Fuller et al. [Citation16] reported in their study that AEI, H, and NDSI best connected the soundscape with landscape characteristics, ecological condition, and bird species, suggesting that remote soundscape assessment may be implemented as an ecological monitoring tool in fragmented Australian forest landscapes.
Our study provides evidence on the relationship of acoustic indices with birds indices using data from bird point counts instead of species identification directly from the recordings, as is typically done. Even if we did find some associations between individual acoustic indices and some bird descriptors at the species or community level, we argue that tropical soundscapes are highly complex and portray comprehensive ecological patterns and processes that cannot be simply attributed to one or few of their biodiversity components.
However, we found very promising results relating ecological conditions to soundscape characteristics in a tropical rainforest. This is a key finding for monitoring purposes of important tropical ecosystems in the face of land use or climate change, and to readily and robustly inform conservation and management actions. We conclude that acoustic technologies can provide a cost-effective surrogate for monitoring ecological conditions in tropical forests, and efficiently complement other traditional sources of field information.
Authors contribution
MRI and ORA designed this research. DSS, ORA and MRI conducted field work and data collection. MSP, ORA, MRI and JBM were in charge of data management and statistical analysis. All authors contributed to the interpretation of results, discussion and writing of this manuscript.
Acknowledgments
We thank the parkguards of “Sector Quebrada González” and “Puesto El Ceibo”, Braulio Carrillo National Park, for their collaboration during field work and the students of the National University who helped us to collect data in the field. We thank to Christopher Vaughan for proof reading of the manuscript and recommendations. In memory of our friend and colleague, Oscar Ramírez Alán.
Disclosure statement
No potential conflict of interest was reported by the author(s).
Additional information
Funding
References
- Newbold T, Hudson LN, Hill SLL, et al. Global effects of land use on local terrestrial biodiversity. Nature. 2015;520(7545):45–50.
- Pereira HM, Navarro LM, Martins IS. Global biodiversity change: the bad, the good, and the unknown. Annu Rev Environ Resour. 2012;37:25–50.
- Sueur J, Pavoine S, Hamerlynck O, et al. Rapid acoustic survey for biodiversity appraisal. PLoS One. 2008;3:4065.
- Blumstein DT, Mennill DJ, Clemins P, et al. Acoustic monitoring in terrestrial environments using microphone arrays: applications, technological considerations and prospectus. J Appl Ecol. 2011;48:758–767.
- Bradbury JW, Vehrencamp SL. Principles of animal communication. 2nd ed. Sunderland (MA): Sinauer Associates; 2011.
- Pijanowski BC, Villanueva-Rivera LJ, Dumyahn SL, et al. Soundscape ecology: the science of sound in the landscape. BioSci. 2011;61(3):203–216.
- Sueur J, Farina A. Ecoacoustics: the ecological investigation and interpretation of environmental sound. Biosemiotics. 2015;8(3):493–502.
- Eldridge A, Guyot P, Moscoso P, et al. Sounding out ecoacoustic metrics: avian species richness is predicted by acoustic indices in temperate but not tropical habitats. Ecol Indic. 2018;95(1):939–952.
- Pieretti N, Farina A, Morri D. A new methodology to infer the singing activity of an avian community: the acoustic complexity index (ACI). Ecol Indic. 2011;11:868–873.
- Villanueva-Rivera LJ, Pijanowski BC, Doucette J, et al. A primer of acoustic analysis for landscape ecologists. Landsc Ecol. 2011;26(9):1233–1246.
- Kasten EP, Gage SH, Fox J, et al. The remote environmental assessment laboratory’s acoustic library: an archive for studying soundscape ecology. Ecol Inform. 2012;12:50–67.
- Towsey M, Wimmer J, Williamson I, et al. The use of acoustic indices to determine avian species richness in audio-recordings of the environment. Ecol Inform. 2014;21:110–119.
- Sueur J, Farina A, Gasc A, et al. Acoustic indices for biodiversity assessment and landscape investigation. Acta Acust. 2014;100:772–781.
- Gasc A, Sueur J, Pavoine S, et al. Biodiversity sampling using a global acoustic approach: contrasting sites with microendemics in New Caledonia. PLoS One. 2013;8:e65311.
- Boelman NT, Asner GP, Hart PJ, et al. Multi-trophic invasion resistance in Hawaii: bioacoustics, field surveys, and airborne remote sensing. Ecol Appl. 2007;17:2137–2144.
- Fuller S, Axel AC, Tucker D, et al. Connecting soundscape to landscape: which acoustic index best describes landscape configuration? Ecol Indic. 2015;58:207–215.
- Mammides C, Goodale E, Dayananda SK, et al. Do acoustic indices correlate with bird diversity? Insights from two biodiverse regions in Yunnan Province, south China. Ecol Indic. 2017;82:470–477.
- Depraetere M, Pavoine S, Jiguet F, et al. Monitoring animal diversity using acoustic indices: implementation in a temperate woodland. Ecol Indic. 2012;13(1):46–54.
- Fairbrass AJ, Rennett P, Williams C, et al. Biases of acoustic indices measuring biodiversity in urban areas. Ecol Indic. 2017;83:169–177.
- Matsinos YG, Mazaris AD, Papadimitriou KD, et al. Spatiotemporal variability in human and natural sounds in a rural landscape. Landsc Ecol. 2008;23:945–959.
- Joo W, Gage SH, Kasten EP. Analysis and interpretation of variability in soundscapes along an urban-rural gradient. Landsc Urban Plan. 2011;103: 259–276.
- Qi J, Gage SH, Joo W, et al. Soundscape characteristics of an environment: a new ecological indicator of ecosystem health. In: Ji W, editor. Wetland and water resource modeling and assessment. New York (NY): CRC Press; 2008. p. 201–211.
- Tucker D, Gage S, Williamson I, et al. Linking ecological condition and the soundscape in fragmented Australian forests. Landsc Ecol. 2014;29:745–758.
- Burivalova Z, Towsey M, Boucher T, et al. Using soundscapes to detect variable degrees of human influence on tropical forests in Papua New Guinea. Conserv Biol. 2018;32:205–215.
- Ng M, Butler N, Woods N. Soundscapes as a surrogate measure of vegetation condition for biodiversity values: a pilot study. Ecol Indic. 2018;93:1070–1080.
- Gómez WE, Isaza CV, Daza JM. Identifying disturbed habitats: a new method from acoustic indices. Ecol Inform. 2018;45:16–25.
- Do Nascimento L, Campos-Cerqueira M, Bearda K. Acoustic metrics predict habitat type and vegetation structure in the Amazon. Ecol Indic. 2020;117:106679.
- Moscoso P. The use of acoustic analyses to evaluate ecological and social impacts of habitat degradation in contemporary conservation biology [dissertation]. Sussex (UK): University of Sussex; 2018.
- Holdridge L. Life zone ecology. San José (Costa Rica): Centro Científico Tropical; 1967.
- TEC. Atlas de Costa Rica. Repositorio TEC [Internet]. 2014 [cited 2018]. Available from: https://repositoriotec.tec.ac.cr/handle/2238/6749?show=full
- Oviedo PE, Hernández AA, Fournier L. Caracterización de la vegetación alrededor de los senderos del sector Quebrada González, Parque Nacional Braulio Carrillo, Costa Rica. Uniciencia. 2009;23(1):41–49.
- Retamosa-Izaguirre MI, Segura-Sequeira D, Barrantes-Madrigal J, et al. Vegetation, bird and soundscape characterization: a case study in Braulio Carrillo National Park, Costa Rica. Biota Colomb. 2021;22(1):57–73.
- Farina A, Pieretti N, Piccioli L. The soundscape methodology for long-term bird monitoring: a Mediterranean Europe case-study. Ecol Inform. 2011;6:354–363.
- Sánchez‐Giraldo C, Bedoya CL, Morán‐Vásquez RA, et al. Ecoacoustics in the rain: understanding acoustic indices under the most common geophonic source in tropical rainforests. Remote Sens Ecol Conserv. 2022;6(3):248–261.
- Shannon CE, Weaver W. A mathematical model of communication. Urbana (IL): University of Illinois Press; 1949.
- Pielou EC. The interpretation of ecological data: a primer on classification and ordination. New York (NY): Wiley; 1984.
- Breiman L. Random Forests. Mach Learn. 2001;45(1):5–32.
- Liaw A, Classification WM. Regression by randomForest. R News. 2002;2(3):18–22.
- R Core Team. R: a language and environment for statistical computing [software]. Version 3.6. Vienna (Austria): R Foundation for Statistical Computing; 2020.
- Villanueva-Rivera LJ, Pijanowski BC. Soundecology: soundscape ecology. R Package Version. 2018;1(3):3.
- Sueur J, Aubin T, Simonis C. Seewave, a free modular tool for sound analysis and synthesis. Bioacoustics. 2008;18(2):213–226.
- Kindt R, Coe R. Tree diversity analysis: a manual and software for common statistical methods for ecological and biodiversity studies. World Agrofor Cent. Vol 1. 2005. 207 p.
- Kuhn M. Caret: classification and Regression Training [online software]. version 6.0–86. Astrophysics Source Code Library; 2020.
- Wimmer J, Towsey M, Roe P, et al. Sampling environmental acoustic recordings to determine bird species richness. Ecol Appl. 2013;23(6):1419–1428.
- Buxton R, McKenna M, Clapp M, et al. Efficacy of extracting indices from large-scale acoustic recordings to monitor biodiversity. Conserv Biol. 2018;32(5):1174–1184.
- Ross SRJ, Friedman NR, Yoshimura M, et al. Utility of acoustic indices for ecological monitoring in complex sonic environments. Ecol Indic. 2021;121:107114.
- Farina A. Ecoacoustics: a quantitative approach to investigate the ecological role of environmental sounds. Math. 2018;7(1):21.
- Machado RB, Aguiar LMDS, Jones G. Do acoustic indices reflect the characteristics of bird communities in the savannas of Central Brazil? Landsc Urban Plan. 2017;162: 36–43.
- Retamosa M, Ramírez-Alán O, De La OJ. Acoustic indices applied to biodiversity monitoring in a Costa Rica dry tropical forest. J Ecoacoust. 2018;2: TNW2NP.
- Sueur J. Cicada acoustic communication: potential sound partitioning in a multispecies community from Mexico (Hemiptera: cicadomorpha: cicadidae). Biol J Linnean Soc. 2002;75(3):379–394.
- Bradfer-Lawrence T, Bunnefeld N, Gardner N, et al. Rapid assessment of avian species richness and abundance using acoustic indices. Ecol Indic. 2020;115:106400.
- Gage SH, Farina A. Ecoacoustics challenges. In: Ecoacoustics: the ecological role of sounds. Farina A., Gage, SH. Editors. Oxford (UK): Wiley. 2017. p. 313–320.
- Aide TM, Hernández-Serna A, Campos-Cequeira M, et al. Species richness (of insects) drives the use of acoustic space in the tropics. Remote Sens. 2017;9:1096.
- Darras K, Pütz P, Rembold K, et al. Measuring sound detection spaces for acoustic animal sampling and monitoring. Biol Conserv. 2016;201:29–37.
- Royle JA. Modelling sound attenuation in heterogeneous environments for improved bioacoustic sampling of wildlife populations. Methods Ecol Evol. 2018;9(9):1939–1947.
- Slabbekoorn H. Habitat-dependent ambient noise: consistent spectral profiles in two African forest types. J Acoust Soc Am. 2004;116(6):3727–3733.