
 ?Mathematical formulae have been encoded as MathML and are displayed in this HTML version using MathJax in order to improve their display. Uncheck the box to turn MathJax off. This feature requires Javascript. Click on a formula to zoom.
ABSTRACT
Seven oceanographic expeditions were carried out between 2013 and 2018 to explore the taxonomic diversity and ecological attributes of copepods of the Caribbean Oceanic Ecoregion (CAO). One hundred and forty zooplankton samples were collected in four depth ranges, between 0 and 1000 m depth. A total of 133 species were identified, 33 of which are new records for the Colombian Caribbean Sea and 50 species have amplified their geographical distribution. This information increasing the list of species of marine copepods recorded for the Colombian Caribbean Sea from 214 to 247 species. Carnivorous species (32.33%) and herbivorous-omnivorous species (27.06%) were the most important trophic guilds in the CAO ecoregion, due to the fact that it is an oligotrophic system that presents low productivity where regenerated production can occur. This study obtained relevant information on the richness and diversity of copepods in the offshore system, providing key information to describe the ecological processes and increase knowledge in this important taxonomic group.
Introduction
More than 2000 species of free-living copepods have been described in the world oceans, of which 724 species have been recorded for the southwest Atlantic in the Antilles Sea, Gulf of Mexico, Caribbean, Florida and Sargasso Sea [Citation1,Citation2]; 468 for the Caribbean Sea [Citation3,Citation4] and for the south-eastern sector, which is part of the Colombian Caribbean, 214 species were recorded (86 neritic, 84 oceanic and 44 both) [Citation5]. The families Clausocalanidae, Centropagidae, Oncaeidae, Pontellidae, Paracalanidae, Sapphirinidae, Euchaetidae, Augaptilidae Corycaeidae and Oithonidae are most frequent and abundant in the epipelagic ecosystem, while Augaptilidae, Heterorhabdidae, Lucicutiidae, Bathypontiidae, Nullosetigeridae, Aetideidae, Aegisthidae and Oncaeidae are dominant in the mesopelagic ecosystem [Citation6].
Table 1. Kruskal–Wallis test the influence of depth range sampling conditions on abundance, species richness and diversity of copepods in offshore waters of Colombian Caribbean. ** = Highly significant (P < 0.001). N: Abundance (ind. 100 m−3), S: Richness, H’: Shannon diversity index, J’ = Pielou uniformity index and Lambda’: Simpson dominance index
Studies on planktonic communities in the oceanic province in the mesopelagic and bathypelagic domains are scarce in comparison to the neritic waters; Several studies highlighted the high abundance and diversity of zooplankton, especially of the copepod assemblage in waters of the Caribbean and adjacent areas [Citation3,Citation7,Citation8]. Specific assemblages for oceanic, mixed and neritic waters were defined in 1983, as well as some common species for the northern, central and southern zones [Citation9]. The oceanic community of copepods was characterized down to 200 m depth in 2010, defining a close relationship between distribution and abundance with current patterns and cyclonic circulation [Citation10]. The vertical structure, size variability and trophic habits of oceanic zooplankton were evaluated at three locations between 0 and 600 m, concluding that the vertical structure of copepods changes in each locality (north, centre and south)().
Abundance decreased with increasing depth, size variability was less in the central zone and there is a classic marine trophic web with continental contributions [Citation11]. Abundance, size spectra and diversity of zooplankton taxa were found to be different between two climatic seasons (transition season of 2008 and rainy of 2009), and there were differences in abundance between the northern, central and southern zones. These changes were related to the moderate upwelling and the activity of mesoscale eddies. Stratification, oxygen and chlorophyll-a were the most important predictors of zooplankton abundance and size [Citation12].
Taxonomic diversity indices have been recognized as a key element in the general understanding of global biodiversity patterns, mainly to identify the species present [Citation13–15]. Their biological and ecological roles might even be of greater importance in ecosystem studies and processes [Citation13,Citation14]. The average taxonomic distinction indice (+) and average taxonomic variation (
) assess the weight of taxonomic differences between species based on the presence/absence of species in a sample against a reference list of species [Citation15]. They are independent of sample size and sampling effort, thus allowing comparison of species distribution temporally or spatially [Citation15–19]. This tool is used to explain variation in terms of community structure and function, and to relate them to ecosystem processes in the marine and freshwater plankton [Citation19,Citation20].
There is still no quantitative analysis in Colombia that integrates information on ecological attributes and diversity indices for the copepod assemblages that inhabit the epipelagic and mesopelagic ecosystems of the Caribbean Oceanic (CAO) ecoregion, which points to a significant information gap in this area. Considering the key role of copepods as the most abundant group in marine zooplankton and the main link between primary producers and secondary consumers in marine ecosystems, it is important to use ecological analysis that is expected to improve the understanding of zooplankton functionality, structure, diversity and the forces that influence them. We present here the first comprehensive survey of offshore copepods between 0 and 1000 m depth in the Caribbean Sea. The aim of this study was to calculate taxonomical diversity indices and to describe some ecological and morphological features, such as trophic regime, vertical distribution, habitat and size, as a first approach to the functional analysis of copepods species in the offshore ecosystem of the Colombian Caribbean Sea.
Methods
Study area
The Caribbean Sea, a semi-enclosed basin part of the Atlantic Ocean, is delimited by Central America to the west and South America platforms to the south, and the chain of Islands that form the Island arc of the Antilles to the east and north. It has an average depth of 2490 m and a maximum of 7686 m in the Cayman Trench that separates the North American plate from the Caribbean plate. This geographical area is divided into four deep basins, separated by submarine ridges – Granada, Venezuela, Yucatán and Colombia [Citation21–23]. The CAO includes the territorial ocean waters beyond the continental shelf and reaches the Exclusive Economic Zone of Colombia, where depths ranging from 130 m to 4200 m are found; it is geographically located between latitudes 17º N and 9º N and longitudes 83º W and 70º W. Its biodiversity is little known and some areas stand out for their moderately high productivity due to upwelling processes and mesoscale gyrations [Citation23–26].
Sampling and laboratory analysis
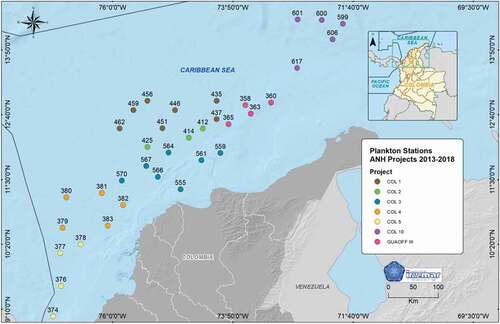
Oceanographic expeditions were carried out in CAO between 2013 and 2018, in the framework of the inter-institutional agreements between the Marine and Coastal Research Institute (INVEMAR) and Agencia Nacional de Hidrocarburos (ANH). Seven hydrocarbon exploration areas were sampled: GUAOFF 3, COL 1, COL 2, COL 3, COL 4, COL 5 and COL 10. A total of 144 samples of zooplankton were collected in 36 stations located in oceanic waters of the Colombian Caribbean, from the northeast to southwest (, Supplemental material 1). Six (6) areas were sampled in rainy season and 1 in dry season (COL 1) (Supplemental material 1)
Figure 1. Study area in the Colombian Caribbean Sea with the location of the zooplankton sampling stations for the years 2013–2018
The zooplankton samples were mainly collected during a diurnal period (6:00–16:00) in the rainy period (October–November), by vertical trawls of zooplankton (net of 200 µm, 0.6 m mouth diameter and Hydrobios flowmeter) at four different depth ranges (0–60 m, 70–140 m, 170–340 m, 540–1000 m) using a General Oceanics close-open-close system. The samples were relaxed in situ with 10% magnesium chloride and fixed with 4% normalized formalin. In the Marine Museum of Natural History of Colombia (MHMNC) of INVEMAR the organisms were identified to the species level by microdissection of morphological structures, including antennae, jaws, maxillae, swimming legs and genital segments. Abundances were determined for mature specimens, with all their segments and reproductive structures. Juvenile stages (copepodites), moults or exoskeletons of advanced stages were not considered. Specific taxonomic keys were followed for species identification [Citation1,Citation2,Citation6,Citation27–31]. The identified organisms were deposited in the MHNMC reference collection.
A quantitative and qualitative analysis was performed to evaluate the structure of the copepod assemblage. We calculate the density of organisms with the standardised abundances of individuals per cubic meter (ind.m−3) [Citation32]. For the taxonomic diversity indices, the systematic list of species and their density (ind.m-3) were integrated into a taxonomic aggregation matrix, species counts were separated by depth. For the calculation of the diversity indices, the raw data without transformation were used.
Species composition
A taxonomic inventory of copepod species was made showing the ecoregions inhabited by the species and the depth range in which they were found. The new records for the study area were based on the previous lists of copepod species recorded for CAO [Citation4,Citation5]. The supplementary ecological features and morphological characters (vertical-horizontal distribution, trophic regime, size range) were compiled from the online databases WoRMS [Citation33], Ocean Biogeographic Information System OBIS [Citation34], Marine copepods database [Citation2] and from Hidalgo et al. [Citation35].
To estimate the possible number of species to be found in the oceanic environment, cumulative species curves were constructed using the non-parametric Chao 2, Jackknife 2 and Booststrap richness estimators, applying at least 1000 interactions per model. All these estimates were carried out with routines of the PRIMER 7 package [Citation36].
Ecological features and size
To analyse the functional diversity, each species listed in the taxonomic inventory was categorized using the ecological features and morphological characters proposed by Palacios [Citation18]. These characters were defined from secondary information on each species; the traits used for analysis are shown as follows:
A. Vertical distribution in the water column: Epipelagic (Epi) inhabits water from 0–200 m, Mesopelagic (Meso) inhabits water from 200–500 m and Bathypelagic (Bat) inhabits water below 500 m [Citation37,Citation38Citation39].
B. Habitat distribution: Coastal (C): inhabits coast edges, Estuarine (E): inhabits estuarine water bodies, Neritic (N): inhabits the continental platform, Oceanic (O): inhabits open sea [Citation2,Citation6,Citation27].
C. Trophic regime: Carnivore (Carn), Detritivore (Detri), Herbivore (Herb), Omnivore (Omn), unknown [Citation2,Citation6,Citation27].
Omnivore (Omn), unknown [Citation2, Citation6, Citation27].
D. Size range: ≤ 1 mm, ≥ 1 ≤ 2 mm, ≥ 2 ≤ 5 mm, ≥ 3 ≤ 5 mm, ≥ 5 mm [Citation36,Citation40,Citation41].
Taxonomic diversity
Taxonomic and ecological indices were calculated with the TAXDTEST and Diversity routines included in PRIMER v.7. To evaluate the degree of relationship and taxonomic variety of the copepod assembly, the average taxonomic distinction index (AvTD = Δ+) and the taxonomic distinction variation index (VarTD = Λ+) were used; these indices evaluate the taxonomic distance between each pair of individuals, defined through a Linnaean classification tree [Citation15,Citation16,Citation41,Citation42]. The list of species found in this study was compared with the inventory of 214 species recorded for the Colombian Caribbean waters by [Citation4,Citation5]. The values of AvTD and VarTD were obtained from an expected probability distribution with 95% confidence intervals generated by random simulations without replacement [Citation16,Citation36].
The AvTD (1) was calculated by adding the path length through the taxonomic tree to where all the pairs of species in the list converge, and dividing by the number of paths that are generated. This index is defined according to the following equation:
Where N is the number of species found in the sample and ωij is the weight of distinctness or distances between species i and j, which is given in the hierarchical classification where each level receives a proportional value from 0 to 100.
The VarTD (2) was calculated to estimate the dissimilarity between species in the taxonomic tree. This index takes into account the evenness of the distribution of the taxonomic level in the tree and calculates the asymmetry of the taxonomic tree. The variation index is explained below:
Biodiversity indices
Diversity indices were calculated based on copepod abundance to estimate changes in the composition of the assemblage. The Shannon diversity Equationequation (3)(3)
(3) was used to estimate the diversity of the community; this index varies between 0 and 5, being maximum when all taxa are represented by the same number of individuals [Citation43]. The uniformity of the samples was estimated using the Pielou index (4), whose maximum value is 1 if all species in a sample have the same abundance and decreases to zero as the abundances become less equitable [Citation44]. Finally, the Simpson’s Equationequation (5)
(5)
(5) was calculated to determine the dominance of the copepod assemblages, representing the probability that two randomly selected individuals in a sample belong to different species. The index ranges from 0 to 1, the higher this index, the higher the dominance of a species [Citation15,Citation16,Citation41,Citation42,Citation45]. The indices are defined according to the following equations:
Where H’ = Shannon diversity index, pi = the proportion of each i species and s = total number of species. J’ = Pielou index, log2 S = is the maximum diversity (H’max) that would be obtained if the distribution of abundances of the species in the community were perfectly equitable. 1-λ’ = Simpson index, ni = number of individuals of species i, and N = total number of species.
With these community descriptors, we performed non-parametric Kruskal-Wallis tests to analyse the hypothesis that richness (S), diversity (H’, J’ and λ’) and abundance (N) of copepods did not change significantly between depth strata (four levels). We then used post-hoc tests Tukey’s range test multiple comparisons to see which of these differences are significant in each descriptor.
Results
Species composition
The species accumulation curves calculated with non-parametric estimators Chao2, Jacknife2 and Bootstrap did not reach an asymptote, indicating an equitable species accumulation between the samples. In total, 133 copepod species were recorded in CAO with a range between 11 and 48 per season. The accumulation curves stabilized around 120 species with 100 samples, which means that the number of samples analysed (144) was significant, with 96% confidence intervals of means on the number of species observed for defining the assemblage in the CAO ecoregion ().
Figure 2. Species accumulation curve of copepods with Chao2, Jacknife2, Bootstrap and Sobs in the samples obtained in oceanic waters of Colombian Caribbean during 2013–2018
The most represented order was Calanoida, with 23 families, 47 genera and 89 species. The families with highest species richness were Aetideidae (15 species – 11.28%), Paracalanidae (10 species – 7.52%), Sapphirinidae (10 species – 7.52%), Augaptilidae (7 species – 5.26%), Candaciidae (6 species – 4.51%) and Corycaeidae (6 species – 4.51%). These six families accounted for 40.60% of the overall richness. Four species were notable for their high frequency of occurrence in more than 130 samples in all depth ranges: Clausocalanus furcatus, Macrosetella gracilis, Oithona setigera and Calocalanus pavo.
The copepod assembly increased with depth; the first range (0–60 m) had the lowest richness, with a mean of 28 (± 0.84) species. Paracalanidae with nine species was the family with the highest richness and Calocalanus pavo the most frequent species. The richness increased in the second range (70–140 m), with 33 ± 1.06 species; Paracalanidae and Sapphirinidae were the richest families with 8 species each and Calocalanus pavo and Copilia mirabilis the most frequent species of these families, respectively. The third range of depth (170–340 m) presented the highest values of richness with 35 (± 0.88) species; Aetideidae, Augaptilidae and Paracalanidae were the richest families, each with 7 species. Calocalanus pavo and Clausocalanus furcatus were two of the most frequent species. The fourth range (540–1000 m) had a richness of 31 ± 1.54; Aetideidae was the family with most species, (15) followed by Paracalanidae with 10 species.
In this study 33 new records are reported for the Colombian Caribbean Sea, increasing the number of recorded copepod species to 247. The distribution range was expanded for 50 species in CAO ecoregion, which only had records in the coastal zone (Supplemental material 2). Three species belonging to the order Cyclopoida could not be identified, so they were left at the genus level (Oithona, Oncaea and Sapphirina).
The order Calanoida showed the greatest diversity, with 89 species. The species Arietellus aculeatus (Arietellidae), Bathycalanus richardi, Bradycalanus typicus and Megacalanus princeps (Megacalanidae) are new records for the CAO ecoregion. The second order in number of species was Cyclopoida (31 species) adding Saphirella tropica (Clausidiidae), followed by the order Harpacticoida with 12 species and the order Mormonilloida with one species (Mormonilla phasma).
Ecological features and size
Three ecological features and one morphological character were identified in the taxonomic list of copepod species: the vertical and habitat distribution, trophic regime and body size (Supplemental material 2; ). The vertical distribution was represented by 47 species that inhabit both epipelagic and mesopelagic zones (35.33%), followed by 34 species that only inhabit the epipelagic zone (25.56%); 21 species inhabit epipelagic, mesopelagic and bathypelagic zones (15.77%) and only three species (Bradycalanus typicus, Haloptilus longicirrus and Nullosetigera impar) inhabit the bathypelagic environment exclusively ().
Figure 3. Ecological attributes and morphological characters of the copepod assembly found in ocean waters of the Colombian Caribbean. Percentage of species by a. Vertical distribution: Bathypelagic (Bat), Epipelagic (Epi), Mesopelagic (Meso); b. Habitat distribution: Coastal (C), Estuarine (E), Neritic (N), Oceanic (O); c. Trophic regime: Herbivorous (Herb), Omnivorous (Omn), Detritivorous (Detri), Carnivorous (Carn); d. Size spectrum: millimeters (mm)
Regarding habitat distribution, 57 species (42.85%) were found to inhabit exclusively oceanic waters and 35 species (18.79%) inhabit both neritic and oceanic waters; the remaining 41 species (30.82%) can be found in any environment (coastal, oceanic, estuarine or neritic). Three Acartiidae species were particularly present in estuarine, coastal and oceanic environments, Acartia lilljeborgi, A. danae and A. tonsa ().
The copepods are represented by four trophic regime groups; 43 species are carnivorous (32.33%) (e.g. Bathycalanus richardi, Candacia catula, C. truncate; Haloptilus plumosus, Valdiviella brevicornis). The second group is represented by herbivorous-omnivorous species (27.06%) (e.g. Calocalanus minor, Centropages typicus, Clytemnestra gracilis, Ctenocalanus citer, Delibus nudus), followed by omnivorous species (17.29%) (e.g. Aegisthus mucronatus, Gaetanus brevicornis, Lubbockia aculeata, Saphirella tropica) and detritivorous species (9.77%) (e.g. Euchirella curticauda, Microsetella rosea, Nullosetigera impar, Triconia similis), finally the exclusively herbivorous species group only reached 8.27% in the CAO ecoregion ().
In the CAO ecoregion 43 species had a range between 1 and 2 mm (33.83%) and 30 species were between 2 and 3 mm (22.55%); the copepods with sizes above 5 mm are of the order Calanoida, principally the families Aetideidae (Gaetanus pileatus, Pseudochirella spectabilis and Valdiviella brevicornis), Eucalanidae (Eucalanus hyalinus), Megacalanidae (Bathycalanus richardi, Bradycalanus typicus and Megacalanus princeps) and Scolecitrichidae (Lophothrix frontalis), and the order Cyclopoida with the family Sapphirinidae (Copilia vitrea) ().
Taxonomic diversity
The AvTD showed a range of 67–72 and the VarTD had an expected value of 125–185 (). Most of the samples collected are distributed above the average of the probability distribution, except for two samples of the deepest layers () which were below the average probability. Five samples corresponding to depth ranges 0–60, 170–340 and 540–1000 collected mainly in the southern zone fell outside the limit of the 95% probability distribution, which suggests that the values of the calculated taxonomic distinction are higher than the estimated.
Figure 4. Funnel plot for simulated average taxonomic distinction Delta+ (AvTD = Δ+) (a) and for variation in taxonomic distinctness Lambda+ (VarTD = Ʌ+) (b) of epipelagic and mesopelagic copepods in four depth range (0–60 m, 70–140 m, 170–340 m and 540–1000 m) in the Offshore Caribbean Sea. “ – –” shows average and “_____” show probability distribution at 95%
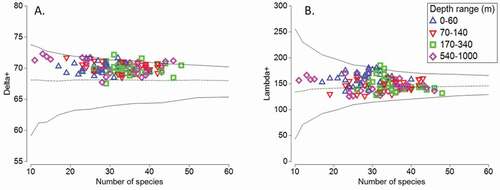
Comparing AvTD between depth ranges, it was found that some of the samples collected between 540–1000 m and 0–60 m presented low richness (between 10 and 20 species). These stations were particularly located in the central zone, while the stations with the highest species richness (between 40 and 50 species on average) were found between 70–140 m and 170–340 m; these are stations located in the southern and northern zones ().
The VarTD () showed values within the probability distribution (within the 95% confidence limits) except for two samples in the 170–340 m range in the central zone that were outside the confidence interval. The other samples collected followed the same pattern of behaviour; most of the sets or samples collected are distributed both above and below the average of the probability distribution.
Biodiversity indices
The abundance (N) of oceanic copepods decreased as depth increased, with average values of 340.03 ± 40.27 ind.m−3 in the first layer of depth (60–140 m) and 19.57 ± 2.69 ind.m−3 in the deepest layer (540–1000 m) (). Species richness (S) showed the highest values in the intermediate depth ranges (70–140 m and 170–340 m); in these layers on average 33 ± 1.06 and 34 ± 0.88 species were found, respectively (). The diversity of Shanon (H’), homogeneity (J’) and dominance (1-Lambda) indices showed the highest values in the third layer of depth (170–340 m); the indices presented similar values in the other depth ranges ().
Figure 5. Box and whiskers plot of abundance, richness and the diversity indices in four depth range (0–60 m, 70–140 m, 170–340 m and 540–1000 m) for the assemblage of epipelagic and mesopelagic copepods found in the CAO ecoregion between the years 2013 and 2018. a. N = species density (ind.m3), b. S = species richness, c. H’ = Shannon loge diversity index, d. J’ = Pielou species evenness index, e. 1 -Lambda = Simpson dominance index
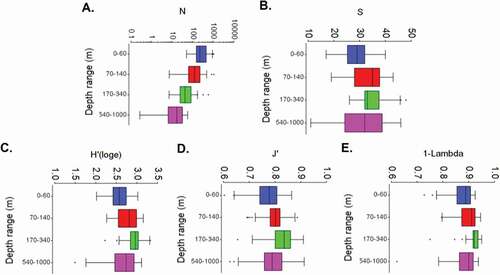
The abundance, richness and diversity of copepods in oceanic waters of the Colombian Caribbean showed significant ranking differences among depths (Supplemental material 2). All pairwise abundance comparisons were significantly different, except in the first two layers (0–60 m and 70–140 m). Species richness of was different between the superficial layer (0–60 m) and two following layers (70–140 m and 170–340 m), but there were no significant differences between deeper layers. Shannon’s diversity index in the first layer was different than the second and third, and also the last two depth ranges (140–340 m and 540–1000 m), but the intermediate ranges were not significantly different. The uniformity index was significantly different in third layer (140–340 m), and the dominance index was different in almost all ranges except among the first two ranges with the last.
Discussion
Species composition
The species composition of copepods in the Caribbean Sea has only been studied in the neritic zone and oceanic epipelagic ecosystem. Colombia made a first list in 2010 with a total of 217 species [Citation4], which was later updated and corrected, indicating 214 confirmed species [Citation5]. With the results of this study 33 new records were added, increasing the diversity of copepods in the Colombian Caribbean to 247 species, of which 49 are exclusive to oceanic waters. With this study, the distribution of 50 species previously recorded in coastal and neritic waters is extended to oceanic waters. This contribution includes 34.11% of the known species records for the wider Caribbean, which was estimated at 724 species [Citation2]. The number of species recorded in CAO is higher than in other areas of the Caribbean, in Mexican waters the total number of known species is 223 [Citation46–48], and in other countries, such as Cuba and Costa Rica, lower values have been recorded with 20 and 115 species, respectively [Citation49–51].
A total of 178 species of marine copepods of the order Harpacticoida have been recorded [Citation48]; however, for the Colombian Caribbean, only 15 species are recorded in neritic and coastal waters [Citation5]. Three species were added in this study (Aegisthus mucronatus, Clytemnestra gracilis and Oculosetella gracilis), resulting in a total of 18 species that corresponds to 10.11% of the total known species richness, which indicates a significant lack of information on this order for Colombian waters and the need to expand studies of this order.
The dominance of order Calanoida in the CAO ecoregion, in particular the families Aetideidae, Paracalanidae and Sapphirinidae, is similar to reports in epipelagic and mesopelagic tropical ecosystems [Citation3,Citation6,Citation52,Citation53]. The species of these families have ecological and morphological characteristics that allow them to play different trophic roles in pelagic ecosystems [Citation2,Citation6,Citation35,Citation40,Citation52,Citation54,Citation55]. The modified structure of their oral appendages allows them to obtain food from multiple sources in oceanic oligotrophic waters. Some highly specialized carnivorous species such as Aetideus armatus, Valdiviella brevicornis, Euaugaptilus hecticus, Copilia mirabilis and Calocalanus pavo have the ability to alternate their feeding patterns according to the availability of food, switching from actively capturing their prey to filtering food from the water [Citation6,Citation55]. Clausocalanus furcatus, Macrosetella gracilis, Oithona setigera and Calocalanus pavo were the most frequent species found in this study. These species have a wide distribution in the Colombian Caribbean from oceanic waters to the edge of the continental platform, being found in a wide latitudinal gradient from northeast (14º N) to southeast (9º N). They are also found in the southwest Atlantic Ocean [Citation2,Citation27,Citation53]. Therefore, several authors consider them to be indicator copepods of the North Equatorial Current due to their frequency, distribution and habitat characteristics [Citation9,Citation53,Citation56].
Ecological features and size
One of the main functional groups is composed of predatory species (carnivores) larger than 3 mm and a feeding strategy mainly of ambush. The following new records for the area in this group are highlighted: Bathycalanus richardi, Haloptilus plumosus, Megacalanus princeps, Pseudochirella spectabilis, Sapphirina scarlata and Valdiviella brevicornis. These species are present in epipelagic, mesopelagic and bathypelagic environments; they feed on the juvenile stages of their congeners or on other smaller species of genera such as Clausocalanus, Pseudocalanus, Oithona and Oncea [Citation2,Citation19,Citation57], and compete for food with juvenile and larval fish [Citation6,Citation19,Citation27,Citation32]. This group is very important as it is among the numerically most abundant taxa and among the major secondary producers in offshore ocean waters [Citation19,Citation58].
The other functional groups of copepods found are omnivorous-herbivorous, mostly with sizes ranging from 1 to 2 mm, with mainly cosmopolitan species inhabiting epipelagic and mesopelagic ecosystems in habitats associated with neritic waters and with continental influence, such as Acartia (Odontacartia) lilljeborgi, Clausocalanus furcatus, Nannocalanus minor, Pseudodiaptomus acutus, Temora turbinata and Undinula vulgaris, among others. This group of copepods feeds on microalgae and depends to some extent on detritus, contributing to the recycling of organic matter, carcasses and deposits that accumulate in the water column [Citation6,Citation19,Citation27,Citation32,Citation59]. Arietellus aculeatus is a new record for the CAO ecoregion, which was captured in deepest waters (540–1000 m). This species inhabits exclusively oceanic and mesopelagic waters and ranges from 3 to 5 mm; not very well known about the trophic habits of this species, which in this study was captured between 540 and 1000 depth [Citation2,Citation6,Citation27,Citation32].
The description of the ecological attributes identified and described in our study highlights the importance and the link between copepod species in terms of their ecological functions and their role in the diverse food webs of the Colombian Caribbean Sea. However, in marine zooplankton community, studies using the functional approach are scarce compared to traditional taxonomic analysis of study [Citation60]. In this study only some functional aspects of oceanic copepod species were described, because much of the information available in the literature is limited, lacking primary information for many species on food habits, stomach contents, size, habitat, biovolume, growth rates or excretion rates, sex ratio among others, of which only some are available for a limited number of target species. When analysing some functional aspects, we identified traits that share by some species, provide tools for understanding and predicting possible changes in trophic functions and linkages in the dynamic ocean. Functional approach is more meaningful way of analysing biodiversity compared to traditional taxonomic analysis [Citation61], by analysing the functions of organisms in the ecosystem, a better reflection of their role in the ecosystem is achieved, however, is urgent that future studies incorporate the functional dimension of diversity so we can better understand the possible responses of pelagic ecosystems to changes in the environment [Citation62].
Taxonomic diversity
Average taxonomic distinction index (Δ +) values within the 95% confidence limits generally indicate that the copepod assemblages contained the expected level of species diversity for a specific area, with some exceptions [Citation63]. Higher values of Δ+ do not necessarily correspond to a greater number of species; assemblages inhabiting depth ranges between 170–340 and 540–1000 m represent more taxonomic diversity than would be expected, as indicated by the location of some points above the upper confidence limit. In pelagic ecosystems, there are few physical boundaries that restrict the potential flow of species and their distribution across the water column, and ocean biogeography studies have consistently shown that the distribution of pelagic assemblages conforms to large-scale circulation patterns characterized by the distribution of water masses [Citation57].
The VarTD showed values above the average calculated for the Colombian Caribbean, taking into account the diversity of copepods recorded by Gaviria et al. [Citation5]; this is mainly due to the large number of species not recorded for this ecoregion (33 species), which considerably increase the knowledge of this assemblage. This indicates the taxonomic potential of the little-studied epipelagic and mesopelagic ecosystems, since it is the first time the assemblage of species of copepods in oceanic in waters deeper than 200 m was analysed.
Most studies in the Colombian Caribbean have been focused on the structure and composition, mainly in coastal or neritic waters [Citation58,Citation59,Citation64,Citation65] and in oceanic waters above 500 meters depth [Citation10–12,Citation66]. Our results are similar to those reported for other taxonomic groups [Citation20] in adjacent seas [Citation54]; it is uncommon to find significant differences in taxonomic diversity between close or related groups. Measures of AvTD and VarTD provide information on the variability of species richness, providing additional insight to conventional measures of species biological diversity [Citation67].
Taxonomic diversity indices have been used to record relevant changes in copepod assemblages [Citation54], providing complementary information on copepod assembly diversity. An advantage of this test is its robustness at different levels of sampling effort and species numbers [Citation15,Citation67]. This test showed high similarity in AvTD values and a low deviation of the mean VarTD between depth ranges and zones, suggesting that, as expected, the copepod assemblages had similar levels of complexity but different species compositions. The assemblages described here are a good representation of the actual copepod species reserve for the epipelagic and mesopelagic ecosystems of the Colombian Caribbean Sea.
Biodiversity indices
The results in this study suggest that species richness and abundance values between depth ranges showed a close relationship with the patterns found in the diversity, homogeneity and dominance indices. This contrasts with findings by other authors working with mesozooplankton communities in other seas, such as in Subantarctic Pacific [Citation19], on the southern Brazilian shelf [Citation53] and in the South Atlantic next to the area of confluence between Brazil and Maldives currents [Citation54]. Positive relationships between indices and depth range indicate a high diversity of species, mainly due to a greater variety of pelagic environments that change as depth increases. Considering the analogous way in which diversity is captured by each set of indices, dispersion can be produced due to the greater number of functional traits of species in each depth range [Citation68]. Likewise, the presence of dominant and subordinate species within groups increases redundancy, that is, those species that perform the same function [Citation17,Citation69].
According to Bernal et al. [Citation70], the main environmental and physical factors are the tropical surface jet of the Caribbean that flows predominantly in a northeast-southwest direction, modulating the direction of the Caribbean current, which is the predominant surface current. Bernal et al. [Citation70] pointed out that the northern, central and southern zones of the Caribbean are grouped according to the zonal and southern components of the wind.
In summary, this study contributes to increase the diversity of copepods in the Colombian Caribbean by 33 species, for a total of 247 species recorded. These new records correspond to 26 calanoids, 4 cyclopoids and 3 harpacticoids. In addition, the distribution range of 50 species recorded in the coastal zone was expanded to oceanic waters. The abundance, richness and diversity of copepods recorded in the CAO ecoregion did not appear to show vertical changes; however, the Kruskall Wallis test showed differences with the depth factor. Important species of epipelagic environments are frequently found in mesopelagic and bathypelagic environments, due to migration mechanisms and water mixing processes that favour assembly homogeneity. In the CAO ecoregion, carnivorous (32.33%) and herbivorous-omnivorous (27.06%) species of copepods were the most important trophic regimes.
The description of ecological attribute groups and taxonomic diversity identified in the Colombian Caribbean Sea reveals the first indications of links between pelagic copepod species in terms of their ecological function, rather than an approach based simply on their abundance and composition commonly described in species assemblages. In the future, we suggest implementing functional measures such as intake and production rates, sex ratios, vertical transport of organic matter and secondary production, and environmental measures such as water column structure and climate variability, among others.
Author contributions
E.F. Dorado-Roncancio conceived the study, collected, processed, identified the specimens and updated the data ANH (2013-2018) expeditions. E.F. Dorado-Roncancio, J. Medellin-Mora, J.E. Mancera-Pineda wrote the manuscript. All authors read and approved the manuscript.
Supplemental Material
Download PDF (28.7 KB)Supplemental Material
Download PDF (243 KB)Acknowledgments
Thanks for the co-financing and logistic support to the National Hydrocarbons Agency (ANH) and to the Institute of Marine and Coastal Research-INVEMAR (Agreements: 008-2008; 171-2013, 188-2014; 290-2015; 167-2016; 379-2017; 340-2018). We thank the National University of Colombia, the Vice-Rector of Research and the Academic Administrative Committee of the Caribbean Campus, which by means of resolutions 030 of 2019 and 035 of 2020 provided the economic support in the national and international mobility carried out during my academic stays in Medellín (Colombia) and Concepción (Chile). We thank the Laboratorio Servicios de Información – LABSIS (GEZ) for the map elaboration, GTSEM -Taxonomy, Systematics and Marine Ecology Research Group and the Marine Museum of Natural History of Colombia (MHMNC) of INVEMAR for their collaboration and good friendship. Contribution No. 1323 of the Marine and Coastal Research Institute – INVEMAR. Also, thanks to the reviewers for their helpful comments and suggestions.
Disclosure statement
No potential conflict of interest was reported by the authors.
Supplementary material
Supplemental data for this article can be accessed here.
Related Research Data
References
- Bradford-Grieve JM 1999. Copepoda, Acartiidae, Acartia, Paracartia, Pteriacartia. In: ICES Identification Leaflets for Plankton. Leaflet N° 181: 1-19. To replace Fiches d’Identification du Zooplancton N° 12. International Council for the Exploration of the Sea; Copenhagen, Denmark.
- Razouls C, de Bovée F, Kouwenberg J, et al. 2005-2020. Diversité et répartition géographique chez les Copépodes planctoniques marins. [Accédé le 2020 april 08]. Sorbonne Université, CNRS. Disponible sur http://copepodesobs-banyuls.fr
- Michel H, Foyo M. 1976. Studies of Caribbean zooplankton. Rosenstiel School of Marine and Atmospheric Science. University of Miami. Miami. Florida. U.S.A. pp. 275–289.
- Medellín-Mora J, Navas GR. Listado taxonómico de copépodos (Arthropoda: crustacea) del mar Caribe colombiano. Bol Inv Mar Cost. 2010;39(2):265–306.
- Gaviria S, Dorado-Roncancio J, Ahrens M. Revisión y actualización de la lista de especies de copépodos (Crustacea: hexanauplia) del Caribe colombiano. Bol Inv Mar Cost. 2019;48(1):119–151.
- Boxshall G, and Hasley S. An introduction to copepod diversity. Ray Soc. 2004 1,2 ;966.
- Park T. Calanoid copepods from the Caribbean Sea and Gulf Of Mexico. 2. New species and new records from plankton samples. Bull Mar Sci. 1970;20(2):72–546.
- Reid JW. Continental and coastal free-living Copepoda (Crustacea) of México, Central America and the Caribbean region: 175-213. In: Navarro D, and Robinson JG, editors. Diversidad biológica en la Reserva de la Biósfera de Sian Ka’an. Quintana Roo. México: CIQRO/University of Florida, México; 1990 598 .
- López W, and Mesa N. 1983. Distribución y abundancia del zooneuston en el Caribe colombiano, crucero Océano V, áreas II y III. IV Seminario Nacional de Ciencias del Mar, Centro de Investigaciones Oceanográficas e Hidrográficas, Comisión Colombiana de Oceanografía, CE-BM-11 Cartagena de Indias, Bolivar, Colombia; 15 p
- Medellín-Mora J, Martínez-Ramírez O. Distribución del mesozooplancton en aguas oceánicas del mar Caribe colombiano durante mayo y junio de 2008. p. 121-149. In: Navas GR, Segura-Quintero C, Garrido-Linares M, et al., editors. Biodiversidad del margen continental del Caribe colombiano. Vol. 20, INVEMAR Santa Marta, número: Serie de publicaciones especiales; 2010. p. 458.
- Gutiérrez-Salcedo J 2011. Estructura vertical del zooplancton oceánico del mar Caribe colombiano. Trabajo de MSc. Ciencias Biología. Bogotá: Universidad Nacional de Colombia, Bogotá. 124.
- Medellín-Mora J, Escribano R, Shneider W, et al. Spatial variability of zooplankton community structure in Colombian Caribbean waters during two seasons. Rev Biol Trop (Int J Trop Biol. 2018;66(2):688–708.
- Walker B. Biological diversity and ecological redundancy. Conserv Biol. 1992;6(1):18–23.
- McGill BJ, Enquist BJ, Weiher E, et al. Rebuilding community ecology from functional traits. Trends Ecol. 2006;21(4):178–185.
- Clarke KR, Warwick RM. A taxonomic distinctness index and its statistical properties. J Appl Ecol. 1998;35(4):523–531.
- Clarke KR, Warwick RM. Changes in marine communities: an approach to statistical analysis and interpretation. 2nd ed. Plymouth (United Kingdom): Plymouth Marine Laboratory; 2001a. p. 86.
- Rosenfeld JS. Functional redundancy in ecology and conservation. Oikos. 2002;98(1):156–162.
- Palacios D 2011. Patrones latitudinales de composición y diversidad funcional de peces asociados a la pesca de camarón del Pacífico mexicano. PhD.Thesis in Marine Sciencies. Instituto Politécnico Nacional, Centro Interdisciplinario de Ciencias Marinas, Departamento De Pesquerías y Biología Marina, La Paz, B.C.S. México. 182.
- Pomerleau C, Sastri A, Beisner B. Evaluation of functional trait diversity for marine zooplankton communities in the Northeast subarctic Pacific Ocean. J Plankton Res. 2015;37(4):712–726. 2015.
- Barnett A, Finlay K, Beisner BE. Functional diversity of crustacean zooplankton communities: towards a trait-based classification. Freshwater Biol. 2007;(2007)(52):796–813.
- Díaz J 2014. Región Caribe de Colombia. Banco de Occidente. iM editores. pp. 58.
- Hughes CW, Williams J, Hibbert A, et al. A Rossby whistle: a resonant basin mode observed in the Caribbean Sea. Geophys Res Lett. 2016;43(13):7036–7043.
- Bastidas-Salamanca M, Ricaurte-Villota C, Santa Maria-del-angel E, et al. Chapter 1. Regionalizacion dinámica del Caribe. pp 13-30. In: Ricaurte-Villota C, Bastidas-Salamanca ML, editors. Regionalización oceanográfica: una visión dinámica del Caribe. Santa Marta (Colombia): Instituto de Investigaciones Marinas y Costeras José Benito Vives De Andréis (INVEMAR). Serie de Publicaciones Especiales de INVEMAR # 14; 2017. p. 180.
- INVEMAR, . Programa Nacional de Investigación en Biodiversidad Marina y Costera PNIBM. In: Díaz J , and López, DG editors. Santa Marta: INVEMAR, FONADE, MMA; 2000. p. 80.
- Díaz J, Acero A. Marine biodiversity in Colombia: achievements, status of knowledge, and challenges. Gayana. 2003;67(2):261–274.
- Paramo J, Correa M, Núñez S. Evidencias de desacople físico-biológico en el sistema de surgencia en La Guajira, Caribe colombiano. Rev Biol Mar Oceanogr. 2011;46(3):421–430.
- Bjorberg TKS. Copepoda Boltovskoy, D. . In: Atlas del zooplancton del Atlántico sudoccidental y métodos de trabajo con el zooplancton marino. Publicación Especial del INIDEP. Mar del Plata: Argentina; 1981. p. 586–679.
- Nishida S 1985. Taxonomy and distribution of the family Oithonidae (Copepoda, Cyclopoida) in the Pacific and Indian Ocean. Bull. Ocean Res. Inst., Univ. of Tokyo, Tokyo, Japon. 20: 1–167.
- Bradford-Grieve JM 1994. Pelagic Calanoid Copepoda: Megacalanidae, Calanidae, Paracalanidae, Mecynoceridae, Eucalanidae, Spinocalanidae, Clausocalanidae. New Zealand Oceanographic Institute Memoir, 102: 1–160.
- Bradford-Grieve JM. Colonization of the pelagic realm by calanoid copepods. Hydrobiologia. 2002;485(1/3):223–246.
- Gaviria S, Aranguren N. 2003. Guía de laboratorio para identificación de cladóceros (Anopoda y Ctenopoda) y copépodos (Calanoida y Cyclopoida). Curso: técnicas de determinación taxonómica de cladóceros y copépodos limnéticos de Colombia Universidad Pedagógica y Tecnológica de Colombia. Escuela de Biología. Tunja, Colombia. 22.
- Boltovskoy D. South Atlantic zooplankton. Vols. 1-2. Leiden: Backhuys Publishers; 1999. p. 321.
- WoRMS, 2020 Accessed06 10 2020. Copepoda. Available from: http://www.marinespecies.org/aphia.php?p=taxdetails&id=1080on2020-10-06.
- OBIS, 2020 Accessed30 10 2020. Copepoda. Available from: https://obis.org/on30-10-2020
- Hidalgo P, Escribano R, Fuentes M, et al. How coastal upwelling influences spatial patterns of size-structured diversity of copepods off central-southern Chile (summer 2009). Prog Oceanogr. 2012;92–95:134–145.
- Clarke KR, Gorley RN. 2001. PRIMER (Plymouth Routines In Multivariate Ecological Research) v5: user manual/tutorial PRIMER-E plymouth (pp. 91). UK: Plymouth Marine Laboratory.
- Vinogradov M 1968. Vertikal’ noe raspredelenie okeanischeskongo zooplanktona. Institut Okeanologii. Akademya Nauk SSSR
- Scotto Di Carlo B, Ianora A, Fresi E, et al. Vertical zonation patterns for Mediterranean copepods from the surface to 3000 m depth at a fixed station in the Tyrrhenian Sea. J Plankton Res. 1984;6(6):1031–1056.
- Verheye H, Richardson A, Hutchings L, et al. Long-term trends in the abundance and community structure of coastal zooplankton in the southern Benguela system, 1951–1996. Afr J Mar Sci. 1998;19(1):317–332.
- Huggett J, Verheye H, Escribano R, et al. Copepod biomass, size composition and production in the Southern Benguela: spatio–temporal patterns of variation, and comparison with other eastern boundary upwelling systems. Prog Oceanogr. 2009;83(1–4):197–207.
- Clarke KR, Warwick RM. A further biodiversity index applicable to species lists: variation in taxonomic distinctness. Mar Ecol Prog Ser. 2001b;216:265–278.
- Clarke KR, Warwick RM. The taxonomic distinctness measure of biodiversity: weighting of step lengths between hierarchical levels. Mar Ecol Prog Ser. 1999;184:21–29.
- Shannon C. The mathematical theory of communication. Urbana USA: Univ. Illinois Press; 1948.
- Pielou E. An introduction to mathematical ecology. New York: WileyInterscience, John Wiley; 1969. p. 385.
- Simpson E. Measurement of diversity. Nature. 1949;163(4148):688.
- Suárez-Morales E, Gasca R. Updated checklist of the free-living marine copepods (Crustacea) of Mexico. An. Inst. Biol. Univ Nac Autón Méx, Ser Zool. 1998;69(1):105–119.
- Hernández-Trujillo S, Esqueda-Escárcega GM. La diversidad de copépodos marinos en México. Oceanides. 2002;17(1):57–68.
- Suárez-Morales E, de Troch M, Fiers F. A checklist of the marine Harpacticoida (Copepoda) of the Caribbean Sea. Zootaxa. 2006;1285:1–19.
- Morales-Ramírez A, Suárez-Morales E. Copepods. In: Wehrtmann IS, Cortés J, editors. Marine diversity of Costa Rica. Central America: Springer Science + Business Media B.V; 2009. p. 291–306.
- Morales-Ramírez A, Suárez-Morales E, Corrales-Ugalde M, et al. Diversity of the free-living marine and freshwater Copepoda (Crustacea) in Costa Rica: a review. ZooKeys. 2014;457:15–33.
- Campos A. Lista de especies de copépodos planctónicos de aguas cubanas. Poeyana. 1982;24:1–27.
- Lim B, Song S, Min G. Three Aetideid species of Copepods (Copepoda: Calanoida: Aetideidae) from East Sea of Korea. Korean J Syst Zool. 2011;27(1):35–46.
- Becker E 2014. Comunidade planctônica, especialmente copépodes, da plataforma continental de santa catarina (26-29°s): associação com processos oceanográficos e estrutura de tamanho de fitoplancton. Dissertação maestrado- Universidad Federal de Santa Catarina, Centro de Ciencias Biologicas. Programa de Posgraduação em ecología. 122.
- Berasategui A, Ramirez F, Schiartiti A. Patterns in diversity and community structure of epipelagic copepods from the Brazil–Malvinas Confluence area, south-western Atlantic. J Mar Syst. 2005;56(3–4):309–316.
- Matsuura H, Nishida S, Nishikawa J. Species diversity and vertical distribution of the deep-sea copepods of the genus Euaugaptilus in the Sulu and Celebes Seas. Deep-Sea Research II. 2010;57(24–26):2098–2109.
- Resgalla Jr JC. The holoplankton of the Santa Catarina coast, southern Brazil. Anais Da Academia Brasileira de Ciências. 2011;83(2):575–588.
- McGowan JA, Walker PW. Dominance and diversity maintenance in an oceanic ecosystem. Ecol Monogr. 1985;55(103–1):18.
- Dorado-Roncancio EF 2015. Estructura del zooplancton de la bahia de Cartagena (Caribe colombiano) en tres épocas climáticas de 2010. Trabajo grado Biol. Mar., Univ. Jorge Tadeo Lozano, Santa Marta. 89.
- López D 2009. Aspectos estructurales de la comunidad zooplanctónica durante pulsos de surgencia/no surgencia costera en la región de Santa Marta, Caribe colombiano. Trabajo grado Biol. Mar., Univ. Jorge Tadeo Lozano, Santa Marta. 89.
- Benedetti F, Sd A, Irisson J‐O, et al. Climate change may have minor impact on zooplankton functional diversity in the Mediterranean Sea. Divers Distrib. 2019;25(4):568–581.
- Heino J, Mykrä H, Kotanen J, et al. Ecological filters and variability in stream macroinver-tebrate communities: do taxonomic and functional structure follow the same path? Ecography. 2007;30(2):217–230.
- Francisco V, de La Cueva H. Nuevas perspectivas en la diversidad funcional de ambientes marinos. Latin Am J Aquat Res. 2018;45(2):261–275.
- McCosker E 2016. Influence of oceanographic conditions on coastal zooplankton assemblages at three IMOS National Reference Stations in Western Australia. MSc. Thesis in Environmental Science. Murdoch University. 78.
- Dorado-Roncancio JH 2009. Composición y distribución del zooplancton en el sistema cenagoso del parque vía parque isla Salamanca en dos momentos hidrológicos. Trabajo grado Biol. Mar., Univ. Jorge Tadeo Lozano, Santa Marta. 113.
- Martinez-Barragán M 2007. Composición y abundancia del zooplancton marino de las islas de providencia y santa catalina (Caribe colombiano), durante la época climatica lluviosa (octubre – noviembre) de 2005 Trabajo grado MSc. Biol. Mar., Univ. Jorge Tadeo Lozano, Santa Marta. 72.
- Giraldo R, Villalobos S. Anotaciones sobre el zooplancton superficial de San Andrés y Providencia. Bol Fac Biol Mar. 1983;1:6.
- Warwick RM, Clarke KR. Taxonomic distinctness and environmental assessment. J Appl Ecol. 1998;35(4):532–543.
- Wiedmann MA, Aschan M, Certain G, et al. Functional diversity of the Barents Sea fish community. Mar Ecol Prog Ser. 2014;495:205–218.
- Naeem S, Lawler SP, Thompson LJ, et al. Declining biodiversity can alter the performance of ecosystems. Nature. 1994;368(6473):734–737.
- Bernal G, Poveda G, Roldan P, et al. Patrones de variabilidad de las temperaturas superficiales del mar en la Costa Caribe colombiana. Revista de la Academia Colombiana de Ciencias Exactas. Fisicas y Naturales. 2006;30(115):195–208.