
 ?Mathematical formulae have been encoded as MathML and are displayed in this HTML version using MathJax in order to improve their display. Uncheck the box to turn MathJax off. This feature requires Javascript. Click on a formula to zoom.
ABSTRACT
Studies on the quantification and spatial distribution of stored carbon, as well as the potential for carbon uptake by forests, are of great importance. We assessed the spatial distribution and dynamic of carbon in forest plots in the Middle Xingu. These plots are part of the vegetation monitoring area of the Belo Monte Dam. We estimated the biomass of trees with diameter at breast height (DBH) ≥10 cm using an allometric equation with forest inventory data in the eastern Amazonian region in the Xingu River area. We evaluated the vegetation structure and carbon stock dynamic in 2012, 2014, and 2016, and temporal effects on carbon uptake. The periodic annual increase in carbon was significantly higher between 2012 and 2014 (2.5 Mg ha−1) than between 2014 and 2016 (1.84 Mg ha−1). Plant biomass was highly influenced by the abundance of species with low diameters (between 10 cm and 50 cm DBH). Despite the mortality rate being higher than the recruitment in the second period (2014–2016), we found that the forest did function as a carbon sink but showing increases in carbon emissions.
Introduction
Carbon dioxide has a direct impact on global warming [Citation1]. Tropical forests play a very important role in combating climate change since they represent the largest forested biome and, as a result, one of the largest stores of biomass in the world [Citation2]. However, these regions are also the most severely affected by deforestation and forest degradation [Citation3,Citation4], which significantly threatens their future potential to provide the removal of atmospheric carbon [Citation5,Citation6]. Recent studies already point that Amazon Forest is losing its role as carbon sink and gradually turning into carbon source [Citation7,Citation8]. An important driver of forest loss in the tropical regions is the construction of hydroelectric dams, also contributing to the increase in carbon emissions [Citation9].
Droughts increase the rate of carbon dioxide emissions from the forest to the atmosphere due to the death of trees, also reducing the biomass productivity [Citation10]. They are intensified by climatic anomalies, such as El Niño, which directly affect the Amazon basin [Citation11,Citation12]. The 2010 drought stunted tree growth and caused enough deaths to offset carbon gains in Amazonia that year [Citation10].
In the Amazon rainforest, deforestation is the most drastic and permanent form of land-use change harming the environment and biodiversity [Citation13]. Characterizing the distribution of carbon stored in Amazonia is of particular importance because its carbon stocks and its potential as a future carbon sink have turned the preservation of these forests into a necessity [Citation14]. Recent studies in Southeastern Amazonia, where the present study was carried out, show that atmospheric measurements of deforestation and rapid local warming have reduced or eliminated the capacity of the eastern Amazonian Forest to absorb carbon dioxide [Citation7,Citation8]. The patterns of forest carbon allocation may inform the adoption of measures aimed at reducing greenhouse gas emissions, such as the Reducing Emissions from Deforestation and Degradation (REDD) program, or the trading of carbon credits [Citation15]. Data on the stock and dynamics of fixed carbon are also needed to better assess the contribution of development projects in the Amazon region to the current global climate change process and to quantify carbon emissions due to deforestation and changes in land cover [Citation16–18].
The western Amazon rainforest is more dynamic than the eastern region, while the central Amazon and Guyana hold the largest biomass reserves [Citation19]. Several studies have estimated the carbon stocks and annual biomass accumulation in the Amazon basin, including analyses carried out in the central [Citation20,Citation21] (165.4, and 181.01 Mg ha−1C, respectively), southern [Citation22] (57.21–345.27 Mg ha−1 in above ground biomass), and eastern Amazon [Citation23] (432,8 Mg ha−1 in above ground biomass). On the other hand, it is important to point out that big trees or mature trees diameter at breast height [DBH] ≥50 cm contribute a large part of a forest’s biomass and carbon stocks [Citation24], but these trees are less photosynthetically active compared to young ones [Citation19]. Also, dominant species have an important role in carbon balance in Amazon Forest [Citation25]. Highly abundant species (i.e. hyperdominant species) retains 50% of regional biomass.
Our objective in this study is to assess the dynamics of carbon. We addressed the following questions in our analysis: (i) Do the most abundant species have the greatest carbon stocks or are carbon stocks greater among species with the largest individuals? (ii) Which diameter classes have the highest carbon gains and losses? (iii) What is the balance between carbon and changes in forest structure over the period assessed?
Methods
Study area
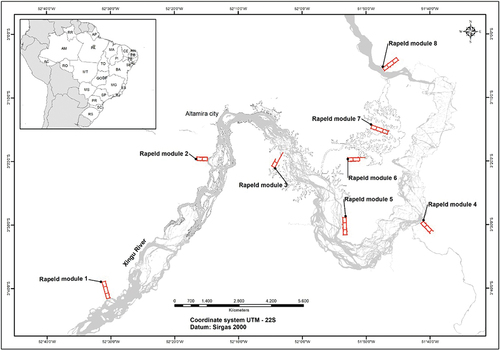
The study was carried out in the middle Xingu River, more specifically in the region known as “Volta Grande do Xingu” (3°26’ S, 51°56’ W), which includes territories of 5 municipalities (Altamira, Anapu, Brasil Novo, Senador José Porfírio, and Vitória do Xingu) of the southwest Pará mesoregion of Pará State, northern Brazil ().
Figure 1. Location of the study area with the eight RAPELD modules in which the monitoring plots are distributed along the Volta Grande do Xingu, eastern Amazonia, Brazil.
The region’s climate is tropical with monsoon rains, with a dry season from July to November (Am classification) and another tropical rainy season between December and June (Amw), according to the Köppen climate classification, adapted by Alvares et al. [Citation26]. The average temperature of 26°C, the annual rainfall averages 1,885 mm and the relative humidity ranges between 78% and 88% [Citation27]. The soils in these areas are fluvial and lytic neurosols, ultisols, latosols, cambisols, haplic gleysols, and haplic nitosols [Citation28].
Due to land colonization efforts from the 1980s onwards [Citation29], as well as the subsequent construction of the Belo Monte Hydroelectric Power Plant, the original forest cover of the middle Xingu has undergone considerable alterations due to anthropic actions. This area has suffered with significant losses of the original vegetation and replacement with crops and secondary vegetation, with the most intense effects seen in the area around the BR 230 highway (Trans-Amazon highway). The Belo Monte complex was described by Tófoli et al. [Citation30], flooding an area of 359 km2 and started operating in 2015.
According to the phytophysiognomy classifications of the Brazilian Institute for Geography and Statistics [Citation31], the region consists of submontane dense ombrophilous forest and emerging canopy dense forest. It is considered a “terra firme” forest (non-flooded area).
Sampling and data collection
We used data from the forest inventory performed by the flora monitoring program of the Basic Environmental Plan (“Plano Básico Ambiental” – PBA) of the Belo Monte Hydroelectric Power Plant, with data collected in 2012, 2014, and 2016.
The RAPELD methodology (a method that merges Rapid Assessment Protocol – RAP, and long-term ecological research – PELD) was used to implement the monitoring plots [Citation32]. Each RAPELD module covers an area of 5 km2, containing six permanent plots of 250 × 40 m (1 ha), 1 km apart, with the central axis following an elevation contour to minimize the variation of environmental variables [Citation33]. Monitoring was carried out on 75 permanent plots, distributed in 8 modules, and located in 3 non-inundated (“terra firme”) areas of dense ombrophilous forest. However, only 42 plots (42 ha) were used in this study since problems came up during the most recent measurements in the other plots, including flooding caused by the reservoir. The plots were distributed as follows: upstream area of Pimental dam Module 01 with 9 plots; Modules 02 and 03 with 8 plots; downstream area of Belo Monte dam, Modules 04 and 05 with 8 plots and Module 08 with 4 plots and Reservatory Area, Modules 06 and 07 with 13 plots.
Tree’s total height was estimated by eye, and the diameter was measured at breast height (DBH) with metric tape. When it was equal to or greater than 10 cm, the tree was included in the study (n = 8471) and duly marked with aluminum platelets. Trees were identified by botanical/herbarium technicians from Emílio Goeldi Museum of Pará (MPEG), Belém, Brazil, at the field and confirmed by voucher samples that were collected and deposited at MPEG, Federal University of Pará (UFPA), Altamira Campus, Altamira, Brazil, and at the Botanical Museum of Curitiba, Curitiba, Brazil.
Vegetation metrics and dynamics
Diameter classes
We separated the trees into diameter classes to generate a frequency distribution of the DBH of the individuals surveyed in the plots with DBH of 10 cm and up. We used the following diameter classes in this study: 10–30 cm; 30–50 cm; 50–70 cm; 70–90 cm; 90–110 cm; >110 cm.
Basal area
We calculated the BA using the measured DBH. This was obtained for every individual in each plot and then added together to obtain the total BA of the plot. Basal area was calculated as:
BA = Basal area (m2); DBH = diameter at breast height (1,3 m from soil) (cm)
Biomass and carbon estimates
We used allometric equations to estimate aboveground biomass, which are indirect methods that approximate biomass using easily measured variables such as height, diameter, and wood density. In this study, we selected the allometric model proposed by Chave et al. [Citation15] since it is a pan-tropical model that is broadly applicable to any area in the tropics.
Living aboveground biomass (AGBest) of trees with DBH ≥ 10 cm was calculated as:
AGBest = Estimated aboveground biomass in terms of dry weight (kg), DBH = diameter at 1.3 m above the ground (cm), H = total height (m), and ρ = wood density (g cm−3).
We estimated the amount of carbon stored in the aboveground plant biomass by multiplying the amount of biomass (AGBest) by the proportion of plant dry weight represented by carbon. We used a conversion factor of 0.485, implying that 48.5% of the biomass is composed of carbon [Citation34]
Wood density
Chave et al.’s [Citation15] equation uses wood density for biomass estimation. This variable was obtained for each species from a global wood density database, available at https://datadryad.org/stash/dataset/doi:10.5061/dryad.234 [Citation35]. This database does not contain the density of wood for all of the species found in this study. Thus, for some species, we used an average density at the genus or family level.
Vegetation dynamics
We used the counts of live and dead individuals obtained during each sampling period to determine the following parameters of forest dynamics: recruitment and mortality rates and periodic annual increase (PAI). Recruitment (r) and mortality (m) were calculated in two sampling intervals, 2012–2014 and 2014–2016, based on the following equations from Sheil et al. [Citation34] and Sheil & May [Citation36], respectively:
r = (1−(1−(I/Nt2)) × 100
m = 1−[1−(Nt2/Nt1)](1/t)
where r = recruitment; m = mortality; I = number of recruited trees; Nt1= number of trees in the initial sampling; Nt2 = number of surviving trees until the second sampling.
The equation to calculate periodic annual increment (PAI) in DBH, basal area (BA), biomass (dry weight) was:
where PAI = periodic annual increment; Mf = measure at the final sampling; Mi = measure at the initial sampling; P = interval between samples (in this work, 2 years).
Statistical analyses
To answer our first question, we set a linear regression model that tests the contribution of the abundance, mean DBH, and mean height on total stored carbon per plot. Even with a large sample, aiming to achieve residuals normally distributed, we applied a Box-Cox transformation to the dependent variable (carbon) and all independent variables were standardized. To our second question, we used a repeated measures ANOVA (nlme package in R) to test the significance of the variation of carbon stocks between diameter classes, and we applied a log transformation to normalize the residuals.
To our third question, we performed a repeated measures MANOVA with posterior Tukey test to compare the following subset of vegetation variables between the two periods (2012–2014/2014-2016): mortality, recruitment rates, mean DBH, BA, mean height, and biomass. Carbon increment showed collinearity with biomass, and we analyzed it isolated with t-test. We also tested if the carbon values would vary through time differently between DBH classes, performing a repeated-measures two-way ANOVA. All the analyses were carried out in RStudio 2022.02.3 and R 4.2.0.
Results
Dominant species
The species with the highest amounts of stored carbon (2016) and the highest carbon fixation rates, in decreasing order, were Alexa grandiflora Ducke (13,69%),Cenostigma tocantinum Ducke (6,13%), and Vouacapoua americana Aubl (5,76%), all of which belong to the family Fabaceae. At the same time, Bertholletia excelsa H.B.K (5,59%) had the fourth-largest carbon stocks in the study area ().
Table 1. Ten species with the highest values of carbon stock at the study area.
Using regression analysis (r2 = 0.76), we found that all parameters (abundance, basal area, DBH, and height) had a significant effect (p < 0.001) on the total carbon storage per species. The abundance (angular coefficient of 0.49; p < 0.001) exerted a greater effect on carbon storage, followed by DBH (angular coefficient of 0.45; p < 0.001) and height (0.43).
Carbon distribution by diameter class
Of the diameter classes studied, the greatest amount of carbon was stored in class 30–50 cm, with a total of 610 Mg in 2016 (approx. 35% of total carbon). Class 10–30 cm followed with 483 Mg (approx. 28%), while trees belonging to diameter class 50–70 cm stored 323 Mg (approx. 19%) of carbon. The larger classes (above 70 cm of DBH) stored 19% of total carbon found in 2016, distributed in only 0.92% of individuals ().
Table 2. Vegetation structure and dynamic per DBH class and per year of 42 hectares, showing the total value. And for carbon and biomass in parenthesis the mean and standard deviation. Carbon = carbon (Mg/ha), biomass = biomass (Mg/ha), abundance = total number of individuals, recruited = total number of recruited individuals, dead = total number of dead individuals. % represents the percentual value of each DBH class per year of the latter variable.
This pattern of smaller classes with higher values of carbon was statistically corroborated when analyzed at plot level in the repeated measures ANOVA. Trees with 30–50 cm and 10–30 classes holding significant higher values of carbon. But, at plot level, the larger individuals (>110 class) also showed high values of carbon, not differing from 10–30 to 50–70 classes ().
Figure 2. Boxplot (with quartiles and median) of carbon (Mg/ha) variation per plot between DBH classes. Letters represents statistical differences between DBH classes from ANOVA.
Vegetation dynamics
Over the entire time interval of the study, we noticed that more trees were being lost (due to mortality) than recruited. A total of 970 tree deaths (DBH ≥ 10 cm) were recorded in the 4 years of the study, while 796 trees entered the evaluation categories in the same period (). A total of recruited or dead individuals were higher among trees with a DBH of 10–30 cm, with an average of 81.43% and 100%, respectively, of all trees between 2012 and 2016 ().
Repeated-measures MANOVA and t-test (for carbon increment) indicated that recruitment, mortality, and all PAI (DBH, height, basal area, biomass, and carbon) from 2014–2016 were significantly smaller (F = 29.812; p-value = >0.001) than 2012–2014 period (). However, instead of this general decrease of increment, we observed a constant increase of carbon (), with significant higher amount in 2016 compared to 2012. This increase is distributed among majority of plots, with few ones showing negative carbon balance (). Also, we observed differences between DBH classes () and between-years differences () but the interaction of both variables (DBH* years) did not affect the carbon patterns (, two-way repeated measures ANOVA, F = 0.27506, p-value = 0.9864).
Figure 3. Boxplot (with quartiles and median) of periodic annual increment (PAI) of vegetation structure and dynamics variables.
Figure 4. Boxplot (with quartiles and median) of carbon (Mg/ha) variation per plot between years. Letters represents statistical differences between years from ANOVA.
Figure 5. Carbon net per plot between the two periods: 2012–2014 (gray) and 2014–2016 (black). Y axis represents stocking (positive values) or losing (negative values) of carbon.
Figure 6. Boxplot (with quartiles and median) of carbon (Mg/ha) between DBH classes and years.
Discussion
Our results show that the forest in the study area absorbed enough CO2 to replace the carbon lost from dead trees while also increasing carbon stock in the vegetation. This forest has been strongly affected by climatic anomalies, with abnormally high mortality rates during El Niño years, concerning years without extreme weather events. The El Niño event that occurred during 2015 and 2016 caused changes in temperature and rainfall throughout the Amazon, which led to changes in the carbon balance in vegetation, highlighting the susceptibility of the forest to global climate change [Citation12].
Dominant species
Of the 420 species found in this study, only four represent 31.27% of the carbon stock. The first two species (Alexa grandiflora and Cenostigma tocantinum) are not the most desired by the timber market [Citation37] the first because it does not have dense wood and the second because it does not generate logs of commercial importance. The two other species (Vouacapoua americana and Bertholletia excelsa) are listed as endangered species in Brazil [Citation38]. This pattern of a few species concentrating the most carbon is related to a large number of individuals in a few species (), a common pattern of species hyperdominance [Citation39,Citation40]. On the other hand, several studies carried out in the eastern [Citation28] and central Amazonia [Citation20,Citation21], in which the predominance of species belonging to the Fabaceae family is common and this family stands out as the one that stores the most and has the highest rates of carbon fixation in biomass. This family stands out for its abundance of individuals and large individuals, its success can be attributed to its adaptation to poor soils, as well as its high seed mass as a potential adaptation to low disturbance rates in regions such as Guyana [Citation41] Changes in the composition of dominant species in a forest community are important since they can drive biogeographic variation in factors, such as the change in average wood density of forest [Citation42]. This variation has a direct effect on forest productivity [Citation19,Citation43] and, consequently, on biomass [Citation44].
Variation through tree size
The distribution of individuals from diameter classes in this study is similar to the results recorded by Silva et al. [Citation20] in dense “terra firme” forest in the central Amazon. The latter study recorded 80% of trees as having a DBH of 10–30 cm, similar to our findings of 81.9% of individuals in this diameter class.
The high levels of carbon gains and losses in living biomass within the lower diameter classes are the result of the large numbers of young individuals in the secondary vegetation found in the study area. Lemos et al. [Citation45] attributed the abundance of these individuals to high levels of human or natural intervention among plant communities, such as those in the study area, which are most evident in trees with a DBH of up to 30 cm. In the study by Vasquez and Arellano (2012) [Citation46] carried out in the Andean region of Colombia, they found that the class with the highest carbon content was the one (10–30 cm DBH) immediately preceding the one recorded here (30–50) and that those age groups above 100 cm represent an important reserve of biomass and carbon. In Vasquez and Arellano (2012) [Citation46], they indicated that the forests under the effect of anthropic action present this pattern in the age distribution of carbon.
Changes in soil cover may open space for new individuals, which have less dense wood and grow more quickly, leading to more rapid biomass gains [Citation19]. This may explain the greater carbon gains obtained in the lowest diameter classes. However, these species have lighter wood that decomposes and releases the stored carbon more quickly following death. They may also be more vulnerable to mortality [Citation47]. This vulnerability may help explain the higher rates of carbon losses among individuals of lower diameter classes.
Vegetation dynamics
The carbon balance of vegetation depends on mortality and recruitment rates, as well as on individual growth in the height and diameter of trees. In this study, although we found mortality rates that were generally higher than recruitment rates, the carbon balance was positive at the end of the 4-year study. This indicates that tree growth, although lower in the second period, played an important role in compensating for the carbon loss due to mortality because only the carbon of the recruited individuals was not enough to make this compensate. After all, it was inferior to the total amount of carbon present in the dead individuals.
In this study, class III (50–70 cm) lost the most biomass in 2012–2014, while class II (30–50 cm) lost the most in 2014–2016. The change in mortality patterns during the second period demonstrates the greater susceptibility of smaller plants to extreme climatic events, such as the El Niño event that occurred during the latter period.
By analyzing the two periods of the study individually, we identified the instability that characterized this forest. Specifically, the recruitment rate was higher than the mortality rate during the 2012–2014 period, while it was lower than the mortality rate during 2014–2016. This higher recruitment in the first period mirrors results found in the Manaus region between 2005 and 2010 [Citation21] and in the central Amazon between 1986 and 2000 [Citation20].
The change during the second period may have been influenced by the occurrence of the El Niño climate anomaly in the years 2015 and 2016. In 2015 (August to December), there was a 2% increase in temperature and a 20% reduction in rainfall below regular levels in the Amazon [Citation48]. Indeed, 2015 may have been the hottest year in the Amazon in the last century [Citation15]. Rifai et al. [Citation49] found a correlation between the annual growth anomaly of tropical forests and the El Niño event, largely due to the soil water deficit.
In the Brazilian Amazonia, Souza et al. [Citation21] found PAIs (in DBH, BA, and total carbon) at values lower than those reported in this study, in an old-growth forest. The authors reported carbon increases of 2.06 Mg ha−1 year−1 between 2005 and 2007 and 0.67 Mg ha−1 year−1 between 2007 and 2010. The higher increases found in this survey may be due to disturbances in the area, which allowed for rapid growth among trees that were previously in the understories of the forest. Disturbed areas tend to show accelerated vegetation growth, as in the area evaluated by D’Oliveira et al. [Citation22], who estimated biomass increases between 7.45 and 15.03 Mg ha−1 year−1 in regenerated vegetation aged between 7 and 8 years in a site that had previously been burned.
Conclusions
Our results demonstrate how tree community dynamics in Amazonia are differently affected when considering DBH classes and its effects over carbon balance. Also, that anthropic effects, as hydroelectric power plants, are affecting small-scale patterns of biomass and other vegetation structure variables.
Acknowledgments
We are grateful to Norte Energia S.A. for the data provided that made this study possible
Disclosure statement
No potential conflict of interest was reported by the author(s).
References
- Mitchard ETA. The tropical forest carbon cycle and climate change. Nature. 2018;559(7715):527–534.
- Pan Y, Birdsey RA, Phillips OL, et al. The structure, distribution, and biomass of the world’s forests. Annu Rev Ecol Evol Syst. 2013;44(1):593–622.
- Pearson TRH, Brown S, Murray L, et al. Greenhouse gas emissions from tropical forest degradation: an underestimated source. Carbon Balance Manag. 2017;12(1):1–11.
- Taubert F, Fischer R, Groeneveld J, et al. Global patterns of tropical forest fragmentation. Nature. 2018;554(7693):519–522.
- Chave J, Condit R, Muller-Landau HC, et al. Assessing evidence for a pervasive alteration in tropical tree communities. PLoS Biol. 2008;6(3):0455–0462.
- Lewis SL, Lopez-Gonzalez G, Sonké B, et al. Increasing carbon storage in intact African tropical forests. Nature. 2009;457(7232):1003–1006.
- Gatti LV, Basso LS, Miller JB, et al. Amazonia as a carbon source linked to deforestation and climate change. Nature. 2021;595(7867):388–393.
- Denning S. Southeast Amazonia is no longer a carbon sink. Nature. 2021;595(7867):354–355.
- Berenguer E, Armenteras D, Alencar A, et al. Science panel for the amazon - amazon assessment report 2021 Chapter 19: drivers and ecological impacts of deforestation and forest degradation. 2021.
- Feldpausch TR, Phillips OL, Brienen RJW, et al. Amazon forest response to repeated droughts. Global Biogeochem Cycles. 2016;30(7):964–982.
- Li W, Zhang P, Ye J, et al. Impact of two different types of El Niño events on the Amazon climate and ecosystem productivity. J Plant Ecol. 2011;4(1–2):91–99.
- Jiménez-Muñoz JC, Mattar C, Barichivich J, et al. Record-breaking warming and extreme drought in the Amazon rainforest during the course of El Niño 2015-2016. Sci Rep. 2016;6(1):1–7.
- Barni PE, Fearnside PM, de A GPML. Simulating deforestation and carbon loss in Amazonia: impacts in Brazil’s Roraima state from reconstructing highway BR-319 (Manaus-Porto Velho). Environ Manage. 2014;55(2):259–278.
- Mitchard ETA, Feldpausch TR, Brienen RJW, et al. Markedly divergent estimates of A mazon forest carbon density from ground plots and satellites. Glob Ecol Biogeogr. 2014;23(8):935–946.
- Chave J, Réjou-Méchain M, Búrquez A, et al. Improved allometric models to estimate the aboveground biomass of tropical trees. Glob Change Biol. 2014;20(10):3177–3190.
- Achard F, Beuchle R, Mayaux P, et al. Determination of tropical deforestation rates and related carbon losses from 1990 to 2010. Glob Change Biol. 2014;20(8):2540–2554.
- Baccini A, J GS, Walker WS, et al. Estimated carbon dioxide emissions from tropical deforestation improved by carbon-density maps. Nat Climate Change. 2012;2(3):182–185.
- Almeida RM, Shi Q, Gomes-Selman JM, et al. Reducing greenhouse gas emissions of Amazon hydropower with strategic dam planning. Nat Commun. 2019;10(1):1–9.
- Malhi Y, Wood D, Baker TR, et al. The regional variation of aboveground live biomass in old-growth Amazonian forests. Glob Change Biol. 2006;12(7):1107–1138.
- E SK, R SC, P AC, et al. Dinâmica florestal, estoque de carbono e fitossociologia de uma floresta densa de terra-firme na Amazônia Central. Scientia Forestalis. 2015;43:193–201.
- Souza CR, Azevedo CP, Rossi LMB, et al. Dinâmica e estoque de carbono em floresta primária na região de Manaus/AM. Acta Amazonica. 2012;42(4):501–506.
- D’oliveira MVN, Alvarado EC, Santos JC, et al. Forest natural regeneration and biomass production after slash and burn in a seasonally dry forest in the Southern Brazilian Amazon. For Ecol Manag. 2011;261(9):1490–1498.
- Silva Costa LG, Miranda IS, Grimaldi M, et al. Biomass in different types of land use in the Brazil’s “arc of deforestation. For Ecol Manag. 2012;278:101–109.
- Romero FMB, Jacovine LAG, Torres CMME, et al. Forest management with reduced-impact logging in Amazonia: estimated aboveground volume and carbon in commercial tree species in managed forest in Brazil’s State of Acre. Forests. 2021;12(4):481.
- Fauset S, Johnson M, Gloor M, et al. Hyperdominance in Amazonian forest carbon cycling. Nat Commun. 2015;6(1):6857.
- Alvares CA, Stape JL, Sentelhas PC, et al. Köppen’s climate classification map for Brazil. Meteorologische Zeitschrift. 2013;22(6):711–728.
- Sousa JWC, Reid J, Leitão NCS. Custos e benefícios do Complexo hidrelétrico Belo Monte: uma abordagem econômico-ambiental. Conservat Strategy Fund. 2005;4:17–18.
- NorteEnergiaSA[internet]. Brasília (DF): eletrobrás; cited 2020 Jul 25]. Available from 2020 Jul 25: http://restrito.norteenergiasa.com.br/site/wp-content/uploads/2011/04/NE.Rima_.pdf.
- de P SR, Vieira ICG, Suemitsu C, et al. As florestas de Belo Monte na grande curva do rio Xingu, Amazônia Oriental. Bol. do Mus. Para. Emílio Goeldi Ciências Nat. 2007;2:55–153.
- Tófoli R, Rosa M, Dias M, et al. Gold at what cost? Another megaproject threatens biodiversity in the Amazon. Perspect Ecol Conservat. 2017;15:129–131.
- IBGE[internet]. Rio de Janeiro (RJ): IBGE; cited 2020 Jul 25]. Available from 2020 Jul 25: https://biblioteca.ibge.gov.br/visualizacao/livros/liv63011.pdf.
- Magnusson WE, Lima AP, Luizão R, et al. RAPELD: a modification of the gentry method for biodiversity surveys in long-term ecological research sites. Biota Neotropica. 2005;5(2):19–24.
- SILVA RP Alometria, estoque e dinâmica da biomassa de florestas primárias e secundárias na região de Manaus(AM) [Tesis Doctoral]. Manaus (AM): Universidade Federal do Amazonas – UFAM/ Instituto Nacional de Pesquisas da Amazônia – INPA. Brasil; 2007.
- Zanne AE, Lopez-Gonzalez G, Coomes DA, et al. Data from: towards a worldwide wood economics spectrum, Dryad. Dataset. 2009. DOI:10.5061/dryad.234.
- Sheil D, Burslem DF, Alder D. The interpretation and misinterpretation of mortality rate measures. J Ecol. 1995;83(2):331–333.
- Sheil D, May RM. Mortality and recruitment rate evaluations in heterogeneous tropical forests. J Ecol. 1996;91–100. DOI:10.2307/2261703
- Conceição AKC, Lira AGS, Sousa LMR, et al. Exploração e valoração em tora de 10 espécies florestais no baixo amazonas, estado do Pará, entre 2006 – 2016. ENCICLOPÉDIA BIOSFERA. 2020;17(30):80.
- MMA[internet]. Brasília (DF): Brasil; cited 2022 Mar 16]. Available from 2022 Mar 16: https://www.in.gov.br/en/web/dou/-/portaria-mma-n-561-de-15-de-dezembro-de-2021-367747322.
- Fauset S, O JM, Gloor M, et al. Hyperdominance in Amazonian Forest carbon cycling. Nat Commun. 2015;6(1):1–9.
- Ter Steege H, C PN, Sabatier D, et al. Hyperdominance in the Amazonian tree flora. Science. 2013;342(6156):1243092.
- Ter Steege H, Pitman NC, Phillips OL, et al. Continental-scale patterns of canopy tree composition and function across Amazonia. Nature. 2006;443(7110):444–447.
- Terborgh J, Andresen E. The composition of Amazonian Forests : patterns at local and regional scales. J Trop Ecol. 1998;14(5):645–664.
- Baker T, Phillips O, Malhi Y, et al. Variation in wood density determines spatial patterns in Amazonian forest biomass. Glob Change Biol. 2004;10(5):545–562.
- Lemos D, Ferreira B, Siqueira J, et al. Floristic and phytosociology in dense “terra firme” rainforest in the Belo Monte Hydroelectric Plant influence area, Pará, Brazil. Brazilian J Biol. 2015;75(3 suppl 1):257–276.
- Vásquez A, Arellano HE. Biomasa a\’erea y carbono almacenado en los bosques del Sur y Noroccidente de cordoba. arXiv preprint arXiv. 2012: 923–961
- Peter K, Ditzer T, Ong RC, et al. Comparison of measured and modelled growth on permanent plots in Sabahs rain forests. For Ecol Manag. 2001;142:1–16.
- Higuchi N, Chambers J, Dos Santos J, et al. Dinâmica E Balanço Do Carbono Da Vegetação Primária Da Amazônia Central. Floresta. 2004;34(3):295–304.
- Fontes CG, Dawson TE, Jardine K, et al. Dry and hot: the hydraulic consequences of a climate change–type drought for Amazonian trees. Philos Trans R Soc B. 2018;373:20180209.
- Rifai SW, Girardin CAJ, Berenguer E, et al. ENSO Drives interannual variation of forest woody growth across the tropics. Philos Trans R Soc B. 2018;373:20170410.