
ABSTRACT
Climatic seasons have been shown to determine the temporal fluctuations in species communities of different ecosystems. Here, we assessed the diversity of spider assemblages in dry, transition and rainy seasons in the “Guillermo Piñeres” Botanical Garden (GPBG), Turbaco, Colombia. We collected spider assemblages between June 2018 and April 2019 through standardized day and night sampling methods for tropical ecosystems: looking up, looking down, beating and leaf litter sieving. In total, we collected 1585 individuals, belonging to 28 families and 112 (morpho) species. We calculated the effective species richness (Hill numbers) to evaluate the changes in diversity across seasons and used clustering and ordination methods (Jaccard index-based nMDS) to identify differences in the composition of the assemblages. Also, we compared the abundance and species richness of predatory guilds of the three seasons. The transition season showed the highest diversity with 94 morphospecies, an effective number of species of 48.7 and a dominance of 32.4 effective species. The clustering and ordination methods grouped the sampling events into three groups, each corresponding to a climatic season. The most abundant guild was the orb web weavers, with the highest value in the rainy season, while “other hunters” were the most species rich. Our results indicate that the spider assemblages in GPBG present a seasonal variation in diversity, probably influenced by climatic conditions. Understanding how these seasonal changes occur is necessary to develop forest management strategies for monitoring and management projects on the conservation of species assemblages according to the Convention on Biological Diversity.
Introduction
The climatic characteristics of the different seasons of the year determine the temporal fluctuations in species assemblages [Citation1]. Changes in climatic features, such as temperature and precipitation, together with competition for food resources and habitat, can affect viability, fertility and development time of species, influencing their growth rate and survival [Citation1–3]. The increase in temperature affects both fauna and flora and the distribution and abundance of species at all trophic levels [Citation4,Citation5]. These effects are considerable in the case of ectothermic organisms, such as spiders, whose predatory and reproductive activity is dependent on temperature [Citation6]. As for the rainfall, it may determine the reproduction and oviposition time of many organisms, including spiders [Citation7–9], as well as their distribution and the diversity patterns of their prey [Citation10–12].
Spiders are one of the most species-rich groups in the animal kingdom. More than 50,400 species grouped into 132 families are currently known worldwide [Citation13]. These organisms fulfill multiple ecosystem functions and exploit a diversity of microhabitats [Citation14]. Because they are at the top of the arthropod food web [Citation8], they actively control the populations of other arthropods and serve as food for many vertebrates [Citation15,Citation16].
Spiders can be grouped into guilds according to the way in which they obtain their food [Citation17,Citation18]. These predatory guilds group phylogenetically related organisms that share niche and foraging requirements, and thus they allow investigating assemblage responses to climate change and habitat alteration [Citation19–21].
The Colombian Caribbean has the best preserved remnants of tropical dry forest in the country. Rodríguez et al. [Citation22] and some inventories have allowed estimating the diversity and taxonomic characteristics of the spiders that inhabit them. Goenaga & Rodríguez [Citation23], Escorcia et al. [Citation24] and Quijano-Cuervo et al. [Citation25] studied the diversity of spiders associated with remnants of tropical dry forest in the Caribbean region. Likewise, Morón [Citation26] and Peñaloza-Villadiego et al. [Citation27] conducted inventories of the araneofauna present in Dibulla-La Guajira and in the Serranía de Coraza Protected Forest Reserve, respectively. Saavedra [Citation28] and Salleg et al. [Citation29] described the araneofauna associated with different vegetation types; whereas Ferreira-Ojeda [Citation30], Ferreira-Ojeda et al. [Citation31] and Botto & Padilla [Citation32] studied the orb weaver spiders in the department of Magdalena. Also, Gutiérrez et al. [Citation33] characterized the spiders in the mangrove forests of La Guajira and Quijano-Cuervo & Martínez-Hernández [Citation34] and Quijano-Cuervo et al. [Citation35] showed how climate variation affects the composition and structure of spider assemblages.
This study aims to contribute to the taxonomic and ecological knowledge of spiders in the Colombian Caribbean by answering the following three questions: i) What is the abundance and richness of spiders in the “Guillermo Piñeres” Botanical Garden (GPBG) throughout a year? ii) What is the diversity of spider assemblages in GPBG in the dry, transitional and rainy seasons and how similar are they to each other? And iii) how do temperature, rainfall and humidity affect spider assemblages in GPBG? Understanding how these seasonal changes occur and shape spiders diversity patterns is necessary to develop forest management strategies for monitoring and management projects on the conservation of species assemblages according to the Convention on Biological Diversity [Citation36].
Methods
Study area
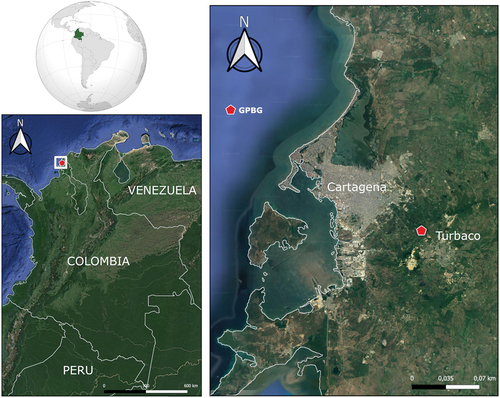
The “Guillermo Piñeres” Botanical Garden (GPBG) () is located in the Matute sector of the municipality of Turbaco, Bolívar (Colombia) (10°21’10.1“N, 75°25’43.3“W), close to the city of Cartagena. It comprises a protected area of nine hectares, of which five constitute plant collections (Arboretum-Palmetum zone with large native trees and native palms and small different zones with medicinal, fruit, ornamentals and xerophytic plants) and the other four hectares compose a protected native forest (tropical dry forest). Its heterogeneous environment presents climatic, topographic, and edaphic characteristics that vary in time and space, providing a variety of microhabitats for different species [Citation37,Citation38].
Figure 1. Location of the “Guillermo Piñeres” Botanical Garden in Turbaco, Bolívar.
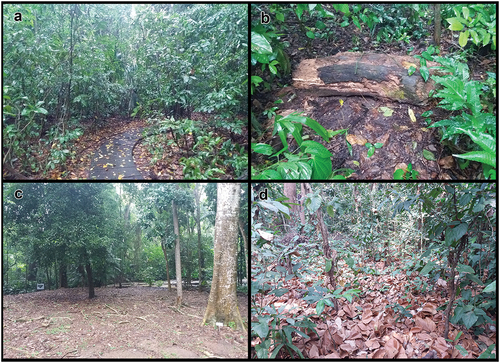
GPBG contains timber trees with economic and conservation interest, such as the red oak (Cedrela odorata Linneo, 1753) and the guamacho Leuenbergeria guamacho (F.A.C. Weber, 1898); fruit trees such as the mamey Mammea americana Linneo, 1791; and species such as the iraca palm Carludovica palmata Ruiz & Pav, 1798 of the Arecaceae family from the Caribbean and neighboring regions. The primary tropical dry forest relict is abounded with lianas, woody vines, and trees above 10 m with well-developed crowns ().
Figure 2. Microhabitats of the “Guillermo Piñeres” Botanical Garden of Turbaco, Bolivar. (a) trails; (b) fallen logs; (c) picnic area; (d) leaf litter.
The Colombian Caribbean dry ecosystems are subject to a marked climatic seasonality [Citation39]. The greatest amount of precipitation occurs during the rainy season (October, November and December), when average values do not usually exceed 200 mm per month [Citation40], likewise, average monthly temperature values do not usually exceed 38°C [Citation38]. On the other hand, the dry season in this area ranges from 5 to 6 months (January, February, March, April and May), with average precipitation values of 20 mm/month and monthly average temperature values ranging from 33°C to 40°C [Citation41]. The remaining months are considered to represent a seasonal transition with variable periods of rainfall and drought.
Sampling
We conducted 12 samplings throughout June, July, October and November 2018, and February and March 2019 (two samplings per month) in the Arboretum-Palmetum zone and the protected native forest area of the GPBG. Four experienced collectors collected eight samples using four methods (looking down, looking up, beating and litter sifting) in each sampling. One method was assigned to a collector by sampling, which took one diurnal sample and one nocturnal sample per his method [Citation42]. The looking down sample consisted of spiders collected from different microhabitats (soil, fallen trunks, leaf litter, spider webs, etc.) between 0 and 50 cm in height for 60 min. Each sample of looking up included spiders found between 50 and 200 cm height, during 60 min. For each beating sample, we used a Japanese umbrella for 30 min whereas for each litter sifting sample we screened the litter with a sifter (30 cm long and 20 cm wide) (also for 30 min), separating the specimens with a brush on a white canvas. We carried out all diurnal samplings between 8:00 and 11:00 and nocturnal samplings between 18:30 and 21:30. Therefore, each assemblage (each sampled in a sampling) was represented by eight samples and 6 h of collection.
We preserved the specimens in 70% ethanol and transferred them to the research laboratories at the Universidad de Cartagena, where we identified them to the lowest possible level (species or morphospecies) using the keys of Levi [Citation43], Benamú [Citation44], Jócque & Dippenaar-Schoeman [Citation45] and Grismado et al. [Citation46]. Expert arachnologists confirmed the identifications. All specimens are preserved in the research laboratories of the Universidad de Cartagena in the Arachnid section (CBUDC-ARA).
We used the environmental data (rainfall and temperature) for the years 2018 and 2019 of the Sincerín station (Arjona municipality) of the Instituto de Hidrología, Meteorología y Estudios Ambientales (IDEAM) to corroborate whether the months sampled met the typical characteristics of the regional climatic seasons.
Data analyses
Abundance and richness of spiders in the GPBG
We built species accumulation curves, computed the number of singletons (species represented by one individual in the entire sampling) and doubletons (species represented by two individuals), and calculated the sampling completeness based on the Chao 1 estimator to evaluate the thoroughness of the sampling in each climatic season with EstimateS v. 9.1 [Citation47,Citation48].
We classified the species into eight functional guilds as proposed by Cardoso et al. [Citation18]: (1) detection web weavers, (2) sheet web weavers, (3) space web weavers, (4) orb weavers, (5) specialists, (6) ambush hunters, (7) ground hunters and (8) other hunters.
Diversity of spiders in different seasons
To determine which samples corresponded to each of the climatic seasons, we created a climogram using the temperature and precipitation data provided by IDEAM. We determined each season based on precipitation data, considering that the dry season months were those with rainfall below 100 mm; that the transition season was composed of the first 3 months that exceeded the average of the entire sampling (90 mm) and that the rainy season was composed of the months with the highest amount of rainfall.
We calculated the Hill numbers (q0, q1 and q2) with the Spade program Chao et al. [Citation49] to compare the diversity and dominance patterns in each of the climatic seasons [Citation50]. These three values represent three orders of diversity: the number of observed species (q0), the exponential of Shannon’s index (q1) and the inverse of Simpson’s index (q2), with the latter two considering the relative abundances of species when calculating the effective number of species (dominant species) [Citation51,Citation52]. We then calculated estimators for each of the three measures, employing bootstrap for q0, the Horvitz-Thompson adjustment that allows the estimation of the Shannon index for q1 and the MVUE (Minimum Variance Unbiased Estimator), which is an unbiased estimator invariant to sample size for q2 [Citation50,Citation53].
To establish whether there were differences in species composition between the assemblages of the three stations (previously grouped according to their temperature and precipitation characteristics), we applied a permutational analysis of variance (PERMANOVA) with 999 permutations in PAST v. 3.01 [Citation54].
In order to group the assemblages of the different months according to their similarities and identify seasonality in the spider assemblages, we calculated a similarity matrix (Jaccard index with presence-absence data) [Citation55] and used it to cluster the assemblages through the Heuristic algorithm nearest neighbor interchange (illustrating them in a dendrogram) and to create an ordination using nonmetric multidimensional scaling (nMDS) using PAST v. 3.01 [Citation55,Citation56].
Effects of climatic factors on spiders
To determine the possible influence of environmental variables (temperature, precipitation and relative humidity) on the taxonomic structure of the assemblages, we performed a canonical correspondence analysis (CCA) [Citation56]. For this analysis, we excluded all the morphospecies with lower abundances (<4 individuals) as we considered that they were likely to be “tourist” species – not belonging to the habitat [Citation57].
Results
Abundance and richness of spiders in the GPBG
We collected a total of 1585 individuals belonging to 112 species and 28 families (). The most abundant families were Araneidae (37.7%), Theridiidae (10.4%), Theraphosidae (8.9%) and Ctenidae (8.8%). Araneidae was the family with the highest richness (27 species), followed by Salticidae and Theridiidae (20 and 10 species, respectively). Pisauridae and Trachelidae were the least abundant families with two individuals each.
Table 1. Abundance of the spider fauna present in the “Guillermo Piñeres” Botanical Garden during three climatic seasons. Numbering by functional guilds according to Cardoso et al., (2011): (1) Sensing web weavers, (2) Sheet web weavers, (3) Space web weavers, (4) Orb web weavers, (5) Specialists, (6) Ambush hunters, (7) Ground hunters, and (8) Other hunters.
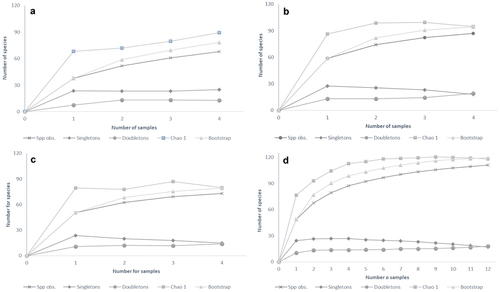
The sampling completeness based on the Chao 1 estimator indicated that we collected 93.9% of the species that could be found in the GPBG using our sampling methods. The curve of singletons showed a negative slope suggesting that our sampling was close to complete ().
Figure 3. Accumulation curves of spider species in the GPBG: (a) dry season 2019; (b) transition season 2018; (c) rainy season 2019; (d) all samplings.
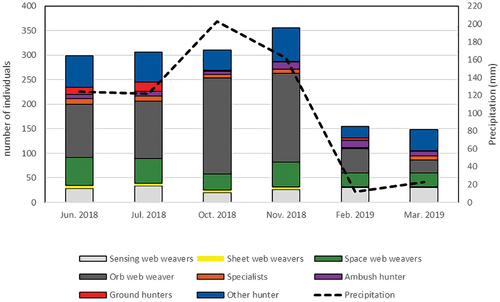
As for the spider guilds, seven of the 28 collected families belonged to the “other hunters” guild, with 34 morphospecies, being this guild the one with the largest number of families, followed by “ambush hunters” and “ground hunters” with four families each. Only two families represented the guilds “sensing web weavers” and “sheet web weavers” in the study (). The “Orb web weavers” showed great abundance during the rainy months, being more than 35% of the total of spiders for June and July (n = 109 and n = 117) and more than 50% in October and November (n = 196 and n = 181). The “ground hunters” were represented by just over ten individuals during the transition season, with very low abundance in March and November. The “sensing web weavers” showed a very similar abundance throughout the sampling months ().
Figure 4. Climate diagram. Precipitation and average temperature for the station in Sincerín, Arjona, collected by the Instituto de Hidrología, meteorología y Estudios Ambientales (IDEAM) (http://www.ideam.gov.co/web/atencion-y-participacion-ciudadana/pqrs, consulted on 02/01/2020).
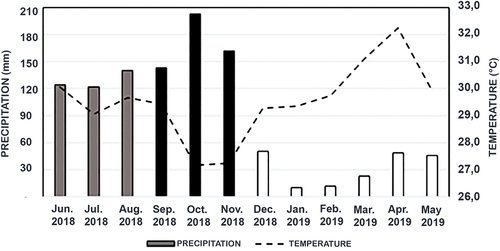
Figure 5. Variation of precipitation and abundance of functional guilds during the sampling months in the GPBG, Turbaco-Colombia.
Diversity of spiders in different seasons
From the climogram constructed with the data provided by IDEAM () and based on the precipitation values, we determined that January, February, March, April and May of 2019 corresponded to the dry season (10–50 mm); September, October, and November of 2018 to the rainy season (140–200 mm); and June, July, August and September of 2018 to the transition season (122–146 mm).
The dry season recorded the highest average temperatures (April − 32.2°C) and the smallest precipitation (January − 10 mm) during the analyzed period (). In the transition season, rainfall ranging between 122 mm and 146 mm, and the average temperature was between 29.4°C and 30.0°C (). During the rainy season, it was recorded the lowest average temperature and the highest precipitation rates, ranging between 29.5°C and 27.5°C and 140 mm and 200 mm, respectively. October was the month with the highest precipitation ().
During the dry season, we collected 23 families, 69 morphospecies and 302 individuals. Araneidae (n = 66), Theraphosidae (n = 54), Ctenidae and Theridiidae (n = 35) contributed the highest number of individuals (). Acanthoctenus sp. (Ctenidae) was the most abundant species, with 31 individuals. In the transition season, we recorded 611 individuals, grouped into 28 families and 86 morphospecies. Cyclosa sp. (Araneidae) was represented by 46 individuals, being the most numerous species (7.52%). We collected 668 individuals during the rainy season, grouped in 73 morphospecies, belonging to 24 families. Micrathena schreibersi (Araneidae) was the species that presented more individuals with 84 (12.57%) ().
indicates the values of the observed and estimated Hill numbers for each climatic season. The highest number of observed species (q0) was in the transition season, while the dry season obtained the lowest richness (). The estimators for q1 showed larger differences between the rainy and dry seasons than the observed values. The observed values of q2 were similar to those of q1, with the transition season being the one with the highest number of effective species, followed by the dry season and the rainy season, respectively.
Figure 6. Diversity profiles for each climatic season.
Table 2. Values of the observed and estimated Hill numbers for each climatic season. q0: diversity of order zero (species richness), q1: diversity of order 1 (Common species), and q2: diversity of order 2 (Dominant species).
The PERMANOVA analysis indicated differences in the composition of the spider assemblage between the sampling events of the dry, rainy and transition seasons (F = 4.872, p = 0.0002). This was corroborated by the classification and ordering analysis.
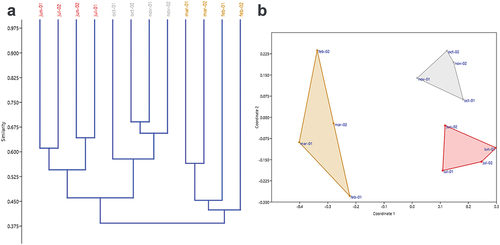
The clustering and ordination analyses grouped the assemblages into three groups according to the climatic seasons (). The first group was formed by Jun-01, Jul-02, Jun-02 and Jul-01, with a similarity of 56%, presenting 14 exclusive morphospecies: Araneidae sp1, Araneidae sp4, Corinna sp., Trochosa sp., Oxyopidae sp2, Pisauridae sp., Corythalia sp2, Psecas sp., Zuniga sp., Salticidae sp1, Salticidae sp3, Hapalopus sp., Theridiidae sp1, and Trachelas sp. The second group consisted of Oct-1, Oct-2, Nov-1 and Nov-2, with a similarity of 58%. Mangora sp., Verrucosa sp2, Araneidae sp2, Araneidae sp7, Fernandezina eduardoi, Acragas sp., Xantofreya sp., Rhomphaea sp., Theridiidae sp2, and Theridiidae sp4 were the morphospecies that were only collected during the sampling events that correspond to this group. The third group showed a similarity of 42% and 12 exclusive species (Metazygia sp., Araneidae sp3, Simonestus sp., Phoneutria boliviensis, Ctenidae sp., Pavocosa sp., Itata sp., Menemerus bivittatus, Platycryptus sp., Salticidae sp4, Theridiidae sp6, and Thomisidae sp2), and it was made up of the assemblages corresponding to the dry season (Mar-1, Mar-2, Feb-1 and Feb-2).
Figure 7. Classification and ordination of the spider community samplings carried out in the “Guillermo Piñeres” Botanical Garden: (a) similarity dendrogram; (b) non-metric multidimensional scaling (nMDS). Note the conformation of three groups: Dry season (blue, Feb-1, Feb-2, Mar-1 and Mar-2), Transition season (green, Jun-1, Jun-2 and Jul-1 and Jul-2), and Rainy Season (red, Oct-1, Oct-2, Nov-1 and Nov-2).
Effects of climatic factors on spiders
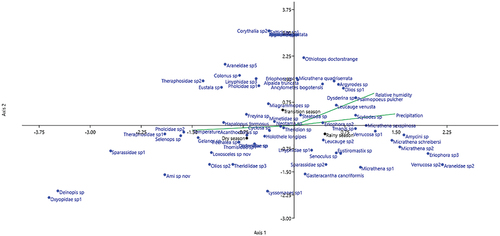
The first and second axes of the canonical correspondence analysis (CCA) between the environmental variables (temperature, rainfall and relative humidity) and the morphospecies abundance explained 64.45% and 35.55% of the variation, respectively (). Some species such as Theraphosidae sp1, Hapalopus formosus, Selenops sp., Pholcidae sp., Holothele longipes, Trechalea sp., Gelanor sp., and Acanthoctenus sp. showed associations with temperature during the dry season, indicating that these species may have an affinity for high temperatures. Likewise, relative humidity and precipitation showed an association with several species, most of which are representatives of the “orb web weavers” guild, suggesting the effect of the rain on spiders associated with the ground, and corroborating the dominance of orb-weaving spiders in the sampling during the rainy season.
Figure 8. Canonical correspondence analysis (CCA) between the environmental variables and the abundances of the morphospecies in the study area.
Discussion
Abundance and richness of spiders in the GPBG
This study reports 47.5% of the total number of families registered for Colombia, and about 1.2% of the species without including morphospecies and 8.7% including them [Citation58]. Araneidae was the most abundant and richest family, which coincides with some studies in the country that showed the dominance of this family in many ecosystems (e.g [Citation24,Citation27,Citation34,Citation59]). In contrast to these publications, Salticidae was not the most dominant family in the study, although it was the second with the highest species richness after Araneidae. We did not find specimens belonging to the Actinopodidae and Dipluridae families, previously collected in the sampling area [Citation60], possibly due to anthropogenic modifications of the GPBG habitats for touristic purposes.
The accumulation curves indicated that sampling at the three seasons was efficient. However, rare species (singletons and doubletons) exceeded 30% of the total richness, and therefore the list of spider species in the GPBG could still be lengthened by increasing the sampling time and the number of sampling methods.
The “orb web weavers” guild was the one that presented the largest number of individuals, matching previous findings of it being the guild with the greatest diversity and abundance in tropical forests (e.g [Citation59,Citation61]).
Diversity of spiders in different seasons
Our seasonal climatic analysis coincides with the description of the climate of the Colombian Caribbean region by [Citation62], according to whom rains are concentrated between August and December, with October being the month with the highest rainfall. Our findings are also aligned with other studies on the Colombian Caribbean [Citation34,Citation35], and with the remarks by Pizano & García [Citation39] about the marked climatic seasonality of the dry areas of the region.
In general terms, the transition season presented higher species diversity values than the rainy and dry seasons. These changes may be due to the fact that the months corresponding to the transition season act as an “inter-season ecotone,” in which spiders belonging to rainy and dry seasons are found [Citation63,Citation64]. There was a decrease in the number of individuals during the dry season and an increase during the months with rains. This pattern may be because in some arthropods, egg hatching and reproduction is related to changes in environmental conditions (e.g [Citation65,Citation66]). According to Quijano-Cuervo et al. [Citation35], the arrival of the rains would favor the hatching of the eggs in some spiders and eventually increase their abundance. Likewise, the decrease in richness and abundance in spider assemblages during the dry season may have occurred synchronously with the decrease in prey – during times of high temperature, the activity and availability of insects may be limited [Citation67]. Also, high temperatures may cause water deficit and physiological stress in many organisms [Citation68].
Effects of climatic factors on spiders
The canonical correspondence analysis revealed that the environmental variables (temperature, rainfall, and relative humidity) influenced the morphospecies composition and abundance. Likewise, Quijano-Cuervo & Martínez-Hernández [Citation34] found that these environmental variables influenced the abundance of spiders in a tropical dry forest of the Colombian Caribbean region, which allows us to conclude that the spider assemblages (and their changes throughout the seasons) in GPBG area are affected by the variations in environmental conditions.
Relevance for conservation
Our results show that the “Guillermo Piñeres” Botanical Garden is home to a rich and abundant spider fauna, including species not yet described. The destruction of natural vegetation in urban areas is advancing rapidly, along with the loss of its associated fauna, so it is crucial to conserve the natural spaces that remain. Climate change, which in the Colombian Caribbean mainly manifests itself through extreme droughts and floods, will exacerbate the effects of man-made deforestation and the degradation of ecosystems. For this reason, we recommend promoting the research on the biodiversity of spaces such as the “Guillermo Piñeres” Botanical Garden, and disseminating the findings through educational workshops focused on their conservation.
Disclosure statement
No potential conflict of interest was reported by the authors.
References
- Torres FR, Madi-Ravazzi L. Seasonal variation in natural populations of Drosophila spp. (DIPTERA) in two woodlands in the state of São Paulo, Brazil. Iher Sér Zoo. 2006;96:437–444.
- Bispo PC, Oliveira LG, Bini LM, et al. Ephemeroptera, Plecoptera and Trichoptera form riffles in mountain streams of Central Brazil: environmental factors influencing the distribution and abundance of immatures. Braz J Biol. 2006;66:611–622.
- Goldsmith S. Density of longhorned beetles (Coleoptera: Cerambycidae) differs at different elevations in Hawaiian montane forest. The Southw Nat. 2007;52:364–370.
- Reid H, Swiderska K. Biodiversidad, cambio climático y pobreza: una exploración de los vínculos. Inter Inst Envir and Dev Brief Pap. 2008;1:1–8.
- Baltazar CH. Cambio climático y diversidad de insectos en el Valle del Mantaro. Convic. 2015;2(1):1–15.
- Alfaro C, Torres-Contreras RS, Canals M. Thermal niche overlap of the brown recluse spider Loxosceles laeta (Araneae, Sicariidae) and its possible predator, the spitting spider Scytodes globula (Scytodidae). J of Ther Biol. 2013;38:502–507.
- Rossa-Feres D, Romero GQ, Goncalves DF, et al. Reproductive behavior and seasonal occurrence of Psecas viridipurpureus (Salticidae, Araneae). Rev Bras de Biol. 2000;60:221–228.
- Mineo MF, Del-Claro K, Brescovit AD. Seasonal variation of ground spiders in a Brazilian Savanna. Zool. 2010;27:353–362.
- Esquivel-Román A, Callejas-Chavero A, Villegas-Guzmán GA. Relación de la temporalidad (estiaje y lluvias) con la riqueza y abundancia de arañas saltarinas (Araneae: Salticidae) en cinco localidades de San Luis Potosí. Acar y Arac. 2018;2:448–475.
- Maveety SA, Browne RA, Erwin TL. Carabidae diversity along an altitudinal gradient in a Peruvian cloud forest (Coleoptera). Zook. 2011;147:651–666.
- Muñoz AG. Estructura de la comunidad de arañas tejedoras (Arachnida: Araneidae) a lo largo de un gradiente altitudinal en los Andes nor-orientales ecuatorianos [ Bachelor’s Thesis]. Quito (Ecuador): Universidad San Francisco de Quito; 2013.
- Torres VM, Gonzales-Reyes AX, Corronca JA. Diversidad taxonómica y funcional de arañas (Araneae) epigeas en bosques nativos de las Yungas (Salta, Argentina). Cald. 2017;39:326–344.
- World Spider Catalog [Internet]. Bern: Natural History Museum; c2014–2022 [cited 2022 Jul 06. Available from: http://wsc.nmbe.ch
- Simó M, Laborda A, Jorge C, et al. Las arañas en agroecosistemas: bioindicadores terrestres de calidad ambiental. Rev del Lab Tec del Uru. 2011;6:51–56.
- Beccaloni JA. Arachnids. Oakland, California: University of California Press; 2009.
- Schwerdt L, Pompozzi G, Copperi S, et al. Diversidad estructural y temporal de arácnidos epígeos (Arachnida), excepto ácaros, en el sistema serrano de Tandilia (Buenos Aires, Argentina). Hist Nat. 2014;4:101–111.
- Martínez-Martínez L, Colón-García EM, García-García MÁ, et al. Riqueza de especies y gremios de arañas (Chelicerata: Araneae) en mono y policultivos de maíz, en Reyes Mantecón, Oaxaca. Ent Mex. 2016;3:64–69.
- Cardoso P, Pekar S, Jócque R, et al. Global Patterns of Guild Composition and Functional Diversity of Spiders. PLoS ONE. 2011;6:1–10.
- Uetz GW, Halaj J, Cady AB. Guild structure of spiders in major crops. J of Arach. 1999;27:270–280.
- Dias SC, Carvalho LS, Bonaldo AB, et al. Refining the establishment of guilds in Neotropical spiders (Arachnida: Araneae). J of Nat Hist. 2010;44:219–239.
- Voigt WP, Jones TH. Using functional groups to investigate assemblage response to environmental changes: two grassland case studies. Glob Cha Biol. 2007;13:1710–1721.
- Rodríguez MG, Banda-R S, Reyes B, et al. Lista de las plantas vasculares de bosque seco prioritarios para la conservación en los departamentos de Atlántico y Bolívar. Biot Col. 2012;13:7–39.
- Goenaga G, Rodríguez K. Araneofauna presente en un remanente de Bosque Seco Tropical en la Hacienda “El Ceibal”, municipio de Santa Catalina, Bolívar, Colombia [ Bachelor’s Thesis]. Barranquilla (Colombia): Universidad del Atlántico; 2005.
- Escorcia R, Martínez N, Silva J. Estudio de la diversidad de arañas de un Bosque Seco Tropical (Bs-T) en Sabanalarga, Atlántico, Colombia. Bol Cient Mus de Hist Nat. 2012;16:247–260.
- Quijano-Cuervo L, Rangel-Acosta J, Martínez-Hernández N, et al. Estratificación vertical de arañas tejedoras (Araneae) en fragmentos de bosque seco tropical del Caribe colombiano. Rev de Biol Trop. 2019;67:224–242.
- Morón E. Descripción de las familias de arañas (Arachnida: Araneae) en un paleocauce del río Palomino, Dibulla-Guajira [ Specialization Thesis]. Santa Marta (Colombia): Universidad del Magdalena; 2004.
- Peñaloza-Villadiego A, García-Garrido J, Flórez-Daza E, et al. Araneofauna de la Reserva Forestal Protectora Serranía de Coraza Sucre-Colombia. Rev Col de Cien Ani. 2013;5:36–47.
- Saavedra E. Reconocimiento de la aracnofauna asociada al cultivo de arroz secano en la subregión del San Jorge, Sucre [ Thesis]. Montería (Colombia): Universidad de Córdoba; 2006.
- Salleg PG, Quirós RJ, Wild TI. Arañas asociadas a la vegetación acuática de dos ciénagas del complejo cenagoso del bajo Sinú, Córdoba-Colombia. Rev Col de Cien Ani. 2016;8:20–29.
- Ferreira-Ojeda LC. Diversidad de arañas orbitelares (Araneae: Orbiculariae) en tres formaciones vegetales de la Sierra Nevada de Santa Marta (Magdalena, Colombia) [ Bachelor’s Thesis]. Santa Marta (Colombia): Universidad de Magdalena; 2007.
- Ferreira-Ojeda LC, Flórez-D E, Sabogal-González A. Arañas orbitelares de un Bosque Húmedo Subtropical de la Sierra Nevada de Santa Marta (Magdalena, Colombia). Caldasia. 2009;31:381–391.
- Botto FC, Padilla Y. Arañas tejedoras (Arachnida: Araneae) de los cerros de Santa Marta (Magdalena, Colombia) [ Bachelor’s Thesis]. Santa Marta (Colombia): Universidad del Magdalena; 2010.
- Gutiérrez-Estrada M, González A, Arauji D, et al. Arañas asociadas a los bosques de manglar en el brazo Calancala y el Riito, delta del Rio Ranchería, Caribe Colombiano. Paper presented at: Primer Congreso Manglares de América; 2019 Nov Guayaquil, Ecuador.
- Quijano-Cuervo L, Martínez-Hernández N. Variación temporal de la araneofauna (Arachnida: Araneae) en un fragmento de bosque seco tropical (BST), en el departamento del Atlántico, Colombia. Bol Cien Mus de Hist Nat. 2015;19:381–396.
- Quijano-Cuervo L, Martínez-Hernández N, Sabogal-González A. Variación temporal de la abundancia y algunos aspectos poblacionales de Micrathena (Araneae: Araneidae) en un Bosque Seco Tropical (BST) del Caribe colombiano. Ecol Aust. 2017;27:199–209.
- Groom MJ, Meffe GK, Carroll CR. Principles of conservation biology. Third ed. Sunderland (USA): Sinauer Associates; 2005.
- Toti DS, Coyle FA, Miller JA. A structured inventory of Appalachian grass bald and heath bald spider assemblages and a test of species richness estimator performance. J of Arach. 2000;28:329–345.
- Jiménez-Ferbans L, Amat-García G. Sinopsis de los Passalidae (Coleoptera: Scarabaeoidea) del Caribe Colombiano. Cald. 2009;31:155–173.
- Pizano C, García H. El Bosque Seco Tropical en Colombia. Bogotá (Colombia): Instituto de Investigación de Recursos Biológicos Alexander von Humboldt (IAvH); 2014.
- Espinoza CI, De La Cruz M, Luzuriaga AL, et al. Bosques tropicales secos de la región pacífico ecuatorial: diversidad, estructura, funcionamiento e implicaciones para la conservación. Ecos. 2012;21:167–179.
- Maass M, and Burgos A , et al. Water dynamics at the ecosystem level in seasonally dry tropical forests. In: Dirzo R, Young H, and Mooney Heditors. Seasonally dry Tropical Forests: ecology and Conservation. Washington DC: Island Press; 2011. pp. 141–156.
- Coddington JA, Griswold CE, Davila D, et al. Designing and testing sampling protocols to estimate biodiversity in tropical ecosystems. Crit Issu in Biodiv – Symposium. 1991;2:44–60.
- Levi HW. Keys to the genera of araneid orbweavers (Araneae, Araneidae) of the americas. The Journal of Arachnology. 2002;30:527–562.
- Benamú MA. Clave para la determinación de algunas familias de arañas (Araneae, Araneomorphae) del Uruguay. Bol Soc Zoo de Uru. 2007;16:1–19.
- Jócque R, Dippenaar-Schoeman AS. Spider families of the world. Tervurem (Belgium): Royal museum for Central Africa; 2007.
- Grismado CJ, Ramírez MJ, Izquierdo MA. Araneae: taxonomía, diversidad y clave de identificación de familias de la Argentina. Biodiv de Art Arg. 2014;3:55–94.
- Villareal H, Álvarez M, Córdoba S, et al. Manual de métodos para el desarrollo de inventarios de biodiversidad. Bogotá (Colombia): Instituto de Investigaciones de Recursos Biológicos Alexander von Humboldt; 2004.
- Bautista-Hernández CE, Monks S, Pulido-Flores G. Los parásitos y el estudio de su biodiversidad: un enfoque sobre los estimadores de la riqueza de especies. In: Pulido-Flores G Monks S, editors. Estudios científicos en el estado de Hidalgo y zonas aledañas Vol II. Lincoln (NE): Zea Books; 2013. pp. 13–17.
- Anne Chao’s website: spade [Internet]. WordPress; c2015–2022 [cited 2020 Jul]. Available from: http://chao.stat.nthu.edu.tw/wordpress/software_download/
- Chao A, Jost L. Estimating diversity and entropy profiles via discovery rates of new Species. Meth in Eco and Evol. 2015;6:873–882.
- Moreno CE, Barragan F, Pineda E, et al. Reanálisis de la diversidad alfa: alternativas para interpretar y comparar información sobre comunidades ecológicas. Rev Mex Biodiv. 2011;82:1249–1261.
- Lou J, González-Oreja JA. Midiendo la diversidad biológica: más allá del índice de Shannon. Act zoo lil. 2012;56:3–14.
- Chao A, Shen TJ. Nonparametric estimation of Shannon’s diversity index when there are unseen species in sample. Env and Ecol Stat. 2003;10:429–443.
- Anderson MJ, PERMANOVA WD. ANOSIM, and the Mantel test in the face of heterogeneous dispersions: what null hypothesis are you testing? Ecol Mon. 2013;83:557–574.
- Clarke KR, Gorley RN, Somerfield PJ, et al. Change in marine assemblages: an Approach to Statistical Analysis and Interpretation. Plymouth (UK): Primer-E Ltd; 2014.
- Hammer Ø, Harper D, Ryan P. PAST: paleontological Statistics Software Package for Education and Data Analysis. Pal Elec. 2001;4:1–9.
- Malumbres-Olarte J, Barratt BIP, Vink CJ, et al. Big and aerial invaders: dominance of exotic spiders in burned New Zealand tussock grasslands. Biol Invasions. 2014;16:2311–2322.
- Arachnids from Tropical Andean Countries ArachnoTrAC [Internet]. W Galvis ed.; c2010–2022 [cited Jan 2022]. Available from: https://sites.google.com/view/arachnotrac/araneae
- Rico A, Beltrán AJ, Álvarez DA, et al. Diversidad de arañas (Arachnida: Araneae) en el Parque Nacional Natural Isla Gorgona, pacífico colombiano. Bio Neo. 2005;5:1–12.
- Zapata-M W, Ahumada-C D, Segovia-Paccini A, et al. Primeros aportes al conocimiento de la diversidad de arácnidos del departamento de Bolívar. Paper presented at: Biodiversidad, Ecología y Conservación. 43 Congreso de La Sociedad Colombiana de Entomología (SOCOLEN); 2016 Jul 27–29; Manizales, Colombia.
- Silva D, Coddington JA. Spiders of Pakitza (Madre de Dios, Perú): species richness and notes on community structure. In Wilson, DE, Sandoval, A (eds.) The Biodiversity of Southeast Perú. 1997. p. 253–311; Smithsonian.
- Rangel-Ch JO. Clima de la Serranía del Perijá. In: Rangel Ch, J. Orlando, (ed.) Diversidad Biótica VIII: Media y baja montaña de la serranía de Perijá Colombia. Bogotá (Colombia): Universidad Nacional de Colombia; 2009: p. 3–49.
- Noguera FA, Zaragoza-Caballero S, Rodríguez-Palafox A, et al. Cerambícidos (Coleoptera: Cerambycidae) del bosque tropical caducifolio en Santiago Dominguillo, Oaxaca, México. Rev Mex de Biodiv. 2012;83:611–622.
- Noguera FA, Ortega-Huerta MA, Zaragoza-Caballero S, et al. A faunal study of Cerambycidae (Coleoptera) from one region with tropical dry forest in Mexico: sierra de San Javier, Sonora. The Pan-Pac Ent. 2009;85(2):70–90.
- Parnrong S, Campbell IC. The effects of temperature on egg hatching of the mayfly Austrophlebioides marchanti (Ephemeroptera: leptophlebidae). Res Upd on Ephe & Pleco. 2003;1:189–193.
- Zindler C. The effects of temperature and humidity on the eggs of Aedes aegypti (L.) and Aedes albopictus (Skuse) in Texas [ dissertation]. Texas (EU): University Texas, 2007
- Batista MC, Lopes GS, Marques LJ, et al. The dung beetle assemblage (Coleoptera, Scarabaeinae) is differently affected by land use and seasonality in northeastern Brazil. Ent. 2016;31:95–104.
- Jiménez-Sánchez E, Zaragoza-Caballero S, Noguera FA. Variación temporal de la diversidad de estafilínidos (Coleoptera: Staphylinidae) nocturnos en un bosque tropical caducifolio de México. Rev Mex de Biodiv. 2009;80:157–168.