
Abstract
Mesopelagic fishes are an important component of marine ecosystems, providing an important link between lower and higher trophic levels. This group of fishes is also highly abundant and make up a large portion of the marine vertebrate biomass. Here we report on the full mitochondrial sequences for two common mesopelagic fishes from the southern California bight: the Mexican lampfish Triphoturus mexicanus (Actinopterygii: Myctophidae) and the black-belly dragonfish Stomias atriventer (Actinopterygii: Stomiidae). Triphoturus mexicanus showed previously reported gene rearrangements for the Myctophidae. Phylogenetic analysis grouped S. atriventer with other Stomiiformes and T. mexicanus within the Myctophiformes.
Mesopelagic fishes make up the largest portion of the global vertebrate biomass (Gjøsaeter and Kawaguchi Citation1980; Kaartvedt et al. Citation2012; Davison et al. Citation2015). These fishes also make up an important component of marine food webs, as they are a link between plankton and higher-level predators (Gjøsaeter and Kawaguchi Citation1980; Cherel et al. Citation2008; Choy et al. Citation2012). Concordantly there is concern how this abundant and important fish community will respond to the impacts of climate change (Koslow et al. Citation2011; Asch Citation2015). Despite these features, there has been little genetic/genomic study on the mesopelagic fishes of the northeast Pacific.
We assembled the complete mitochondrial genomes for two common mesopelagic fishes from the southern California bight: the Mexican lampfish (Triphoturus mexicanus) and the black-belly dragonfish (Stomias atriventer). Samples were obtained from an Isaacs-Kidd midwater trawl in the San Pedro Channel (33.55830 N, −118.42550 W) and specimens, tissue and DNA are vouchered at CSULA (#16-001 and #16-033). Total genomic DNA was extracted and each individual was sequenced on an Illumina HiSeqX (Illumina, San Diego, CA). A portion of the reads from each species were assembled using NOVOPlasty (Dierckxsens et al. Citation2017) with a portion of the mitochondrial cytochrome oxidase I gene used as the initial seed. Resulting assemblies were annotated with on the MitoFish website (Iwasaki et al. Citation2013) and protein coding genes were used in a partitioned Bayesian phylogenetic analysis. PartitionFinder2 (Lanfear et al. Citation2016) was used to identify partitioning schemes and best-fit models of molecular evolution for the protein sequences.
The complete mitochondrial genome of T. mexicanus (Genbank accession no. MG321595) is 18,012 bp with two ribosomal genes (12S and 16S), 22 tRNAs and 13 protein-coding genes. It contained similar gene counts and organization as other Myctophidae and Lampanyctini (Poulsen et al. Citation2013). This includes the WANYC gene order, shifted tRNA-Cys and Tyr positions and a longer OL region (90 bp in T. mexicanus). Specific characteristics of the Lampanyctini found in T. mexicanus include the relocation of the tRNA-Glu and intergenic non-coding regions resulting in the CytB/T/E/P gene order. The assembled S. atriventer mitogenome (Genbank accession no. MG321596) is 17,596 bp with two ribosomal genes (12S and 16S), 22 tRNAs and 13 protein-coding genes. Stomias atriventer contains the typical vertebrate gene order that is also observed in another Stomiiformes (Diplophos sp. – Miya and Nishida Citation2000).
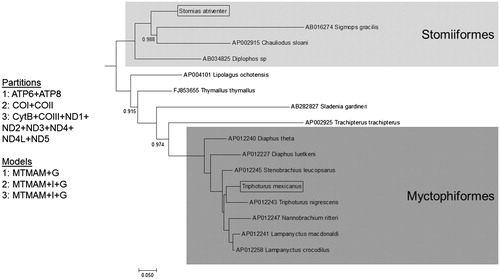
Partitioned Bayesian phylogenetic analysis placed T. mexicanus sister to T. nigrescens with high posterior probability (). S. atriventer placed in the Stomiioformes clade, sister to C. sloani + S. gracilis (). This result is interesting given S. gracilis and Diplophos sp. are thought to be in the same family (Gonostomatidae), however a paraphyletic Gonostomatidae was found in a previous mitogenomic analysis (Miya et al. Citation2001) and the monophyly of the Stomiidae has been challenged with a mitochondrial and nuclear analysis of the family (Kenaley et al. Citation2014).
Figure 1. Partitioned Bayesian phylogenetic tree of 3623 amino acid positions for 16 teleost species, T. mexicanus and S. atriventer are in boxes. Bayesian analysis was run over two chains for 5 × 10⁷ generations, sampling each chain every 103 generations with MrBayes (Ronquist and Huelsenbeck Citation2003). The first 25% of sampled trees were discarded as burning and only posterior probabilities below 1.0 are shown. Genes and models of evolution for each partition are also reported. The MTMAM model of protein evolution (Cao et al. Citation1998; Yang et al. Citation1998) with gamma or gamma plus invariant sites was the best model for each respective partition based on BIC in PartitionFinder2. GenBank accession numbers are shown for additional species included in this analysis.
Acknowledgements
Collections were done with permission from the California Department of Fish and Wildlife (SC-7388) and under an animal care protocol issued to A. A. from CSULA (#14-3).
Disclosure statement
No potential conflict of interest is reported by the authors.
Additional information
Funding
Related Research Data
References
- Asch RG. 2015. Climate change and decadal shifts in the phenology of larval fishes in the California Current ecosystem. Proc Natl Acad Sci. 112:E4065–E4074.
- Cao Y, Janke A, Waddell PJ, Westerman M, Takenaka O, Murata S, Okada N, Pääbo S, Hasegawa M. 1998. Conflict amongst individual mitochondrial proteins in resolving the phylogeny of eutherian orders. J Mol Evol. 47:307–322.
- Cherel Y, Ducatez S, Fontaine C, Richard P, Guinet C. 2008. Stable isotopes reveal the trophic position and mesopelagic fish diet of female southern elephant seals breeding on the Kerguelen Islands. Mar Ecol Prog Ser. 370:239–247.
- Choy CA, Davison PC, Drazen JC, Flynn A, Gier EJ, Hoffman JC, CClain-Counts JP, Miller TW, Popp BN, Ross SW, et al. 2012. Global trophic position comparison of two dominant mesopelagic fish families (Myctophidae, Stomiidae) using amino acid nitrogen isotopic analyses. PLoS One. 7:e50133.
- Iwasaki W, Fukunaga T, Isagozawa R, Yamada K, Maeda Y, Satoh TP, Sado T, Mabuchi K, Takeshima H, Miya M, et al. 2013. MitoFish and MitoAnnotator: a mitochondrial genome database of fish with an accurate and automatic annotation pipeline. Mol Biol Evol. 30:2531–2540.
- Davison P, Lara-Lopez A, Koslow JA. 2015. Mesopelagic fish biomass in the southern California current ecosystem. Deep Sea Res Part II: Top Stud Oceanogr. 112:129–142.
- Dierckxsens N, Mardulyn P, Smits G. 2017. NOVOPlasty: de novo assembly of organelle genomes from whole genome data. Nucleic Acids Res. 45:e18
- Gjøsaeter J, Kawaguchi K. 1980. A review of the world resources of mesopelagic fish (No. 193-199). Rome: Food and Agriculture Organization of the United Nations. FAO Fish Tech Pap 193.
- Kaartvedt S, Staby A, Aksnes DL. 2012. Efficient trawl avoidance by mesopelagic fishes causes large underestimation of their biomass. Mar Ecol Prog Ser. 456:1–6.
- Kenaley CP, DeVaney SC, Fjeran TT. 2014. The complex evolutionary history of seeing red: molecular phylogeny and the evolution of an adaptive visual system in deep-sea dragonfishes (Stomiiformes: Stomiidae). Evol. 68:996–1013.
- Koslow JA, Goericke R, Lara-Lopez A, Watson W. 2011. Impact of declining intermediate-water oxygen on deepwater fishes in the California Current. Mar Ecol Prog Ser. 436:207–218.
- Lanfear R, Frandsen PB, Wright AM, Senfeld T, Calcott B. 2016. PartitionFinder 2: new methods for selecting partitioned models of evolution for molecular and morphological phylogenetic analyses. Mol Biol Evol. 34:772–773.
- Miya M, Kawaguchi A, Nishida M. 2001. Mitogenomic exploration of higher teleostean phylogenies: a case study for moderate-scale evolutionary genomics with 38 newly determined complete mitochondrial DNA sequences. Mol Biol Evol. 18:1993–2009.
- Poulsen JY, Byrkjedal I, Willassen E, Rees D, Takeshima H, Satoh TP, Shinohara G, Nishida M, Miya M. 2013. Mitogenomic sequences and evidence from unique gene rearrangements corroborate evolutionary elationships of myctophiformes (Neoteleostei). BMC Evol Biol. 13:111.
- Miya M, Nishida M. 2000. Use of mitogenomic information in teleostean molecular phylogenetics: a tree-based exploration under the maximum-parsimony optimality criterion. Mol Phylogenet Evol. 17:437–455.
- Ronquist F, Huelsenbeck JP. 2003. MrBayes 3: Bayesian phylogenetic inference under mixed models. Bioinformatics. 19:1572–1574.
- Yang Z, Nielsen R, Hasegawa M. 1998. Models of amino acid substitution and applications to mitochondrial protein evolution. Mol Biol Evol. 15:1600–1611.