
Abstract
In this study, the complete mitochondrial genome (mitogenome) of Helice sheni was amplified and analyzed. The mitogenome is 16,062 bp in length, encoding the standard set of 13 protein-coding genes, 22 tRNA genes, 2 rRNA genes, and one control region. The nucleotide frequency of the mitogenome is as follows: A, 34.81%; C, 23.24%; G, 12.68%; and T, 29.25%. Eight overlapping areas and 22 intergenic spacers were found in the complete mitogenome. The typical initiation codon (ATT) and stop codon (TAA) were observed in eight genes, respectively. The phylogenetic tree indicates that Helicana wuana is closely related to H. sheni.
Helice sheni is widely distributed in China. However, limited research has been done on it. Mitochondrial DNA information is very important for species identification and phylogenetic analysis (Nishimoto et al. Citation2017). In this study, the complete mitochondrial genome (mitogenome) of H. sheni was firstly determined. Our results provide essential data for the studies of population genetics and phylogenetic analysis.
In this study, the samples of H. sheni (accession number B0041-1) were collected from Chongming, China. (122°0′13.68″, 31°28′18.53″). The specimen was stored in Sample Room of East China Sea Environmental Monitoring Center. Genomic DNA was extracted from muscle. The mitogenome was sequenced using Shot Gun Sequencing (Batzoglou et al. Citation1999). Then all the sequences obtained were analyzed and assembled using the software BioEdit (Hall Citation1999). The location of tRNAs was determined by using tRNA scan-SE 1.21 (Schattner et al. Citation2005).
The complete mitogenome of H. sheni (Genbank accession MH593562) was determined in this study. The length of the mitogenome is 16,062 bp, consisting of 13 protein-coding genes (PCGs), 22 tRNA genes, 2 rRNA genes, and one noncoding control region (D-loop regions). The overall base composition is 34.81%, 23.24%, 12.68%, and 29.25% for A, C, G, and T, respectively, with slight A–T bias (64.06%). The genes ND1, ND4, ND4L, ND5, 12S rRNA, 16S rRNA, tRNA-Cys, tRNA-Gln, tRNA-His, tRNA-Leu, tRNA-Phe, tRNA-Pro, tRNA-Tyr, and tRNA-Val are encoded on the light strand of the mitogenome, whereas the remaining genes are encoded on the heavy strand. In the complete mitogenome, 8 overlapping areas (22 bp in total) are observed and the length of overlapped sequence is 1–7 bp. A total of 22 intergenic spacers (536 bp in total) are found ranging from 1 to 93 bp. Seven pairs of genes are directly adjacent without intergenic or overlapping nucleotides. In general, ATG is the typical initiation codon. However, three PCG (ATP6, ND3 and ND6) genes share the ATT initiation codon, while ND1 and ND2 have the ATA and ATC initiation codons, respectively. Most of the PCGs use TAA or TAG as the stop codon, while COX1 uses an incomplete stop codon T. The 12S rRNA and 16S rRNA, with lengths of 813 and 1323 bp, respectively, are both located between tRNA-Leu and tRNA-His. And the length of 22 tRNA genes ranges from 62 to 76 bp.
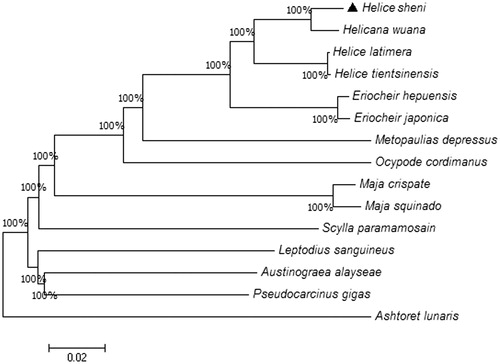
To analyze the phylogenetic relationship among 15 species, a phylogenetic tree was constructed using Neighbor-Joining method by the software MEGA7 () (Kumar et al. Citation2016). The phylogenetic tree deriving from amino acid sequences of 13 PCGs. Helice sheni is closest to Helicana wuana, with H. latimera and H. tientsinensis being the sister taxon. In addition, Eriocheir is the closest taxa with Helice species. This study would provide basic data for genetic analyses in the future.
Figure 1. Neighbor-Joining tree of the amino acid sequences of 13 protein-coding genes. The numbers on the nodes show the bootstrap percentages. The genome sequence in this study is labeled with triangle.
Disclosure statement
The authors report no conflicts of interest. The authors alone are responsible for the content and writing of the paper.
Additional information
Funding
References
- Batzoglou S, Berger B, Mesirov J, Lander ES. 1999. Sequencing a genome by walking with clone-end sequences: a mathematical analysis. Genome Res. 9:1163–1174.
- Hall TA. 1999. BioEdit: a user-friendly biological sequence alignment editor and analysis program for Windows 95/98/NT. Nucleic Acids Symp Ser. 41:95–98.
- Kumar S, Stecher G, Tamura K. 2016. MEGA7: molecular evolutionary genetics analysis Version 7.0 for bigger datasets. Mol Biol Evol. 33:1870–1874.
- Nishimoto M, Okuyama H, Kiyoshi T, Nomura T, Takahashi J. 2017. Complete mitochondrial genome of the Japanese bumblebee, Bombus hypocrita hypocrita (Insecta: Hymenoptera: Apidae). Mitochondrial DNA Part B Resour. 2:19–20.
- Schattner P, Brooks AN, Lowe TM. 2005. The tRNAscan-SE, snoscan and snoGPS web servers for the detection of tRNAs and snoRNAs. Nucleic Acids Res. 33:W686