
Abstract
The complete mitochondrial genome of the banded cusk-eel, Raneya brasilensis (Kaup, 1856), was obtained using next-generation sequencing approaches. The genome sequence was 16,881 bp and exhibited a novel gene order for a vertebrate. Specifically, the WANCY and the nd6 – D-loop regions were re-ordered, supporting the hypothesis that these two regions are hotspots for gene rearrangements in Actinopterygii. Phylogenetic reconstructions confirmed that R. brasiliensis is nested within Ophidiiformes. Mitochondrial genomes are required from additional ophidiins to determine whether the gene rearrangements that we observed are specific to the genus Raneya or to the subfamily Ophidiinae.
Mitochondrial (mt) gene orders are extremely conserved in vertebrates. In fish (Actinopterygii), only 35 departures from the canonical mt gene order have been described, whereas over 2000 species have been sequenced (Satoh et al. Citation2016). In contrast, the vertebrate sister clade – the tunicates – demonstrates extreme gene order variability, in which each of the sequenced genera presents a different gene order (Gissi et al. Citation2010; Rubinstein et al. Citation2013). Consequently, finding a new gene order in Actinopterygii is a rare event. The banded cusk-eel (Raneya brasiliensis [Kaup, 1856]) is a demersal fish present along the eastern coast of South America, from southern Brazil to northern Argentina. We report here a new mt gene order for this species.
The R. brasiliensis specimen we studied was collected in Argentina (43.374000 S 64.901944 W), as bycatch from a shrimp beam trawler. The sample has been deposited in the Invertebrate collection of Museo de La Plata, FCNyM-UNLP, Argentina, Acc. Number MLP-CRG 420. Our original aim was to characterize a myxozoan parasite of this species. DNA was extracted from myxozoan-infected tissue using a DNeasy Blood & Tissue Kit (Qiagen, Germantown, MD). A dual-indexed Illumina library was created using a Wafergen Biosystems Apollo 324 NGS Library Prep System (TakaraBio, Mountain View, CA), then paired-ended sequencing (150 bp), was performed on an Illumina HiSeq 3000 (Illumina, San Diego, CA) by the Center for Genome Research and Biocomputing of Oregon State University (USA). DNA reads were assembled using IDBA-UD as implemented in IDBA-1.1.1 (Peng et al. Citation2010) and the fish mt sequence was identified using BLAST searches. Reads were mapped with Geneious Pro version 9.0.5 using ‘High Sensitivity’ and mapping only paired reads which ‘map nearby’. Among the ∼189,000,000 reads obtained, the mean coverage of the fish mitogenome was computed with Geneious Pro and estimated to be ∼40,000 (SD ∼ 6000; Min = 22,740; Max = 60,423). Annotation was performed with MitoAnnotator (http://mitofish.aori.u-tokyo.ac.jp/annotation/input.html, last accessed 2017 Nov) (Iwasaki et al. Citation2013). The complete mt sequence of R. brasiliensis was submitted to the DNA databank of Japan (accession number LC341245).
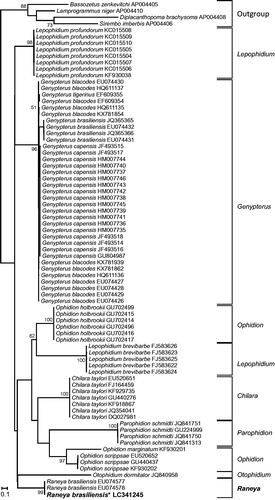
The fish identification to species level was confirmed by constructing a phylogenetic tree based on cox1 sequences, as recommended by Botero-Castro et al. (Citation2016). All cox1 sequences of Ophidiinae available on 7 December 2017 were downloaded from The National Center for Biotechnology Information (NCBI). Other Ophidiiforms with complete mt sequences were used as outgroups. Cox1 sequences were aligned with MAFFT 7.308 (Katoh and Standley Citation2013) under the L-ins-i algorithm. A phylogenetic tree was reconstructed with RaxML 7.4.2 (Stamatakis Citation2006) using codon partitions under the GTRGAMMA model. Bootstrap percentages (BP) were computed using the rapid bootstrap option.
The phylogenetic position of R. brasiliensis among Ophidiiformes was investigated using all mt protein-coding genes encoded on the H-strand. The nd6 gene and overlapping gene regions were discarded. Each protein-coding gene was aligned separately with MAFFT, as described above. A maximum likelihood (ML) tree was reconstructed with RaxML 7.4.2 as described above, with different model parameters for each codon partition of each protein-coding gene. In addition, a Bayesian reconstruction was performed using MrBayes 3.2.2 (Ronquist et al. Citation2012) for 12,500,000 generations under default mcmc settings. The partitions and substitution models were the same as those for the ML analysis.
The R. brasiliensis mt genome was 16,881 bp, slightly longer than other Ophidiiformes (16,090–16,564 bp). Surprisingly, we identified that the mt gene order was rearranged compared with the standard Actinopterygii gene order (). Specifically, we observed different orders in two regions: the WANCY tRNA gene cluster and the nd6 – D-loop region. All rearranged genes had retained their original strand direction, as observed in other Ophidiiformes. In R. brasiliensis, the trnN was transposed to the end of the ‘WANCY’ region, presenting a gene order of WACYN (). The exact position of the origin of light-strand replication (OL), which is usually located between trnN and trnC in Actinopterygii, could not be determined. Concerning rearrangement of the nd6 – D-loop region, in the standard mitochondrial gene order the cytb gene is usually flanked by the trnE and trnT on its 5′- and 3′-ends, respectively (). In R. brasiliensis, the cytb gene was flanked by non-coding regions and the nd6 + trnE gene region was transposed downstream of the cytb gene. The trnE is now flanked by the trnP at its 3′-end. This indicated that both nd6 + trnE and trnT gene regions have been transposed. The trnT is now found downstream to the D-loop (or control region), and is flanked at its 3′-end by a pseudo-trnP, which suggests that the transposition of the trnT involved the duplication of the trnT + trnP region ().
Figure 1. Linearized representation of Raneya brasiliensis mt gene order (A) compared with the typical Actinopterygii mt gene order (B) and with Carapus bermudensis mt gene order (C). tRNA genes are designated by single-letter amino acid codes. Genes that have undergone rearrangement in R. brasiliensis (A) and C. bermudensis (C) are connected with lines to their corresponding location in the typical Actinopterygii gene order (B). Genes encoded on the L-strand are underlined. The phylogenetic position of R. brasiliensis and C. bermudensis among Ophidiiformes was reconstructed based on mt protein-coding genes (D). All species possess the typical Actinopterygii mt gene order except R. brasiliensis and C. bermudensis, which are indicated in bold. Bootstrap supports above 50% and Bayesian posterior probabilities are indicated near the corresponding nodes, separated with a slash. The mt sequence of the specimen obtained in this work is indicated in bold and with an asterisk.
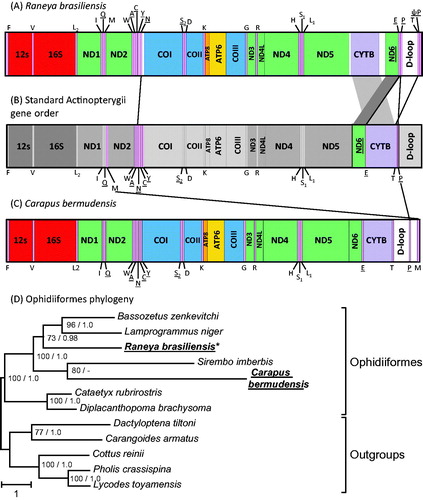
Our phylogenetic reconstruction based on cox1 sequences () confirmed that the obtained sequence clusters with other R. brasiliensis (EU074577 and EU074578 (Mabragaña et al. Citation2011)) with maximal support value (BP = 100). The 652 bp cox1 sequences of the three specimens differed by 1–2 nucleotides only, supporting the correct identification of our sample. We then investigated the position of R. brasiliensis within the Ophidiiformes using mt protein coding sequences (). We found that Raneya (Ophidiinae) was a sister clade of the Neobythitinae Bassozetus zenkevitchi and Lamprogrammus niger with high support (BP = 73; posterior probability PP = 0.98). In agreement with Miya et al. (Citation2003), our analyses did not recover the monophyly of Ophidiidae, as Carapus bermudensis (Carapidae, Carapinae) is the sister clade of Sirembo imberbis (Neobythitinae) ().
Figure 2. Maximum likelihood tree of Ophidiinae cox1 sequences. The cox1 sequence of the specimen obtained in this work is indicated in bold and with an asterisk. Bootstrap supports above 50% are indicated near the corresponding node.
Mitochondrial gene order is highly conserved among vertebrates, thus finding a novel rearrangement is a rare event. In this study, we identified multiple unique rearrangements in R. brasiliensis, a representative of the Ophidiiformes. Interestingly mt rearrangements have been described in another member of the Ophidiiformes – C. bermudensis (Miya et al. Citation2003; Satoh et al. Citation2016). However, the rearrangements in Carapus and Raneya differ. In Carapus, they involve the trnP and trnM, which are located downstream of the D-loop (). Our phylogenetic analyses () showed that Carapus and Raneya are not closely related, and are both more closely related to species that have a standard Actinopterygii gene order. These findings support the hypotheses that mt rearrangements occurred independently in Carapus and Raneya, and that the Ophidiiformes constitute a hotspot for gene rearrangement.
Gene rearrangements in Actinopterygii occur more frequently in the WANCY and the region from the nd5 to the D-loop (Satoh et al. Citation2016). Our results support this view as the R. brasiliensis rearrangements occurred in these specific regions. Tandem duplications followed by random loss is the favoured model to explain mt rearrangements in vertebrates (Satoh et al. Citation2016). Our finding of a duplicated pseudo-trnP gene in R. brasiliensis supports this view. However, the tandem duplication-random loss model would require at least three separate events of duplication with multiple gene losses, in the lineage leading to Raneya. Additional sequencing of members of the Ophidiinae should shed light on the origins of the novel Raneya gene order. Additional data should also reveal whether the gene order we observed in Raneya is shared by other members of the Ophidinae or whether it is specific to Raneya.
Acknowledgements
We thank Naomi Paz for her help with English editing and Dayana Yahalomi for her help with the assemblies.
Disclosure statement
No potential conflict of interest was reported by the authors.
Additional information
Funding
References
- Botero-Castro F, Delsuc F, Douzery EJP. 2016. Thrice better than once: quality control guidelines to validate new mitogenomes. Mitochondrial DNA Part A. 27:449–454.
- Gissi C, Pesole G, Mastrototaro F, Iannelli F, Guida V, Griggio F. 2010. Hypervariability of ascidian mitochondrial gene order: exposing the myth of deuterostome organelle genome stability. Mol Biol Evol. 27:211–215.
- Iwasaki W, Fukunaga T, Isagozawa R, Yamada K, Maeda Y, Satoh TP, Sado T, Mabuchi K, Takeshima H, Miya M, et al. 2013. MitoFish and MitoAnnotator: a mitochondrial genome database of fish with an accurate and automatic annotation pipeline. Mol Biol Evol. 30:2531–2540.
- Katoh K, Standley DM. 2013. MAFFT multiple sequence alignment software version 7: improvements in performance and usability. Mol Biol Evol. 30:772–780.
- Mabragaña E, Díaz de Astarloa JM, Hanner R, Zhang J, González Castro M. 2011. DNA barcoding identifies Argentine fishes from marine and brackish waters. PLoS One. 6:e28655.
- Miya M, Takeshima H, Endo H, Ishiguro NB, Inoue JG, Mukai T, Satoh TP, Yamaguchi M, Kawaguchi A, Mabuchi K, et al. 2003. Major patterns of higher teleostean phylogenies: a new perspective based on 100 complete mitochondrial DNA sequences. Mol Phylogenet Evol. 26:121–138.
- Peng Y, Leung HCM, Yiu SM, Chin FYL. 2010. IDBA – a practical iterative de Bruijn graph de novo assembler. In: Berger B, editor. Research in Computational Molecular Biology: 14th Annual International Conference, RECOMB 2010, Lisbon, Portugal, April 25-28, 2010 Proceedings. Berlin, Heidelberg: Springer Berlin Heidelberg; p. 426–440.
- Ronquist F, Teslenko M, van der Mark P, Ayres DL, Darling A, Höhna S, Larget B, Liu L, Suchard MA, Huelsenbeck JP. 2012. MrBayes 3.2: efficient Bayesian phylogenetic inference and model choice across a large model space. Syst Biol. 61:539–542.
- Rubinstein ND, Feldstein T, Shenkar N, Botero-Castro F, Griggio F, Mastrototaro F, Delsuc F, Douzery EJP, Gissi C, Huchon D. 2013. Deep sequencing of mixed total DNA without barcodes allows efficient assembly of highly plastic ascidian mitochondrial genomes. Genome Biol Evol. 5:1185–1199.
- Satoh TP, Miya M, Mabuchi K, Nishida M. 2016. Structure and variation of the mitochondrial genome of fishes. BMC Genomics. 17:719.
- Stamatakis A. 2006. RAxML-VI-HPC: maximum likelihood-based phylogenetic analyses with thousands of taxa and mixed models. Bioinformatics. 22:2688–2690.