
Abstract
The New England cottontail (Sylvilagus transitionalis) is the focus of extensive efforts to conserve the species. A major component of their conservation program is the collection of faecal samples to determine their distribution and abundance throughout their range. In parts of their range, New England cottontail is sympatric with a non-native eastern cottontail (S. floridanus) and snowshoe hare (Lepus americanus). Because faecal samples from all three lagomorphs are indistinguishable, a reliable molecular genetic method for specimen identification is necessary. We tested the efficacy of a diagnostic character method by analyzing sequence data from 1770 faecal, blood, and tissue samples collected from five states in the Northeastern United States. The method amplified a portion of the mitochondrial DNA control region and identified numerous diagnostic characters for each species. Two suspected nuclear mitochondrial DNA sequences (NUMTs) also were identified when a universal primer was used in the polymerase chain reaction. Our study could be the first evidence of a NUMT in a lagomorph and highlights the importance of using taxon-specific primers for species identification.
Introduction
The New England cottontail (Sylvilagus transitionalis) is native to the Northeastern United States and the focus of a large effort to conserve the species (Fuller and Tur Citation2012). One suspected cause for New England cottontail’s decline is the introduction of non-native eastern cottontails (S. floridanus ssp.) (Litvaitis et al. Citation2008). In parts of New England cottontail’s range, they also are sympatric with snowshoe hare (Lepus americanus). A major component of the New England cottontail conservation program is the collection of faecal samples to determine their distribution and abundance throughout their range to monitor their status (Fuller and Tur Citation2012). Faecal samples from all three lagomorphs are observationally indistinguishable.
Studies that use DNA extracted from faecal samples frequently analyze mitochondrial DNA (mtDNA) because of its greater abundance in the cell compared to nuclear DNA, which increases polymerase chain reaction (PCR) amplification success rates (Waits and Paetkau Citation2005). The amplified PCR product of a specimen can then be sequenced and compared to diagnostic nucleotide characters that are fixed for a given species. The theoretical rationale for using this method is based on the Phylogenetic Species Concept (Cracraft Citation1983), that defines species as having fixed characters that are inherited (Groves and Grubb Citation2011). This method has been used for many purposes including the identification of new or cryptic species (Amato et al. Citation1999) and as a tool for identifying specimens to species that have been well documented (DeSalle et al. Citation2005; DeSalle Citation2006).
The analysis of mtDNA sequences can have several pitfalls, including transfer of mtDNA into the nuclear genome (NUMT; Lopez et al. Citation1994). If NUMTs are included in a dataset, they could lead to spurious phylogenetic and population genetic analyses (Zhang and Hewitt Citation1996). The objective of this study was to construct and test the efficacy of an mtDNA diagnostic character method to distinguish among three sympatric lagomorphs. We focused on the control region of the mitochondrial genome because it has been used in many previous New England cottontail studies (Litvaitis and Litvaitis Citation1996; Kovach et al. Citation2003; Litvaitis et al. Citation2006; Fenderson et al. Citation2011; Fenderson et al. Citation2014; Kilpatrick et al. Citation2013) and it has a high rate of mutation. A reliable method of specimen identification is critical to inform management decisions to conserve New England cottontail.
Methods
Sample collection
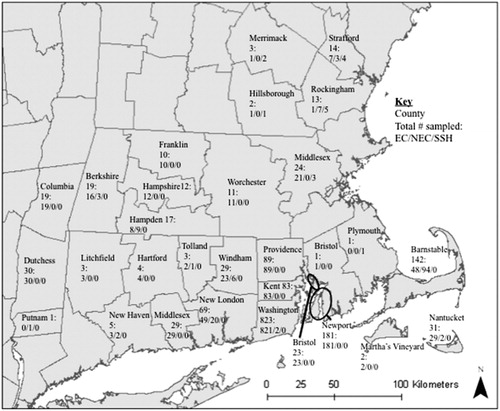
A regional effort was conducted to collect Lagomorph samples (N = 1798) from five Northeastern states from 2003 to 2012 (). The vast majority of samples were faecal (n = 1372), but we also included 375 tissue/blood samples. The faecal samples were not identified to individual and may have included multiple samples from the same animal (Supplemental Table 1). We stored samples in 15 ml tubes containing 100% ethanol or silica beads as the preservative. We collected blood samples on Whatman FTA™ cards (GE Healthcare UK Limited). The University of Rhode Island’s (URI) Institutional Animal Use and Care Committee approved our sample collection methods (approval # AN11-12-011).
Figure 1. Eastern cottontail (EC), New England cottontail (NEC), and snowshoe hare (SSH) samples identified in 5 Northeastern states from 2003 to 2012, by county. Samples with unknown county locations are as follows: 9/14/0 for Connecticut, 1/15/0 for Massachusetts, 0/0/2 for New Hampshire, and 36/0/0 for Rhode Island for EC/NEC/SSH, respectively.
DNA extraction, amplification, and sequencing
We extracted DNA from faecal and tissue samples using the Qiagen QIAamp® DNA Stool Mini Kit (Qiagen Sciences, Maryland) and Qiagen DNeasy® blood and tissue kit, respectively. For blood samples, we extracted DNA using either the Whatman® FTA® starter pack purification kit or DNeasy® kit. To test for contamination of reagents we included negative controls.
We amplified a 565 base pairs (bp) portion of the mtDNA control region using published primers for samples collected in the 2011 field season. The forward primer (L15934) is Sylvilagus specific (Litvaitis et al. Citation1997) while the reverse primer (H16498) is a universal mammalian primer (Shields and Kocher Citation1991). We developed a new reverse primer specifically for S. transitionalis and S. floridanus (H16442; 5′-ATGGGCCCGGAGCGAGAAGA-3′), which amplifies a 480 bp sequence when paired with L15934. We executed the polymerase chain reaction (PCR) in 25 μl reactions using TopTaqmaster® mix kit (Qiagen Sciences) and submitted amplicons for Sanger sequencing to the URI Genomic Sequencing Center.
Barcode construction and testing
We used sequences from specimens identified to species based on skull characteristics (Godin Citation1977) and sequences deposited in the National Center for Biotechnology Information database as known samples. For New England cottontails, we used one sequence found on the NCBI database (GenBank accession: AF002244) and three tissue samples with accompanying skulls. For eastern cottontails, we used two sequences from the NCBI database (GenBank accession: AF002243 and JN037408) and five tissue samples with accompanying skulls. For snowshoe hare, we used two partial control region sequences (GenBank accession: HM771307 and HM771308) and one full mitochondrial genome sequence (GenBank accession: NC_02043). We aligned sequences using the Clustal W 2.011 cost matrix (Larkin et al. Citation2007) option in Geneious Pro 5.4.6 (Biomatters, New Zealand) to create an initial barcode and for all alignment analyses. To reduce the number of gaps created for the alignment we used a high gap open cost (20), a high gap extension cost (20), and manually checked for unnecessary gaps and manually checked each diagnostic character against each haplotype. If a character was not constant for all haplotypes, we discarded it.
To ensure all haplotypes from a given species were monophyletic, we conducted phylogenetic analyses using MrBayes 2.3 (Huelsenbeck and Ronquist Citation2001; Ronquist and Huelsenbeck Citation2003). Because the family Ochotonidae is basal to both Sylvilagus and Lepus, based on Robinson and Matthee (Citation2005), we used the plateau pika (Ochotona curzoniae: GenBank accession: NC011029) as the outgroup. To estimate the intra and interspecific genetic distances from the aligned haplotypes (i.e. barcoding gap; Meyer and Paulay Citation2005), we calculated pairwise distances using MEGA6.06 (Tamura et al. Citation2013) with a Kimura-2-parameter model (Kimura Citation1980). Once we identified diagnostic characters, we tested their accuracy by blindly analyzing 55 tissue samples that the Massachusetts Division of Fisheries and Wildlife independently identified to species based on skull characteristics.
Results
We obtained quality sequences and identified to species 99% (1770 of 1798) of all the collected samples (Supplemental Table 1). For eastern cottontails, New England cottontails, and snowshoe hare we identified 18, 12, and 32 diagnostic characters for specimen identification, respectively (, Supplemental Figure 1). We found 101 eastern cottontail haplotypes (GenBank accession: KC923306-KC923406), 12 New England cottontail haplotypes (GenBank accession: KC923407-KC923418), eight snowshoe hare haplotypes (GenBank accession: KC23298-KC923305), and two suspected non-mitochondrial haplotypes Sth008 and Sth009 (GenBank accession: KC923419 and KC923420, respectively). We excluded Sth008 and Sth009 in barcode construction and the estimates of intra and interspecific genetic distances because they did not amplify when we used both species-specific primers.
Figure 2. Mitochondrial DNA control region nucleotides used for specimen identification to distinguish among three lagomorph species: eastern cottontail (Sylvilagus floridanus), New England cottontail (S. transitionalis), and snowshoe hare (Lepus americanus). Highlighted nucleotides are diagnostic characters (DC) and vertical numbers above nucleotide position indicate their position in the sequence alignment inclusive of all haplotypes, relative to the reference sequence (GenBank accession: NC024043) starting at position 15357 and ending at 15895. A – indicates a gap in the alignment. Only diagnostic characters are shown here. Supplemental Figure 1 should be used for sequence alignment for species identification.
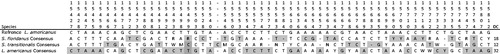
The Bayesian phylogenetic tree placed haplotypes from the three species together, except for haplotypes Sth008 and Sth009, with strong clade credibility values. Haplotypes Sth008 and Sth009 grouped together and appeared on the tree basal to all other New England and eastern cottontail haplotypes (Supplemental Figure 2). The barcode gap histogram showed no overlap between the intra- and interspecific genetic distances for the taxa in this study (Supplemental Figure 3). Interspecific genetic distances between species ranged from 0.113 to 0.410. Intraspecific genetic distances ranged from 0.000 to 0.011 for New England cottontail, 0.000 to 0.076 for eastern cottontails, and 0.002 to 0.022 for snowshoe hare. The diagnostic character identification matched the skull character identification for 54 of the 55 specimens. The mismatched sample was a juvenile animal and we suspect that the skull was misidentified. Haplotypes Sth008 and Sth009 were not detected when the species-specific primer (H16442) was used to PCR amplify the same DNA extractions (n = 3). These sequences were only produced when we used the universal reverse primer (H16498) for PCR amplification.
Discussion
Management of New England cottontail is dependent on a reliable diagnostic assay to guide noninvasive genetic monitoring. Other studies have used restriction enzyme methods for species identification (Litvaitis and Litvaitis Citation1996; Kovach et al. Citation2003), but they are reliant on a more limited number of DNA nucleotides at the restriction enzymes’ recognition sites. The mtDNA specimen identification method we developed for S. transitionalis, S. floridanus, and L. americanus employs a barcode with numerous diagnostic characters that are robust to new haplotype variation as long as at least one diagnostic character is retained. Furthermore, a rabbit-specific reverse primer developed during this study shows no evidence of preferentially amplifying non-mtDNA (e.g. haplotypes Sth008 and Sth009), whereas this study has found that the universal mammalian primer may do so in some samples. We do not suspect that Sth008 and Sth009 are occurrences of mtDNA polymorphism within an individual (i.e. heteroplasmy). While heteroplasmy has been reported in rabbit mtDNA, the heteroplasmy has been limited to length variation due to tandem repeats (Biju-Duval et al. Citation1991; Casane et al. Citation1997; Casane and Guéride Citation2002). Our suspected pseudogene sequences appear more basal on our phylogenetic tree, which is an indication of a nuclear origin due to slower mutation rates found in nuclear DNA (Bensasson et al. Citation2001; Brown et al. Citation1979; Triant and DeWoody Citation2007). While we do not have conclusive evidence that haplotypes Sth008 and Sth009 originate from the nucleus, our results suggest that these haplotypes are not true mtDNA haplotypes. Our study could be the first evidence of a NUMT in a lagomorph and highlights the importance of using taxon-specific primers for species identification.
Supplemental Material
Download Zip (481.2 KB)Acknowledgements
We thank the following individuals and organizations: project advisor Dr. J. Kolbe (University of Rhode Island); members of the University of Rhode Island’s Wildlife Genetics and Ecology Laboratory (J. Atoyan, and R. Herron); Dr. T. King (US Geological Survey) for providing full mtDNA genomes for S. floridanus and S. transitionalis; those who helped collect samples including Dr. H. Kilpatrick and T. Goodie (CT Department of Energy and Environmental Protection), E. McGourty and K. Block (US Fish and Wildlife Service), S. Paventy (MA Army National Guard), D. Scarpitti (MA Division of Fish and Wildlife), H. Holman (NH Fish and Game Department), P. Novak (NY Department of Environmental Conservation), RI Department of Environmental Management (W. Finn, and C. Mchorter), US Fish and Wildlife Service (S. Paton, C. Corsair, K. Molloy, J. Cressman, K. Rogers, R. Kleinert, and B. Gaspar), and the University of Rhode Island undergraduate volunteers; Mr. A. McLachlan for sample site identification.
Data accessibility
GenBank accession numbers are KC23298-KC923420 and all samples, except skull samples used for barcode testing, are archived at the University of Rhode Island’s Wildlife Genetics and Ecology Laboratory.
Disclosure statement
No financial interest or benefit has arisen from the direct application of this research. The authors report no conflicts of interest.
Additional information
Funding
References
- Amato G, Egan MG, Schaller GB, Baker RH, Rosenbaum HC, Robichaud WG, DeSalle R. 1999. Rediscovery of Roosevelt's barking deer (Muntiacus rooseveltorum). J Mammal. 80:639–643.
- Bensasson D, Zhang D-X, Hartl DL, Hewitt GM. 2001. Mitochondrial pseudogenes: evolution’s misplaced witnesses. Trends Ecol Evol. 16:314–321.
- Biju-Duval C, Ennafaa H, Dennebouy N, Monnerot M, Mignotte F, Soriguer RC, El Gaaied A, El Hili A, Mounolou J-C. 1991. Mitochondrial DNA evolution in Lagomorphs: origin of systematic heteroplasmy and organization of diversity in European rabbits. J Mol Evol. 33:92–102.
- Brown WM, George MJ, Wilson AC. 1979. Rapid evolution of animal mitochondrial DNA. Proc Natl Acad Sci USA. 76:1967–1971.
- Casane D, Dennebouy N, de Rochambeau H, Mounolou JC, Monnerot M. 1997. Nonneutral evolution of tandem repeats in the mitochondrial DNA control region of Lagomorphs. Mol Biol Evol. 14:779–789.
- Casane D, Guéride M. 2002. Evolution of heteroplasmy at a mitochondrial tandem repeat locus in cultured rabbit cells. Curr Genet. 42:66–72.
- Cracraft J. 1983. Species concepts and speciation analysis. In: Johnston R, editor. Current ornothology, vol 1. New York (NY): Plenum Press; p. 159–187.
- DeSalle R. 2006. Species discovery versus species identification in DNA barcoding efforts: response to Rubinoff. Conserv Bio. 20:1545–1547.
- DeSalle R, Egan MG, Siddall M. 2005. The unholy trinity: taxonomy, species delimitation and DNA barcoding. Philos Trans R Soc Lond B Biol Sci. 360:1905–1916.
- Fenderson LE, Kovach AI, Litvaitis JA, Litvaitis MK. 2011. Population genetic structure and history of fragmented remnant populations of the New England cottontail (Sylvilagus transitionalis). Conserv Genet. 12:943–958.
- Fenderson LE, Kovach AI, Litvaitis JA, O'Brien KM, Boland KM, Jakubas WJ. 2014. A multiscale analysis of gene flow for the New England cottontail, an imperiled habitat specialist in a fragmented landscape. Ecol Evol. 4:1853–1875.
- Fuller S, Tur A. 2012. Conservation strategy for the New England cottontail (Sylvilagus transitionalis); 2012. [accessed 2017 April 22]. http://newenglandcottontail.org/sites/default/files/conservation_strategy_final_12-3-12.pdf.
- Godin AJ. 1977. Wild mammals of New England. Baltimore (MD): Johns Hopkins University Press.
- Groves C, Grubb P. 2011. Ungulate taxonomy. Baltimore (MD): Johns Hopkins University Press.
- Huelsenbeck JP, Ronquist F. 2001. MRBAYES: Bayesian inference of phylogenetic trees. Bioinformatics. 17:754–755.
- Kilpatrick HJ, Goodie TJ, Kovach AI. 2013. Comparison of live-trapping and noninvasive genetic sampling to assess patch occupancy by New England cottontail (Sylvilagus transitionalis) rabbits. Wildlife Soc Bull. 37:901–905.
- Kimura M. 1980. A simple method for estimating evolutionary rate of base substitutions through comparative studies of nucleotide sequences. J Mol Evol. 16:111–120.
- Kovach AI, Litvaitis MK, Litvaitis JA. 2003. Evaluation of fecal mtDNA analysis as a method to determine the geographic distribution of a rare lagomorph. Wildlife Soc Bull. 31:1061–1065.
- Larkin MA, Blackshields G, Brown NP, Chenna R, McGettigan PA, McWilliam H, Valentin F, Wallace IM, Wilm A, Lopez R, et al. 2007. Clustal W and Clustal X version 2.0. Bioinformatics. 23:2947–2948.
- Litvaitis JA, Barbour MS, Brown AL, Kovach AI, Litvaitis MK, Oehler JD, Probert BL, Smith DF, Tash JP, Villafuerte R. 2008. Testing multiple hypotheses to identify the causes of the decline of a lagomorph species: the New England cottontail as a case study. In: Alves P, Ferrand N, Hackländer K, editors. Lagomorph biology: evolution, ecology, and conservation. New York (NY): Springer-Verlag; p. 167–185.
- Litvaitis MK, Lee W-J, Litvaitis JA, Kocher TD. 1997. Variation in the mitochondrial DNA of the Sylvilagus complex occupying the northeastern United States. Can J Zool. 75:595–605.
- Litvaitis MK, Litvaitis JA. 1996. Using mitochondrial DNA to inventory the distribution of remnant populations of New England cottontail. Wildlife Soc Bull. 24:725–730.
- Litvaitis JA, Tash JP, Litvaitis MK, Marchand MN, Kovach AI, Innes R. 2006. A range-wide survey to determine the current distribution of New England cottontails. Wildlife Soc Bull. 34:1190–1197.
- Lopez J, Yuhki N, Masuda R, Modi W, O'Brien S. 1994. Numt, a recent transfer and tandem amplification of mitochondrial DNA to the nuclear genome of the domestic cat. J Mol Evol. 39:174–190.
- Meyer CP, Paulay G. 2005. DNA barcoding: error rates based on comprehensive sampling. PLoS Biol. 3:e422.
- Robinson TJ, Matthee CA. 2005. Phylogeny and evolutionary origins of the Leporidae: a review of cytogenetics, molecular analysis and supermatrix analysis. Mammal Rev. 35:231–247.
- Ronquist F, Huelsenbeck JP. 2003. MRBAYES 3: Bayesian phylogenetic inference under mixed models. Bioinformatics. 19:1572–1574.
- Shields GF, Kocher TD. 1991. Phylogenetic relationships of North American ursids based on analysis of mitochondrial DNA. Evolution. 45:218–221.
- Tamura K, Stecher G, Peterson D, Filipski A, Kumar S. 2013. MEGA6: Molecular Evolutionary Genetics Analysis version 6.0. Mol Biol Evol. 30:2725–2729.
- Triant DA, DeWoody JA. 2007. The occurrence, detection, and avoidance of mitochondrial DNA translocations in mammalian systematics and phylogeography. J Mammal. 88:908–920.
- Waits LP, Paetkau D. 2005. Noninvasive genetic sampling tools for wildlife biologists: a review of applications and recommendations for accurate data collection. J Wildl Manage. 69:1419–1433.
- Zhang D-X, Hewitt GM. 1996. Nuclear integrations: challenges for mitochondrial DNA markers. Trends Ecol Evol (Amst). 11:247–251.