
Abstract
Pseudoregma bambucicola is an economically significant bamboo pest which is highly reproductive found in Eastern Asia that influences the normal growth of bamboo, induces the formation of sooty molds, and even causes substantial injury or death among young bamboos. This study provides a theoretical and practical basis for the comprehensive prevention and control of Pseudoregma bambucicola. The results showed that 10 geographical populations of Pseudoregma bambucicola showed high genetic diversity (Hd = 0.879 PI + 0.075, =0.08295 + 0.03901) and the average genetic distance was 0.018. In the haplotype phylogenetic tree constructed, the branches of MP tree and BI tree were basically the same, the Sichuan Basin was clustered into one and the populations from other provinces were clustered into a large branch and had a high posterior probability (the posterior probability of MP tree was 99% and the posterior probability of BI tree was 1). The NJ tree showed the differences among the 10 geographies. It was found that the experimental results were consistent with the actual geographical conditions because different geographical Pseudoregma bambusicola experienced natural isolation due to the possible impact of the natural environment, resulting in no genetic exchange between them, thus having a great genetic variability and high genetic diversity.
Introduction
Pseudoregma bambucicola, also known as Takahashi, belongs to the order Hemiptera, the family Hormaphididae and the genus Pseudoregma and is recognized as one of the most common bamboo pests in Japan, China and other Asian eastern and southern regions (Deng et al. Citation2012; Nong et al. Citation2017). Pseudoregma bambucicola is usually small with a body of 3 mm in length and 2 mm in width of an adult. This pest has a rapid propagation and a complex life cycle (Shu et al. Citation2015; Nong et al. Citation2017) The P. bambucicola mainly infects the stem of the bamboo and with host bias towards the bamboo species Bambusa multiplex. The damage caused by P. bambucicola is limited on the surface of the bamboo, which seriously affects the growth; moreover, the secreted honeydew and excrement of P. bambucicola can also form blocks and carbonate the rod, which can kill the bamboo directly (Yu et al. Citation2017). Although P. bambucicola poses severe threats to bamboo industry, there have been no studies about its genetics and likely dynamic evolution so far. Lacking of such information may impede our insights into pest survival and responses to host change, as well as pest control.
The mitochondrial (mt) cytochrome b (Cytb) gene has proven to be one of the most clearly understood genes not only because the evolutionary speed of this gene is moderate and therefore can be used for molecular markers in phylogenetic and genetic studies but it can unveil genetic diversity of pest species and depict likely evolutionary histories of pests (Gray Citation1989; Meyer Citation1994). Prior studies have shown that Cytb effective indicator in exploring genetic and systemic differentiation of interspecific and intraspecific relationships in various pests and parasites (Li Citation2011). However, the research on the genetic differentiation of mt Cytb genes of P. bambucicola in different geographical populations remains known. Previously, one study by Takema et al. (Citation2001) showed the phylogeny of P. bambucicola but more sampling is still needed (Takema et al. Citation2001); importantly, until now, there has been lacking of information about the genetic diversity of P. bambucicola.
The present study aimed to investigate the population of the genetic diversity and structure of P. bambusicola in 10 locations in China by sequencing the mitochondrial Cytb gene. Based on the analysis of the base composition, genetic distance, and genetic diversity, we would have an in-depth understanding of the different geographical populations of P. bambusicola genetic diversity, genetic differentiation, and the relationship between them. Moreover, these results should contribute to the control of P. bambucicola in the bamboo.
Materials and methods
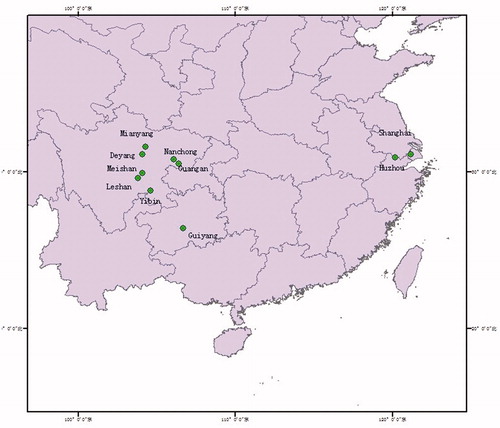
In this study, the samples of P. bambucicola were collected from 10 regions of China (). A total of 30 aphids were isolated from bamboo rods that were infected with P. bambucicola. Considering the small size of P. bambucicola and limited DNA amount from each individual, all samples from one host bamboo at each site was pooled and used for DNA isolation. The genomic DNA extraction kit (Kang Century Biotechnology,Xian) was used to extract DNA of P. bambusicola, after all the pest samples were grounded into powder with liquid nitrogen. A 437-bp sequence was targeted by using the primers (5′-GGACAAATATCATTTTGAGGAGCAACAG-3′, 5′ATTACTCCTCCTAGCTTATTAGGAATTG-3′), which were synthesized by Chengdu Engineers Department of Biosynthesis.
Figure 1. A collection map of the Pseudoregma bambucicola in China.
Amplifications were performed in a total volume of 50 μL containing, 25 μL 2 × Taq Master Mix (including Taq enzyme, dNTP Mixture, MgCl2, and dNTP), 1.3 μL Primer F, 1.3 μL Primer R, 2.5 μL DNA template. PCR conditions were as follows: 94 °C for 2 min followed by 30 cycles of 94 °C for 30 s, 55 °C for 30 s, and 72 °C for 40 s, and 72 °C for 2 min as a final extension. After the PCR products were electrophoresed in the recovery system, the clear gel was separated and purified by an ordinary DNA gel recovery kit. Purified PCR products were then sent to Chengdu Qingke biological sequencing for bidirectional sequencing.
Data analysis
The DNAMAN 6 software (lynnon biosoft, USA) was used to do Cytb positive and negative collation splicing, deleting primer parts, and lowering signal sequences at both ends. The peak value was checked with the Chromas software (Technelysium, Australia), so as to ensure the accuracy of the sequencing results. Nucleotide Blast was performed on the NCBI to confirm that the sequence of the target fragment was correct and that the sequence directions were the same (Xia et al. Citation2016). DNA sequences already stitched were aligned using the BioEdit software (Hall Citation1999) and multiple alignments were performed using the Clustalw Multide alignment software (Thompson et al. Citation1994; Kakishita et al. Citation2003). The haplotype, haplotype diversity index, base content, and nucleotide diversity index were calculated using the DnaSP 5.0 software (Nei Citation1982; Librado and Rozas Citation2009). Using MPUP 4.0b10 (Swofford Citation1998), MEGA 6.0 (Tamura et al. Citation2013) and MrBayes1.0 (Huelsenbeck and Ronquist Citation2001), we constructed the Maximum Parsimony Tree (MP Tree), Neighbor-Joining Tree (NJ Tree), and the Bayesian Inference Tree (BI Tree), respectively.
Results and analysis
A total of 437 Cytb genes were analyzed. The average base composition was 44.8% T, 13.9% C, 33.1% A, and 8.2% G, respectively. The A + T content (77.9%) was much higher than that of G + C (22.1%), and there was a remarkable A + T bias. Among alignment, there were 358 conservative sites, 137 polymorphic sites, 28 simple information sites, 109 self-descending sites, and 152 variation sites, and the variation sites accounted for 34.78%. The result was consistent with the sequence characteristics of insect mitochondrial gene base composition (Liu and Beckenback Citation1992). The haplotype diversity index (Hd) of 10 geographical species was 0.879 ± 0.075, and the nucleotide diversity index (PI) was 0.08295 ± 0.03901.
The genetic distance between the Cytb gene sequences of the 10 geographic populations was calculated based on the nucleotide Kimura 2-parameter model (Kimura Citation1980) (). The genetic distance between the 10 geographical samples of P. bambusicola was between 0.000 and 0.077. The other geographical populations in Sichuan Basin Habitat P. bambusicola genetic distance was relatively short, between 0.000 and 0.003. However, as HZ and SH were located in Yangtze River Delta, the genetic distances between them ranged from 0.006 to 0.008. The genetic distance from the GY habitat and other nine geographical populations ranged from 0.068 to 0.077. Notably, the biggest genetic distances were found between P. bambusicola and the outgroup species Trithemis aurora (ZHQT) and Aphis glycines (DDY). Moreover, eight haplotypes were detected in the Cytb gene sequence of 10 geographical populations, among which Hap3, Hap4, Hap5, Hap6, Hap7, and Hap8 were peculiar to GY, HZ, DY, SH, MY, and GA populations. The populations of LS and MS share the same Hap1 haplotype and the populations of YB and NC share the same Hap2 haplotype.
Table 1. Genetic distance of cytb genes in ten geographical populations of Pseudoregma bambusicola.
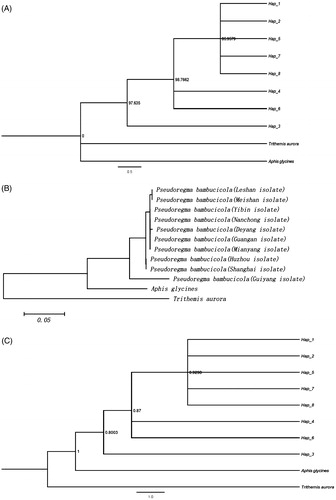
Trithemis aurora and Aphis glycines were used as external groups to construct phylogenetic trees based on MP, NJ, and Bayes (). The phylogenetic tree was divided into three clades, excluding the branches of two external groups. Clade I include Hap1, Hap2, Hap5, Hap7, and Hap8, Clade II includes Hap4 and Hap6, and Clade III includes only Hap3 (). The BI tree polymerize, respectively with Aphis glycines of the outer group soybean aphid and were finally combined with the outer group Trithemis aurora together. The NJ tree was divided into three branches. After LS and MS were clustered together, they were clustered into one large branch with YB, NC, DY, GA, and MY. HZ and SH grouped together. GY was a branch separately. Among them, the LS and MS populations were suggested to be derived from the same maternal lineage and were closely related to the YB, NC, DY, GA, and MY populations and the genetic relationship between the HZ and SH populations was also closer. According to the three phylogenetic trees, the genetic relationship between GY population and other geographic populations was long.
Figure 2. Phylogenetic relationships of Pseudoregma bambusicola. (A) Maximum parsimony (MP Tree). The nodal numbers is MP bootstrap values. Only values above 85% are given. (B) Neighbor joining tree (NJ Tree). (C) Bayesian inference analysis (BI Tree). The nodal numbers are posterior probability (>80%).
Discussion
This study was the first time to survey the genetic diversity of P. bambusicola populations in China . Studying the genetic variation of species is of great help in understanding the origin and evolutionary history of the species (Lohman et al. Citation2008). Eight haplotypes were defined in the sequences of the Cytb gene of P. bambusicola in 10 different geographical populations. Further, the haplotype diversity of P. bambusicola was 0.879 ± 0.075; perhaps, poor gene exchanges between populations might be the reasons for such high haplotype diversity. Moreover, there were 152 variation sites in the Cytb gene fragments of our isolates, which indicated that the genetic diversity and genetic resources of the P. bambusicola were higher and more abundant. These results may be due to the fact that the habitat of P. bambusicola in these areas had not undergone serious bottlenecks or founders' effects and therefore, may have a longer history of population expansion with habitat explanation in these 10 areas to accumulate more genetic variations. Of course, more history events are needed to confirm this assumption.
Among the phylogenetic trees constructed, both the MP tree and the BI tree were haplotype phylogenetic trees and the results of the two were basically the same. The difference was only found at the position where two outer groups cross and all the eight haplotypes were outside. The phylogenetic tree did not reflect the relationship between haplotype distribution and geographical location, whereas the NJ tree corresponded with the relationship between specific geographic populations. The systematic analysis of the population of P. bambusicola in the 10 geographical populations appeared to be more reliable than the haplotype version which may be related to a more complete genetic information in this analysis
Insect migration, geographical isolation, and human activities were likely to affect the species structure of the population (Mendelson and Shaw Citation2005). In this study, the characteristics of the genetic structure of P. bambusicola can be formed in several aspects: the inherent reproductive characteristics (parthenogenesis), the environmental factors, because the same aphid living in different geographical environments may have genetic variations due to environmental causes (Zhang et al. Citation2015). Previously, it was found that P. bambucicola consisted of two genetically distinct geographic groups, the northern group from Japan to Taiwan and the southern group from Thailand to Indonesia (Takema et al. Citation2001). In this study, the genetic distances among the three populations (GY, SH, HZ) of P. bambusicola collected from different regions were long. In addition, the natural and geographical environment of Guizhou province was relatively complex. The high altitude and the climate are changeable and P. bambusicola has weak migration ability due to its inability to fly. The P. bambusicola lived in this environment for a long time, so the genetic structure gradually differentiated with those of others in the process of evolution (Cai et al. Citation2004). Eventually, as natural isolation continued, gene exchanges were impeded and a large genetic variation between them occurred and the genetic distances were relatively long and the relationship between them was far away. The experimental results basically corresponded with geographical reality.
Acknowledgements
We are grateful to Mr. Liu Fangqing, Mr. Zhao Wenhai for their patient guidance on my experiments and data analysis. In addition, I also want to thank all the students and friends for collecting the samples of the Pseudoregma bambusicola.
Disclosure statement
No potential conflict of interest was reported by the authors.
Additional information
Funding
References
- Cai QN, Hu MH, Wang Y, et al. 2004. The factors affecting the genetic diversity of aphid population and molecular basis. Insect Knowl. 4:285–290.
- Deng S, Peng GD, Shu JP, Wang HJ. 2012. Investigation of year-round population dynamics of Pseudoregma bambusicola and its regulating factors. Scientia Silvae Sinivae. 48:103–108.
- Gray MW. 1989. Origin and evolution of mitochondrial DNA. Annu Rev Cell Biol. 5:25–50.
- Hall TA. 1999. BioEdit: a user-friendly biological sequence alignment editor and analysis program for Windows 95/98/NT. Nucl Acids Symp Ser. 41:95–98.
- Huelsenbeck JP, Ronquist R. 2001. MRBAYES: Bayesian inference of phylogenetic trees. Bioinformatics. 17:754–755.1
- Kakishita K, Nakao N, Sakuragawa N, Itakura T. 2003. Implantation of human amniotic epithelial cells prevents the degeneration of nigral dopamine neurons in rats with 6-hydroxydopamine lesions. Brain Res. 980:48–56.
- Kimura M. 1980. A simple method for estimating evolutionary rates of base substitutions through comparative studies of nucleotide sequences. J Mol Evol. 16:111–120.
- Li X. 2011. Research progress on cytb genes in insect mitochondrial DNA. Heilongjiang Sci Tech Inf. 11:3.
- Librado P, Rozas J. 2009. DnaSP v5: a software for comprehensive analysis of DNA polymorphism data. Bioinformatics. 25:1451–1452.
- Liu H, Beckenbach AT. 1992. Evolution of the mitochondrial cyto-chrome oxidase II gene among 10 orders of insects. Mol Phylogenet Evol. 1:41–52.
- Lohman DJ, Peggie D, Pierce NE, Meier R. 2008. Phylogeography and genetic diversity of a widespread old world butterfly, Lampides boeticus (Lepidoptera: Lycaenidae). BMC Evol Biol. 8:301.
- Mendelson TC, Shaw KL. 2005. Use of AFLP markers in surveys of arthropod diversity. Methods Enzymol. 395:161–177.
- Meyer A. 1994. Shortcomings of the cytochrome b gene as a molecular marker. Trends Ecol Evol (Amst). 9:278–280.
- Nei M. 1982. Evolution of human races at the gene level. In: Bonne TB, Cohen T, Goodman RM, editors. Human genetics, part A: the unfolding genome. New York (NY): Alan R Liss. p. 167–181.
- Nong X, Cheng PY, Liang Z, Yang YJ. 2017. Study on bamboo infection in Pseudoregma bambusicola in Leshan City, Sichuan Province. Modern Hortic. 7:16–19.
- Nong X, Zeng XM, Yang YJ, Liang Z, Tang M, Liao LJ, Luo CB. 2017. Morphological observation and characterization of the Pseudoregma bambucicola with the scanning electron microscope. Saudi J Biol Sci. 24:1626–1630.
- Shu JP, Ye BH, Wu XS, Zhang YB, Wang HJ, Xu TS. 2015. Research advances in bamboo pests and their control measures. World Forest Res. 28:50–57.
- Swofford DL. 1998. PAUP*: Phylogenetic analysis using parsimony and other methods. Version 4.0 beta. Sunderland: Sinauer Associates.
- Takema F, Harunobu S, Naruo N, et al. 2001. Genetically distinct populations in an Asian soldier-producing Aphid, Pseudoregma bambucicola (Homoptera: Aphididae), identified by DNA fingerprinting and molecular phylogenetic analysis. Mol Phylogenet Evol. 18:423–433.
- Tamura K, Stecher G, Peterson D, Filipski A, Kumar S. 2013. MEGA6; molecular evolutionary genetics analysis version 6.0. Mol Biol Evol. 30:2725–2729.
- Thompson JD, Higgins DG, Gibson TJ. 1994. CLUSTAL W: improving the sensitivity of progressive multiple sequence alignment through sequence weighting, position-specific gap penalties and weight matrix choice. Nucleic Acids Res. 22:4673–4680.
- Xia XQ, Chen X, Xia CC, Shi QH, Hao JS. 2016. Phylogenetic relationship within and between three major subfamilies of the Chinese lycaenids (Lepidoptera: Lycaenidae) based on mitochondrial COI and Cytb gene sequences. Acta Entomol Sinica. 59:77–84.
- Yu W, Zeng XY, Xu YQ, Zhang DF. 2017. Biological characteristics and control of Pseudoregma bambusicola. Modern Hortic. 7:16–19.
- Zhang J, Ren ZM, Wen J. 2015. Population genetic differentiation of Melaphis rhois inferred from mtDNA COI sequences. J Shanxi Univ (Nat Sci Ed). 38:350–354.