
Abstract
The Indian Ocean maskray, Neotrygon indica, is a recently described species from the Bay of Bengal in the eastern coast of India. The conspicuous morphology and less genetic information of this group are often confusing for their identity and phylogeography. In this study, we have collected the specimens from Odisha coast in eastern India and generated the DNA barcode data for comparative analysis with publicly available barcodes of N. indica and other congeners. The morphological characters are similar to the previous record of N. indica. However, the generated barcode data of N. indica showed 2.2–8.0% inter-species genetic distances with the other six species. The studied population of N. indica showed 0.2–1.5% genetic distances with a different known population (Tamil Nadu, Andhra Pradesh, and Bangladesh) in the Bay of Bengal. The BA phylogeny revealed monophyletic clustering of all the studied species. Henceforth, the shallow genetic divergences within the different population of N. indica depicted possible female precise natal philopatric affinity within their range distribution. To corroborate this unique phylogeographic structure, this study evoked more rigorous sampling and detailing with other molecular markers. This study also exhibits the expand range distribution of N. indica beyond its type locality and furnishes a new state record for Odisha. Our data would be a valuable resource for further studies on genetic diversity of N. indica and related species, which will provide new insights for better conservation plans.
Keywords:
1. Introduction
Dispersal is one of the most significant incidents in faunal life as it plays a pivotal role in inbreeding and population dynamics (Gour et al. Citation2013). The space use varies from species to species owing to their unparalleled dispersal patterns in the earth (Côté et al. Citation2002). Due to several extrinsic factors (e.g. habitat patterns and vicariance), the organisms often showed colonization, genetic discrepancies, and allopatric isolation within the population (Burridge et al. Citation2008). To elucidate the movement behaviour, marine eco-system has the most affordable environment on the planet. However, knowledge of the dispersal patterns and gene flow is even mysterious for numerous animal groups to understand their ecology and evolutionary process (Macdonald and Johnson Citation2001). The dispersal pattern, philopatry is the inclination of an organism to stay in its natal site or selective locality (Mayr Citation1963). To test these homing behaviours, a philopatric study was largely attempted for migratory birds (Hueter et al. Citation2004). Several studies have also been targeted to test this unique trend in a diverse group of terrestrial animals including primates (Purdue et al. Citation2000) and marine biomes (Fitzsimmons et al. Citation1997; Dannewitz et al. Citation2005; Moura et al. Citation2013). Nonetheless, the natal philopatry study was meagerly endeavoured for marine and anadromous cartilaginous fishes in India and the rest of the world.
Maskray (order Myliobatiformes) is an ecologically important component in an oceanic ecosystem with unique body pattern and coloration. So far, the maskray genus, Neotrygon (Dasyatidae) is known by 16 species worldwide (Fricke Citation2019). Among all extant congeners, three species (Neotrygon annotata, Neotrygon caeruleopunctata, and N. indica) were recorded from the Indian Ocean and one species (Neotrygon malaccensis) from eastern Andaman Sea. Later on, based on both morphology and molecular data, a new species N. indica is recently described from Gulf of Mannar, Tamil Nadu, Southern India (Pavan-Kumar et al. Citation2018). The species was further recorded from Visakhapatnam, Andhra Pradesh, and Tuticorin, Tamil Nadu. Besides, the congeners of Neotrygon are widely distributed and taxonomically argued organism in marine environment (Last and White Citation2008; Last et al. Citation2016). Hence, the molecular techniques are largely used to discriminate the species and resolve several systematics queries (Arlyza et al. Citation2013; Borsa et al. Citation2016, Citation2018).
Two main initiatives, FISH-BOL and MarBOL (http://ibol.org/) have begun to generate the DNA barcode data and develop the reference sequence library for all fish species around the world (Ward et al. Citation2009). This global effort facilitates prompt species identification, knowing the distribution pattern, population structure, and conservation genetics (Hebert et al. Citation2003; Hubert et al. Citation2008).This molecular approach with the sequence of nucleo-mitochondrial markers has also brought clear perspectives in the systematics research of elasmobranchs (Salles et al. Citation2016). The technique successfully deals with the 16 species (from 10 genera) of tropical rays and revealed species complex in the blue-spotted maskray, Neotrygon kuhlii (Cerutti-Pereyra et al. Citation2012; Borsa et al. Citation2016). Later on, the phylogeographic pattern was examined in N. kuhlii with seven distinct clades which elucidate their sedentarity and philopatry in Coral Triangle (Arlyza et al. Citation2013). The phylogenetic analysis and population structure further hypothesized the evolutionary pattern of Neotrygon species and correlated with geological events (Puckridge et al. Citation2013; Lim et al. Citation2015). Hence, in this study, we collected the N. indica specimens from close distant from the type locality to elucidate the following biological questions (i) Does the N. indica population of Odisha genetically isolated from the type locality population? and (ii) Does the N. indica follow the female precise natal philopatric affinity corresponds to their different population and collection localities?
2. Materials and methods
2.1. Sample collection and morphological data
Total five specimens were collected from Gopalpur (19.25 N 84.90 E), Odisha state in east India. The specimens were collected from the sea beach and immediately preserved in 70% ethanol. The whole body specimens were deposited in the Estuarine Biology Regional Centre (EBRC), Zoological Survey of India (ZSI), Gopalpur-on-Sea under the voucher registration nos. (EBRC/ZSI/F11081, EBRC/ZSI/F11082, EBRC/ZSI/F11083, EBRC/ZSI/F11084, and EBRC/ZSI/F11085). All the studied specimens were compared with the original description and confirmed as N. indica (Pavan-Kumar et al. Citation2018). The meager amount of tissue samples were collected from each specimen into the 70% hi-grade alcohol and stored to the Centre for DNA Taxonomy laboratory, ZSI, Kolkata under voucher nos. (ZSI_CEF10, ZSI_CEF11, ZSI_CEF12, ZSI_CEF13, and ZSI_CEF14) for further molecular analysis.
2.2. DNA isolation, PCR, and sequencing
The genomic DNA extraction, quantification, gel-electrophoresis, and polymerase chain reaction (PCR) were done as per previous methods (Ward et al. Citation2005). The bio-directional sequencing was performed by 48 capillary ABI 3730 Genetic analyzer, housed at the Zoological Survey of India, Kolkata with following protocols (Laskar et al. Citation2018).
2.3. Dataset preparation and bioinformatics analysis
To make a consensus sequence, the generated chromatograms of both forward and reverse strands were obtained for each sample of N. indica. The annotated sequences were checked in BLASTn search in GenBank and array of amino acid was confirmed for vertebrate mitochondria through the online software open reading frame finder (http://www.ncbi.nlm.nih.gov/gorf/gorf.html). Final barcode sequences were submitted in GenBank via Bankit submission tool and acquired the accession numbers. Based on the similarity search and availability, 26 sequences of same or other congeners were acquired from GenBank. The DNA barcode data (KU499714) of Gymnura poecilura (order Myliobatiformes) was used in the dataset as an out-group. The dataset was aligned by ClustalX program (Thompson et al. Citation1997) to make equal length and common start position. The best model for the dataset was assessed by using Mr. MODELTEST version 2 (Nylander Citation2004) with lowest Bayesian Information Criterion (BIC) score. The Bayesian (BA) tree was constructed in Mr. Bayes version 3.1.2 (Ronquist and Huelsenbeck Citation2003) by selecting nst = 6 for GTR + G+I model and four (one cold and three hot) metropolis-coupled Markov Chain Monte Carlo (MCMC), was run for 1,000,000 generations with 25% burn in with trees saving at every 100 generations. The MCMC analysis was used to generate the convergence metrics, till the standard deviation (SD) of split frequencies reached under 0.01 and the potential scale reduction factor (PSRF) for all parameters approached 1.0. To represent the generated BA phylogeny, the web-based iTOL tool (https://itol.embl.de/) was used (Letunic and Bork 2017). The mean genetic divergences were calculated using Kimura 2 parameter (K2P) by MEGAX (Kumar et al. Citation2018). The number of haplotypes of N. indica was estimated by using DnaSP version 4.10.9 (Librado and Rozas Citation2009) and the identical sequences were considered as the same haplotype. Haplotype diversity (Hd) and nucleotide diversity (π) for different population of N. indica were calculated through DnaSP version 4.10.9 . The TCS networks of all haplotypes were drawn in POP-ART (Clement et al. Citation2002; Leigh and Bryant Citation2015).
3. Results and discussion
Panoptic survey and exploration is the most crucial part in taxonomic study and biodiversity research. In general, taxonomists described new species based on the morphological characters of a type specimen. However, the type specimen bears not only all necessary systematics information, but also helps in furnishing the genetic information. In recent years, with the advancement of molecular biology tools, the species inventory is rising rapidly throughout the globe, including India (Lakra et al. Citation2016; Laskar et al. Citation2018). However, these additional techniques have often flunked to test many biological questions, due to lack of collateral information and unscientific preservation (Ebach and Holdrege Citation2005). Moreover, the examples of specimen in type series are not fixed and varied in different organisms with unlike opinions. Hence, the re-evaluation of specimens from type series often posed disputes to deal with molecular data (Collins and Cruickshank Citation2013). As a result, the combined assessment of any species is largely sporadic which obstructed population estimation and other evolutionary studies. The population genetics helps to detect the behaviour and formulate the precise conservation strategies of both aquatic and terrestrial animals in their natal place (Greenwood Citation1980). Further, several organism shows returning affinity to its natal place for reproduction and these philopatric behaviour has been largely evidenced in both aquatic and terrestrial animals through multigenerational pedigrees (Clutton-Brock et al. Citation2010; Salles et al. Citation2016). However, in evolutionary point of view the origin of philopatry is severally argued (Sheldon Citation1994; Kawecki and Ebert Citation2004). The natal philopatry allows the genetic adaptability within the original population and avoids the dispersal events. Nevertheless, this physiological behaviour increase the inbreeding (Shields Citation1982), reduce genetic diversity (Charlesworth and Charlesworth Citation1999) and poses extinction risk for any small populations (Keller and Waller Citation2002). Hence, realizing both dispersal and philopatry is vital for any organism to recognize their genetic diversity (Amos and Harwood Citation1998) and conservation (MacDonald and Johnson Citation2001). As of now several studies has been aimed to discuss the female precise natal philopatry of different organisms; turtles (Lee et al. Citation2006), bats (Arnold and Wilkinson Citation2015), Macaw (Caparroz et al. Citation2009), sea lion (Oliveira et al. Citation2017), black-tailed deer (Bose et al. 2007), and orangutans (van Noordwijk et al. Citation2012) based on microsatellite data and mitochondrial genes (control region and cytochrome b). Hence, this study deals with the most effective mitochondrial COI markers for species identification and test the efficacy for population discrimination.
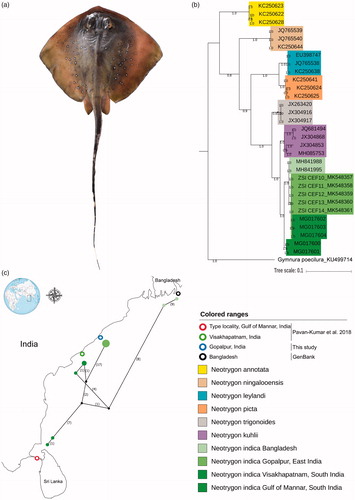
The studied specimens were identified as N. indica based on their morphological characters, variations in ocellated blue spots, dark speckles, and noticeable occipital mark (). The species were described from Gulf of Mannar, Tamil Nadu state in southern India and later on described from Tuticorin (Tamil Nadu), Visakhapatnam (Andhra Pradesh), and Bangladesh. Hence, this study further elucidates the distribution of N. indica from Gopalpur, Odisha. Accordingly, the record of this marine species is a new addition to the state fauna of Odisha. Besides morphological data, the study also adopted DNA barcoding tool to identify and genetic distinctiveness of N. indica from their same and other congeners. The generated 663 bp of mtCOI fragment showed 99.85% similarity with the published sequence of N. indica (MG017603) in GenBank database. Hence, the similarity search approach is inconclusive due to the ambiguous matching with two species. To test the genetic boundaries and monophyletic clustering criteria; both generated and published database sequences were examined. All the species showed monophyletic clustering with BA phylogeny (). The BA phylogeny depicted, N. kuhlii as the sister taxon of N. indica. The overall mean genetic distance of the studied dataset was 3.9%. The mean intra-species genetic distance of seven Neotrygon species was 0–1.3%; however, the mean inter-species genetic distances was 1.5–8.1%. N. indica showed 2.2–8.0% genetic distances with other six species (N. kuhlii, N. trigonoides, N. picta, N. leylandi, N. ningalooensis, and N. annotata). Further, the TCS network was tested to discriminate the genetic distinctiveness of the studied species from the same species from other known distribution areas (). The number of nucleotide diversity within the N. indica (studied and other database sequences) was n = 0.02566, number of segregation sites were 45, and number of parsimony informative sites were 36. The intra-population genetic distance was negligible (0%). Further, the mean inter-population genetic distance was 0.02–1.6% between the type locality (Gulf of Mannar, India), India (Visakhapatnam, Gopalpur), and Bangladesh. The Gopalpur population of N. indica showed 0.2–1.5% genetic distances with other known population in the studied dataset. Hence, the resulted shallow genetic divergences within different population revealed possible recent isolation or restricted gene flow of N. indica in Bay of Bengal. To corroborate this philopatric trends, this study suggested considerable sampling effort and generation of other microsatellite data and mitochondrial control region for an in-depth investigation of the phylogeographic structure.
Figure 1. (a) N. indica specimen collected from the Gopalpur, Odisha. (b) Bayesian phylogeny indicated the monophyletic clustering of seven congeners of Neotrygon. (c) TCS network showed the different haplotypes of N. indica in Bay of Bengal denoted by green colour shed corresponding to the distinct clustering in the phylogenetic tree.
In conservation perspective, the plain maskray (N. annotata) is Near Threatened, and two other species, speckled maskray (N. picta), and painted maskray (N. leylandi) are Least Concern in IUCN database. Further, the status of Ningaloo maskray, N. ningalooensis and Andkuhl’s maskray, N. kuhlii are Data Deficient in IUCN Red List (IUCN Citation2018). Hence, it is the prior importance to evaluate the population status of three maskray species including N. indica in Indian marine water and other known range distribution. Nevertheless, the inspection of population structure and their evolution is one of the major challenges in evolutionary studies and formulate the precise conservation policies (Stepien et al. Citation2009). Moreover, due to several geological factors and climatic change, the marine biodiversity is weakening the ocean ecosystem (Stiebens et al. Citation2013). Hence, without genetic mutation the organisms are incapable to sustain in the transformed environments. Therefore, to protect such oceanic fauna this study recommends appraising of population structure of maskray in detail before adopting any conservation plans.
Acknowledgements
The authors are thankful to the Director, Zoological Survey of India (ZSI), Ministry of Environment, Forests and Climate Change (MoEF&CC), Govt. of India for providing necessary facilities, constant support, and encouragement throughout the study. We acknowledge the MoEF&CC, ZSI in-house core funding to all authors. The funders had no role in study design, data collection and analysis or preparation of the manuscript.
Disclosure statement
No potential conflict of interest was reported by the authors.
Additional information
Funding
References
- Amos W, Harwood J. 1998. Factors affecting levels of genetic diversity in natural populations. Philos Trans R Soc Lond B Biol Sci. 353:177–186.
- Arlyza IS, Shen KN, Durand JD, Borsa P. 2013. Mitochondrial haplotypes indicate parapatric-like phylogeographic structure in blue-spotted maskray (Neotrygon kuhlii) from the Coral Triangle region. J Hered. 104:725–733.
- Arnold BD, Wilkinson GS. 2015. Female natal philopatry and gene flow between divergent clades of pallid bats (Antrozous pallidus). J Mammal. 96:531–540.
- Borsa P, Arlyza IS, Hoareau TB, Shen KN. 2018. Diagnostic description and geographic distribution of four new cryptic species of the blue-spotted maskray species complex (Myliobatoidei: Dasyatidae; Neotrygon spp.) based on DNA sequences. J Oceanol Limnol. 36:827–841.
- Borsa P, Shen KN, Arlyza IS, Hoareau TB. 2016. Multiple cryptic species in the blue-spotted maskray (Myliobatoidei: Dasyatidae: Neotrygon spp.): an update. C R Biol. 339:417–426.
- Bose S, Forrester TD, Brazeal JL, Sacks BN, Casady DS, Wittmer HU. 2017. Implications of fidelity and philopatry for the population structure of female black-tailed deer. Behav Ecol. 28:983–990.
- Burridge CP, Craw D, Jack DC, King TM, Waters JM. 2008. Does fish ecology predict dispersal across a river drainage divide? Evolution. 62:1484–1499.
- Caparroz R, Miyaki CY, Baker AJ. 2009. Contrasting phylogeographic patterns in mitochondrial DNA and microsatellites: evidence of female philopatry and male-biased gene flow among regional populations of the blue-and-yellow macaw (Psittaciformes: Ara ararauna) in Brazil. Auk. 126:359–370.
- Cerutti-Pereyra F, Meekan MG, Wei NWV, O’Shea O, Bradshaw CJA, Austin CM. 2012. Identification of rays through DNA barcoding: an application for ecologists. PLoS One. 7:e36479.
- Charlesworth B, Charlesworth D. 1999. The genetic basis of inbreeding depression. Genet Res. 74:329–340.
- Clement M, Snell Q, Walke P, Posada D, Crandall K. 2002. TCS: estimating gene genealogies. Proceedings 16th International Parallel and Distributed Processing Symposium; Vol. 2; Piscataway (NJ): IEEE; p. 184.
- Clutton-Brock T, Sheldon BC. 2010. Individuals and populations: the role of longterm, individual-based studies of animals in ecology and evolutionary biology. Trends Ecol Evol. 25:562–573.
- Collins RA, Cruickshank RH. 2013. The seven deadly sins of DNA barcoding. Mol Ecol Resour. 13:969–975.
- Côté SD, Dallas JF, Marshall F, Irvine RJ, Langvatn R, Albon SD. 2002. Microsatellite DNA evidence for genetic drift and philopatry in Svalbard reindeer. Mol Ecol. 11:1923–1930.
- Dannewitz J, Maes GE, Johansson L, Wickstrom H, Volckaert FAM, Jarvi T. 2005. Panmixia in the European eel: a matter of time. Proc Biol Sci. 272:1129–1137.
- Ebach MC, Holdrege C. 2005. DNA barcoding is no substitute for taxonomy. Nature. 434:697.
- FitzSimmons NN, Limpus CJ, Norman JA, Goldizen AR, Miller JD, Moritz C. 1997. Philopatry of male marine turtles inferred from mitochondrial DNA markers. Proc Natl Acad Sci USA. 94:8912–8917.
- Fricke R. 2019. Eschmeyer’s catalog of fishes: references. [accessed 12.03.2019] http://researcharchive.calacademy.org/research/ichthyology/catalog/fishcatmain.asp. Electronic version accessed 12.03.2019.
- Gour DS, Bhagavatula J, Bhavanishankar M, Reddy PA, Gupta JA, Sarkar MS, Hussain SM, Harika S, Gulia R, Shivaji S, et al. 2013. Philopatry and dispersal patterns in tiger (Panthera tigris). PLoS One. 8:e66956.
- Greenwood P. 1980. Mating systems, philopatry and dispersal in birds and mammals. Anim Behav. 28:1140–1162.
- Hebert PD, Cywinska A, Ball SL, deWaard JR. 2003. Biological identifications through DNA barcodes. Philos Trans Royal Soc B. 270:313–322.
- Hubert N, Hanner R, Holm E, Mandrak NE, Taylor E, Burridge M, Watkinson D, Dumont P, Curry A, Bentzen P, et al. 2008. Identifying Canadian freshwater fishes through DNA barcodes. PLoS One. 3:e2490.
- Hueter RE, Heupel MR, Heist EJ, Keeney DB. 2004. Evidence of philopatry in sharks and implications for the management of shark fisheries. J Northw Atl Fish Sci. 35:239–247.
- IUCN. 2018. The IUCN red list of threatened species. Version 2019.1. Gland (Switzerland): IUCN.
- Kawecki TJ, Ebert D. 2004. Conceptual issues in local adaptation. Ecol Lett. 7:1225–1241.
- Keller LF, Waller DM. 2002. Inbreeding effects in wild populations. Trends Ecol Evol. 17:230–241.
- Kumar S, Stecher G, Li M, Knyaz C, Tamura K. 2018. MEGAX: molecular evolutionary genetics analysis across computing platforms. Mol Biol Evol. 35:1547–1549.
- Lakra WS, Singh M, Goswami M, Gopalakrishnan A, Lal KK, Mohindra V, Sarkar UK, Punia PP, Singh KV, Bhatt JP, et al. 2016. DNA barcoding Indian freshwater fishes. Mitochondrial DNA Part A. 27:4510–4517.
- Laskar BA, Kumar V, Kundu S, Tyagi K, Chandra K. 2018. Taxonomic quest: validating two mahseer fishes (Actinopteri: Cyprinidae) through molecular and morphological data from biodiversity hotspots in India. Hydrobiologia. 815:113–124.
- Last PR, White WT, Seret B. 2016. Taxonomic status of maskrays of the Neotrygon kuhlii species complex (Myliobatoidei: Dasyatidae) with the description of three new species from the Indo-West Pacific. Zootaxa. 4083:533–561.
- Last PR, White WT. 2008. Resurrection of the genus Neotrygon Castelnau (Myliobatoidei: Dasyatidae) with the description of Neotrygon picta sp. nov., a new species from northern Australia, In: Last PR, White WT, Pogonoski JJ, editors. Descriptions of new Australian chondrichthyans. Hobart Australia: CSIRO; p. 315–325.
- Lee PLM, Luschi P, Hays GC. 2006. Detecting female precise natal philopatry in green turtles using assignment methods. Mol Ecol. 16:61–74.
- Leigh JW, Bryant D. 2015. PopART: full-feature software for haplotype network construction. Methods. Ecol Evol. 6:1110–1116.
- Letunic I, Bork P. 2007. Interactive tree of life (iTOL): an online tool for phylogenetic tree display and annotation. Bioinformatics. 23:127–128.
- Librado P, Rozas J. 2009. DnaSP v5: a software for comprehensive analysis of DNA polymorphism data. Bioinformatics. 25:1451–1452.
- Lim KC, Lim PE, Chong VC, Loh KH. 2015. Molecular and morphological analyses reveal phylogenetic relationships of stingrays focusing on the family Dasyatidae (Myliobatiformes). PLoS One. 10:e0120518.
- Macdonald DW, Johnson DDP. 2001. Dispersal in theory and practice: consequences for conservation biology. In: Clobert J, Danchin E, Dhondt AA, Nichols JD, editors. Dispersal. New York: Oxford University Press; p. 358–372.
- Mayr E. 1963. Animal species and evolution. Cambridge (MA): Belknap Press of Harvard University Press.
- Moura AE, Natoli A, Rogan E, Hoelzel AR. 2013. Atypical panmixia in a European dolphin species (Delphinus delphis); implications for the evolution of diversity across oceanic boundaries. J Evol Biol. 26:63–75.
- Nylander JAA. 2004. MrModeltest v2. Program distributed by the author. Uppsala (Sweden): Evolutionary Biology Centre, Uppsala University.
- Oliveira LRD, Gehara MCM, Fraga LD, Lopes F, Túnez JI, Cassini MH, Majluf P, Cárdenas-Alayza S, Pavés HJ, Crespo EA, et al. 2017. Ancient female philopatry, asymmetric male gene flow, and synchronous population expansion support the influence of climatic oscillations on the evolution of South American sea lion (Otaria flavescens). PLoS One. 12:e0179442.
- Pavan-Kumar A, Kumar R, Pitale P, Shen K, Borsa P. 2018. Neotrygon indica sp. nov., the Indian Ocean blue-spotted maskray (Myliobatoidei, Dasyatidae). C R Biol. 341:120–130.
- Puckridge M, Last PR, White WT, Andreakis N. 2013. Phylogeography of the Indo-West Pacific maskrays (Dasyatidae, Neotrygon): a complex example of Chondrichthyan radiation in the Cenozoic. Ecol Evol. 3:217–232.
- Purdue JR, Smith MH, Patton JC. 2000. Female philopatry and extreme spatial genetic heterogeneity in white-tailed deer. J Mammal. 81:179–185.
- Ronquist F, Huelsenbeck JP. 2003. MrBayes 3: bayesian phylogenetic inference under mixed models. Bioinformatics. 19:1572–1574.
- Salles OC, Pujol B, Maynard JA, Almany GR, Berumen ML, Jones GP, Saenz-Agudelo P, Srinivasan M, Thorrold SR, Planes S. 2016. First genealogy for a wild marine fish population reveals multigenerational philopatry. Proc Natl Acad Sci USA. 113:13245–13250.
- Sheldon BC. 1994. Male phenotype, fertility, and the pursuit of extra-pair copulations by female birds. Proc R Soc Lond B. 257:25–30.
- Shields WM. 1982. Philopatry, inbreeding, and the evolution of sex. Albany (NY): State University of New York Press.
- Stepien CA, Murphy DJ, Lohner RN, Sepulveda-Villet OJ, Haponski AE. 2009. Signatures of vicariance, postglacial dispersal and spawning philopatry: population genetics of the walleye Sander vitreus. Mol Ecol. 18:3411–3428.
- Stiebens VA, Merino SE, Roder C, Chain FJJ, Lee PLM, Eizaguirre C. 2013. Living on the edge: how philopatry maintains adaptive potential. Proc R Soc Lond B Biol Sci. 280:20130305.
- Thompson JD, Gibson TJ, Plewniak F, Jeanmougin F, Higgins DG. 1997. The CLUSTAL_X windows interface: flexible strategies for multiple sequence alignment aided by quality analysis tools. Nucleic Acids Res. 25:4876–4882.
- van Noordwijk MA, Arora N, Willems EP, Dunkel LP, Amda RN, Mardianah N, Ackermann C, Krützen M, van Schaik CP. 2012. Female philopatry and its social benefits among Bornean orangutans. Behav Ecol Sociobiol. 66:823–834.
- Ward RD, Hanner R, Hebert PD. 2009. The campaign to DNA barcode all fishes, FISH-BOL. J Fish Biol. 74:329–356.
- Ward RD, Zemlak TS, Innes BH, Last PR, Hebert PD. 2005. DNA barcoding Australia’s fish species. Philos Trans R Soc Lond B Biol Sci. 360:1847–1857.