
Abstract
Urechis unicinctus is the only Echiurini species distributed in Bohai Gulf of China. The wild populations of this species have sharply declined in China due to overfishing. Over 150 samples from Bohai Gulf were collected in the present study, which were classified into five populations according to their geographic areas and body colors. The genetic diversity and population structure of these populations were investigated by mitochondiral COI and D-loop sequences. The haplotype diversity of U. unicinctus based on COI and D-loop sequences were still high. In addition, the evolution rate of D-loop region could faster than the COI gene of U. unicinctus. Meanwhile, over 99% genetic diversity was contributed by different individuals within populations. Moreover, phylogenetic trees did not show clear geographic or color cluster. Our findings indicated that this species in Bohai Gulf of China should be treated as a whole population.
Introduction
Echiura worm Urechis unicinctus is a benthic invertebrate mainly distributed along the coast of Russian, Japan, Korea, and the Bohai Gulf of China (Zheng et al. Citation2006). It taxonomically belongs to Echiurini in the family Thalassematidae, which is the only Echiurini species found in China (Goto et al. Citation2020). Due to its delicious taste and high nutritional value, the demand for U. unicinctus as food is rapid growing (Wang et al. Citation2007). However, most of the U. unicinctus in the market are still from the wild environment because the aquaculture industry of this species has only just begun (Xu et al. Citation2016). The overfishing of U. unicinctus led to the rapid reduction of its wild resources (Liu et al. Citation2017). The genetic diversity of a population is an important indicator to assess the environmental adaptability of individuals within the population (Markert et al. Citation2010). Therefore, understanding the genetic diversity of wild U. unicinctus is critical to the rational development and management of this species.
Mitochondrial DNA (mtDNA) is a genetic material that exists in the cytoplasm of eukaryotes and is significantly different from the nuclear DNA in structure and function (Skurikhina et al. Citation2013). mtDNA has a simple and stable structure as well as small molecular weight (Billington and Hebert Citation1991). It is very convenient for the research of population genetics due to the characteristics of strict maternal inheritance, high uniformity in different tissues, and fast evolution rate (Cui et al. Citation2010). Cytochrome c oxidase I (COI) is a marker mtDNA gene often used to study the genetic diversity and population structure of marine species (Francisco and Galetti Citation2005; Derycke et al. Citation2010; Rodrigues et al. Citation2015), which possesses a higher polymorphism than other mtDNA genes (Katsares et al. Citation2008). Moreover, the displacement loop (D-loop), a noncoding sequence in mtDNA, is the region with the greatest variation in the sequence and length of mtDNA (Brown et al. Citation1986). Its sequence variations include not only substitutions between nucleotides, but also deletions, insertions, and tandem repeats (Wilkinson and Chapman Citation1991). Through the analysis of the COI gene and D-loop region, variations in the coding and non-coding regions of the mtDNA can be obtained simultaneously.
At present, there have been few studies on the genetic diversity of U. unicinctus populations. The genetic diversity of three U. unicinctus populations in Laizhou Bay has been analyzed based on the COI gene (Fu et al. Citation2019). In addition, the genetic diversity and population structure with mitochondrial COI, 16S rRNA and nuclear 28S rRNA genes have been investigated in the U. unicinctus from six localities of Bohai Gulf and Korea coast (Gong et al. Citation2018). Moreover, microsatellite markers from 5 natural populations in China have been isolated to compare the differences in the population genetic structures (Chang et al. Citation2017). However, all these previous studies have measured the genetic diversity of U. unicinctus in different geographical locations. Relationships between other factors and the genetic diversity of U. unicinctus have been scarcely involved.
In this study, the genetic diversity of five different U. unicinctus populations was investigated using the molecular markers of COI gene and D-loop region in mtDNA. In addition to these five populations from three different geographical areas, they also contained three different body colors. The results of the present study can provide reference for the artificial breeding and germplasm resources protection of U. unicinctus to promote the development of U. unicinctus aquaculture industry in China.
Materials and methods
Sample collection
More than 150 U. unicinctus specimens were collected from three localities in the Bohai Gulf of China (). According to the geographical area and body color, these specimens were classified into five populations (red in Dalian, DR; black in Dalian, DB; purple in Hebei, HP; black in Hebei, HB; and red in Shandong, SR; and ). All individuals were live trapped and identified based on the morphological features. They were transported to the laboratory by the cryogenic living transportation, and then the body wall tissues were stored at −80 °C until DNA extraction.
Figure 1. Locations of five sampling sites of U. unicinctus. (Dalian black, DB, 121°36′59.71″E, 39°09′59.15″N; Dalian red, DR, 121°28′32.60″E, 39°43′22.83″N; Hebei purple, HP, 119°12′08.52″E, 39°20′41.66″N; Hebei black, HB, 119°07′56.54″E, 39°16′45.39″N; Shandong red, SR, 121°48′40.20″E, 37°27′45.26″N).
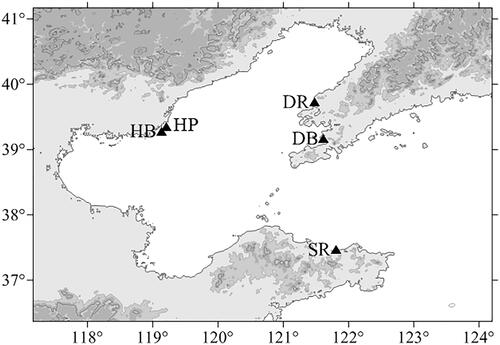
Figure 2. Photographs of Urechis unichinctus with different body colors. (a) Purple, (b) black, and (c) red.
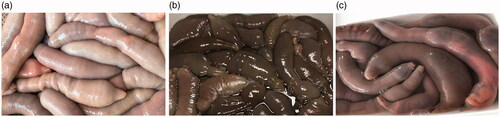
Table 1. The numbers and average weights of U. unicinctus among different geographies and body colors.
DNA extraction
Genomic DNA was isolated from the body wall using TaKaRa MiniBEST Universal Genomic DNA Extraction Kit (TaKaRa, Dalian, China) according to the manufacturer's instruction. Agarose gel electrophoresis with 1% concentration was used to detect whether DNA was successfully extracted, and then the concentration and purity of each successfully extracted DNA were measured by NanoPhotometer® Classic Launched (IMPLEN, GER). All DNA samples were stored at −20 °C for further application.
PCR amplification and sequencing
The COI gene and D-loop region were amplified by PCR using the specific primers (). All PCR reactions were carried out in an ABI2720 Thermal Cycler (Applied Biosystems, USA) with a 20 µL reaction including 10 µL of 2 × Taq Master Mix (Taraka, Dalian, China), 0.5 µL of each primer, and about 50 ng template DNA. The thermal cycling for PCR amplifications is also listed in . There was a negative control in each round of PCR to check the contamination, and all negative controls had no products. The PCR products of each sample were detected by electrophoresis on a 1.5% agarose gel. The bright main strip was purified and recovered using the QIAquick Gel Extraction Kit (Qiagen, GER). The purified PCR products were sequenced with an ABI 3730 XL automatic sequencer (Perkin-Elmer, Waltham, MA, USA).
Table 2. The primer information and thermal cycling for COI gene and D-loop region.
Data analysis
A total of 160 COI (417 bp) and 155 D-loop (163 bp) sequences were obtained respectively in the present study. All sequences were deposited in GenBank with accession numbers MT346032-MT346374. All sequences were aligned and manually corrected using the software ClustalX v1.83 (Thompson et al. Citation1997) under the default setting. The number of haplotypes (h), number of polymorphic sites (S), haplotype diversity (Hd), and nucleotide diversity (Pi) were calculated using DnaSP v6.12 (Librado and Rozas Citation2009). Meanwhile, the Fu's Fs statistics (Fu, Citation1997) and Tajima's D test (Tajima Citation1989) were also performed by DnaSP v6.12 to test the neutrality of U. unicinctus. Analysis of molecular variance (AMOVA) and the fixation index (FST) were conducted to estimate the genetic differentiation among different populations by Arlequin v3.5.2.2 software (Excoffier et al. Citation2005). The Kimura 2-parameter distances within and among populations were calculated using MEGA v7.0 (Kumar et al. Citation2016). Phylogenetic trees based on the haplotypes of COI and D-loop sequences were constructed using the maximum likelihood method by MEGA v7.0 with an appropriate substitution model of sequence chosen by Modeltest v3.7 (Posada and Crandall Citation1998). The robustness of the phylogenetic results was tested by bootstrap analysis with 1000 replicates.
Results
Genetic diversity of U. unicinctus
For COI gene, 93 polymorphic sites and 83 haplotypes were detected (). Among these haplotypes, 63 haplotypes were only presented in a single sample (account for 75.9%). H6 was the most popular haplotype which existed in 17 samples from five populations. The Hd and Pi of total samples based on COI gene were 0.970 and 0.012, respectively. For different populations, Hd ranged from 0.954 (DR) to 0.973 (SR), and Pi ranged from 0.010 (SR) to 0.013 (DB and HB) ().
Table 3. Genetic diversity parameters for five populations of U. unicinctus based on COI/D-loop sequences.
For D-loop region, 58 polymorphic sites and 52 haplotypes were identified (). Among 52 these haplotypes, 38 haplotypes were only detected in a single sample (account for 73.1%). H3 was the most popular haplotype which existed in 67 individuals from five populations. Based on D-loop sequences, the Hd and Pi of total samples were 0.824 and 0.016, respectively. For different populations, Hd ranged from 0.768 (DR) to 0.894 (HB), and Pi ranged from 0.012 (DR) to 0.019 (HP) ().
Population genetic structure of U. unicinctus
The genetic distances of U. unicinctus populations were calculated based on COI and D-loop sequences (). The pairwise genetic distances ranged from 0.0111 to 0.0134 for COI gene, and 0.0141 to 0.0187 for D-loop region. The genetic distances within populations were similar to those among populations, which were 0.0100–0.0138 and 0.0128–0.0207 for COI and D-loop sequences, respectively. AMOVA analysis indicated that 99.36% and 99.96% of the total genetic variances based on the COI and D-loop sequences attributed to the variations within populations ( and ). The fixation index FST values among five U. unicinctus populations based on the COI and D-loop sequences were 0.0635 and 0.00044, respectively, both of which were not significant. Moreover, the maximum likelihood trees of haplotypes based on COI and D-loop sequences were established, respectively (). Both of the trees did not show obvious clusters corresponding to sampling localities and body colors.
Figure 3. Maximum likelihood tree constructed based on 83 COI haplotypes (a) and 52 D-loop haplotypes of U. unicinctus. Numbers on the branches are bootstrap values for maximum likelihood.
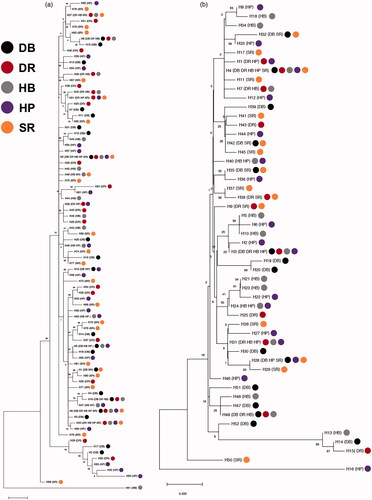
Table 4. Pairwise Kimura 2-parameter distance between different populations based on COI (above diagonal) and D-loop (below diagonal) sequences.
Table 5. Molecular variance (AMOVA) analysis among five of U. unicinctus based on COI sequences.
Table 6. Molecular variance (AMOVA) analysis among five of U. unicinctus based on D-loop sequences.
Historic demography of U. unicinctus
The Tajima's D and Fu's Fs tests were performed based on COI and D-loop sequences to detect the population expansion of U. unicinctus. For all samples, both of COI and D-loop neutrality test showed significantly negative Tajima's D values (−2.336 and −2.447, respectively). Meanwhile, significant Tajima's D values were observed in DR, HB, and SR based on COI, and DB, DR, HP, and SR based on D-loop, respectively (). In Fu's Fs tests, significantly negative values were detected in DR, HB, and SR based on COI, and DB, DR, and HP based on D-loop, respectively. Moreover, a very large significant negative Fu's Fs index was presented for both COI (-33.479) and D-loop (-61.319) sequences when all samples were pooled together ().
Discussion
Genetic diversity and population structure of U. unicinctus
COI gene has been proved to display greater base substitution frequency than other mtDNA genes, so it has been used as a suitable marker for population genetic studies in diverse animals (Du et al. Citation2009; Khamnamtong et al. Citation2009). The Hd and Pi values detected in the present study were similar to the previous results of U. unicinctus from seven and three different geographic populations in Bohai Gulf and Laizhou Bay, respectively (Gong et al. Citation2018; Fu et al. Citation2019). The Hd and Pi values in U. unicinctus were higher than those of many reported marine invertebrates (Schulze Citation2006; Li et al. Citation2016). In contrast, the genetic diversity of D-loop region in U. unicinctus was investigated for the first time in this study. The Hd and Pi values of U. unicincuts were also higher than those of other marine soft-bodied organisms, such as Asian Green Mussel Pernaviridis (Lau et al. Citation2018) and cuttlefish Sepiella japonica (Xia et al. Citation2016). These results indicated that the genetic diversity of COI and D-loop sequences in U. unicinctus was still high. Moreover, both higher nucleotide diversity and pairwise genetic distance were observed in the D-loop region compared to the COI gene from the U. unicinctus populations detected in the present study (). The COI gene and D-loop region were representative sequences of the coding and noncoding regions in the mtDNA, respectively. The finding of the present study suggested that the evolution rate of non-coding sequence could faster than the coding region in the mtDNA of U. unicinctus.
FST value is an effective index to assess the differentiation among populations (Wright Citation1972). In the present study, the FST values based on both of COI and D-loop sequences among five U. unicinctus populations were small and not significant. This result indicated that the genetic differentiation among U. unicinctus populations with different geographic areas and body colors were relatively low. Meantimes, the pairwise genetic distances between different populations were all below 0.1, which suggested a pattern of homogeneity among U. unicinctus populations (Billington and Hebert Citation1991). Moreover, the consistent results of AMOVA and phylogenetic trees showed no obvious geographic and body color differences in the U. unicinctus populations. All results above informed that the populations of U. unicinctus with different geographical areas and body colors might comprise a panmictic population. Consistent results were also found in previous studies of U. unicinctus in different geographic locations of China (Gong et al. Citation2018; Fu et al. Citation2019).
Demographic dynamics of U. unicinctus
Neutrality tests, such as Tajima's D and Fu's Fs tests, were used to examine recent population expansion when the null hypothesis was rejected (Zhang et al. Citation2017). Negative and significant neutrality test value indicates that the sequence contains more nucleotide changes than the neutral evolution model, which may suggest a population expansion event in history (Zhang et al. Citation2017). Both of the Tajima's D and Fu's Fs values based on the COI and D-loop sequences in all detected U. unicincuts were significantly negative. These results indicated that population expansion event could have occurred in the history of U. unicincuts evolution. In addition, the negative values of neutrality tests also suggested the purifying selection of population. For different populations of U. unicinctus, the significances of Tajima's D and Fu's Fs tests were consistent. However, the results of these tests based on COI and D-loop sequences were different in DB, HB, and HP populations (). These results implied that the factors of geographical area and body color might lead to the differences in the evolution of COI and D-loop sequences of U. unicinctus. It is a pity that we cannot estimate the expansion time and the detail evolution differences of U. unicinctus, and these topics should be further studied.
Conclusions
The haplotype diversity of U. unicinctus is still high based on COI and D-loop sequences, in which COI gene represented more haplotype diversity. Moreover, there was no obvious genetic differentiation between different geographic localities and body colors. Our investigations have directive significance for management and resource conservation of this commercial marine species. High genetic diversity can facilitate the selection of germplasm in breeding activities and the development of targeted breeding technologies to improve the nutritional and economic benefits of U. unicinctus. Further study based on more molecular markers and samples is needed to extend the present understanding.
Authors’ contributions
Conceptualization, Tong Liu and Wenbo Chen; supervision, Tong Liu and Wenbo Chen; methodology, Hongxin Shang, Tingting Yang, and Lu Wang; formal analysis, Saisai Zhang, Yang Sun and Lin Ma; investigation, Ying Chen and Bin Zhang; writing–original draft preparation, Saisai Zhang and Mo Li.
Compliance with ethical standards
This article does not contain any studies with human subjects by any of the authors. The animal experiment throughout the study was conducted according to the Chinese Ministry of Science and Technology Guiding Directives for Humane Treatment of Laboratory Animals.
Disclosure statement
All the authors have declared that no competing interests exist and approved it for publication.
Data availability statement
The data that support the findings of this study are available in GenBank at https://www.ncbi.nlm.nih.gov/nuccore/, reference numbers MT346032-MT346374.
Additional information
Funding
References
- Billington N, Hebert PDN. 1991. Mitochondria DNA diversity in fishes and its implications for introductions. Can J Fish Aquat Sci. 48(S1):80–94.
- Brown GG, Gadaleta G, Pepe G, Saccone C, Sbisà E. 1986. Structural conservation and variation in the D-loop-containing region of vertebrate mitochondrial DNA. J Mol Biol. 192(3):503–511.
- Chang C, Han HZ, Wang TT, Ma HT, Liu Y, Wang F, Zhang ML, Wang LY, Jiang HB. 2017. Microsatellite marker isolation and genetic structure analysis for five populations of Urechis unicinctus. Oceanologia ET Limnologia Sinica. 48(3):498–507. (In Chinese)
- Cui Z, Liu Y, Chu KH. 2010. Broader pattern of tandem repeats in the mitochondrial control region of Perciformes. Chin J Ocean Limnol. 28(4):785–794.
- Derycke S, Vanaverbeke J, Rigaux A, Backeljau T, Moens T. 2010. Exploring the use of cytochrome oxidase c subunit 1 (COI) for DNA barcoding of free-living marine nematodes. PLoS One. 5(10):e13716.
- Du X, Chen Z, Deng Y, Wang Q. 2009. Comparative analysis of genetic diversity and population structure of Sipunculus nudus as revealed by mitochondrial COI sequences. Biochem Genet. 47(11–12):884–891.
- Excoffier L, Laval G, Schneider S. 2005. Arlequin (version 3.0): an integrated software package for population genetics data analysis. Evol Bioinform. 1:47–50.
- Francisco AKD, Galetti PM. 2005. Genetic distance between broodstocks of the marine shrimp Litopenaeus vannamei (Decapoda, Penaeidae) by mtDNA analyses. Genet Mol Biol. 28(2):258–261.
- Fu Y-X. 1997. Statistical tests of neutrality of mutations against population growth, hitchhiking and background selection. Genetics. 147(2):915–925. doi:https://doi.org/10.1093/genetics/147.2.915.
- Fu XH, Liu GN, Sun FX, Xin L, Chen QQ. 2019. Analysis of the genetic diversity of Urechis unicinctus in Laizhou Bay based on the mitochondrial COI gene sequence. Marine Science. 43(22):56–61. (In Chinese)
- Gong J, Zhao R, Deng J, Zhao Y, Zuo J, Huang L, Jing M. 2018. Genetic diversity and population structure of penis fish (Urechis unicinctus) based on mitochondrial and nuclear gene markers. Mitochondrial DNA A DNA Mapp Seq Anal. 29(8):1261–1268.
- Goto R, Monnington J, Sciberras M, Hirabayashi I, Rouse GW. 2020. Phylogeny of Echiura updated, with a revised taxonomy to reflect their placement in Annelida as sister group to Capitellidae. Invert Systematics. 34(1):101–111.
- Katsares V, Tsiora A, Galinou-Mitsoudi S, Imsiridou A. 2008. Genetic structure of the endangered species Pinna nobilis (Mollusca: Bivalvia) inferred from mtDNA sequences. Biologia. 63(3):412–417.
- Khamnamtong B, Klinbunga S, Menasveta P. 2009. Genetic diversity and geographic differentiation of the giant tiger shrimp (Penaeus monodon) in Thailand analyzed by mitochondrial COI sequences. Biochem Genet. 47(1–2):42–55.
- Kumar S, Stecher G, Tamura K. 2016. MEGA7: molecular evolutionary genetics analysis version 7.0 for bigger datasets. Mol Biol Evol. 33(7):1870–1874.
- Lau JS, Ransangan J, Rodrigues KF. 2018. Genetic diversity and population structure of the Asian green mussel (Pernaviridis) in the waters of Sabah, Malaysia based on mitochondrial DNA D-loop sequences. Turk J Fish Aquat Sc. 18(1):109–117.
- Li Y, Wang B, Wang W, Dong J. 2016. Genetic diversity analysis of Jellyfish rhopilema esculentumin Liaodong Bay based on the COI sequence. Fish Sci. 35:404–409. (In Chinese)
- Librado P, Rozas J. 2009. DnaSP v5: a software for comprehensive analysis of DNA polymorphism data. Bioinformatics. 25(11):1451–1452.
- Liu F, Sun T, Ji Y, Wang L, Yu H. 2017. Advances in studies on the biology and ecology of Urechis unicinctus. Mar Sci. 41(10):125–131. (In Chinese)
- Markert JA, Champlin DM, Gutjahrgobell RE, Grear JS, Kuhn A, Mcgreevy TG, Roth AC, Bagley MJ, Nacci DE. 2010. Population genetic diversity and fitness in multiple environments. BMC Evol Biol. 10:205–13.
- Posada D, Crandall KA. 1998. Modeltest: testing the model of DNA substitution. Bioinformatics. 14:817–818.
- Rodrigues F, Valente S, Gonzalez-Wanguemert M. 2015. Genetic diversity across geographical scales in marine coastal ecosystems: Holothuria arguinensis a model species. J Exp Mar Biol Ecol. 463:158–167.
- Schulze A. 2006. Phylogeny and genetic diversity of Palolo worms (Palola, Eunicidae) from the Tropical North Pacific and the Caribbean. Biol Bull. 210:25–37.
- Skurikhina LA, Kukhlevsky AD, Kovpak NE. 2013. Relationships of osmerid fishes (Osmeridae) of Russia: divergence of nucleotide sequences of mitochondrial and nuclear genes. Genes Genom. 35(4):529–539.
- Tajima F. 1989. Statistical method for testing the neutral mutation hypothesis by DNA polymorphism. Genetics. 123:585–595.
- Thompson JD, Gibson TJ, Plewniak F, Jeanmougin F, Higgins DG. 1997. The Clustal_X windows interface: flexible strategies for multiple sequence alignment aided by quality analysis tools. Nucleic Acids Res. 25:4876–4882.
- Wang D, Liu W, Han B, Xu R. 2007. Biochemical and enzymatic properties of a novel marine fibrinolytic enzyme from Urechis unicinctus. Appl Biochem Biotechnol. 136(3):251–263.
- Wilkinson GS, Chapman AM. 1991. Length and sequence variation in evening bat D-loop mtDNA. Genetics. 128(3):607–617.
- Wright S. 1972. Evolution and the genetics of populations. J Bio Sci. 4:253–256.
- Xia L, Guo B, Ye Y, Li J, Wu C. 2016. Determination of genetic diversity of the cuttlefish Sepiella japonica inhabiting Chinese coastal waters using the mitochondrial D-loop region: the valuable inspiration to artificial releasing project. Biochem Syst Ecol. 69:274–282.
- Xu X, Huo W, Meng X, Chen Y. 2016. The artificial nursing and cultivation techniques of Urechis unicinctus. Ocean and Fishery. 2:53–55. (In Chinese)
- Zhang R, Leng P, Wang X, Zhang Z. 2017. Molecular analysis and genetic diversity of Aedes albopictus (Diptera, Culicidae) from China. Mitochondr DNA A. 13:1–6.
- Zheng Y, Bai H, Wang Y. 2006. Tolerance of Urechis unicinctus juveniles to temperature, salinity and pH value. Fisheries Science. 25(10):513–516. (In Chinese)