
Abstract
Culex tritaeniorhynchus Gile is a major vector of Japanese encephalitis in China. The population genetics study is crucial as it helps understanding the epidemiological aspects of mosquito-brone diseases and improving vector control measures. Here, the genetic population structure of C. tritaeniorhynchus in the mainland China were estimated using the cytochrome c oxidase subunit 1 (COI) DNA barcodes region. 485 individuals of C. tritaeniorhynchus were collected from 38 sampling sites in 21 geographic populations in the mainland China. In total, 485 sequences were used to explore the population structure and genetic diversity. The results showed that the populations of C. tritaeniorhynchus had high haplotype diversity (Hd = 0.98, with 303 haplotypes), low nucleotide diversity (p = 0.02245) and high gene flow (Nm = 47.11) with two maternal lineages and four groups. An AMOVA indicated that 98.8% of the total variation originated from variation within populations. In addition, the population genetic structure exhibited by C. tritaeniorhynchus filling the vacant of the genetic structure in the mainland China. Human activities may also assist mosquito movement and migration. Gene flow among the populations of C. tritaeniorhynchus can facilitate the spread of insecticide resistance genes over geographical areas, and it will be a challenging for controlling the populations.
Introduction
Culex tritaeniorhynchus Gile is the principal vector of Japanese encephalitis (JE). JE is a mosquito-borne zoonosis caused by infection with Japanese encephalitis virus (JEV). JE usually manifests as mild central nervous symptoms, primarily in children and adolescents. In addition, it can also cause sow abortion and equine encephalitis, bringing serious economic losses (Zheng et al. Citation2012; Yun and Lee Citation2014; Mansfield et al. Citation2017). All provinces of China, except Xinjiang and Qinghai, have reported cases of JE (Ren et al. Citation2017). Although the JE vaccine immunization policy has been implemented in China, it is common to fail to complete the immunization program with JE vaccine for children in remote areas, especially in rural areas (Liu et al. Citation2018). Although immunization is considered to be the most important measure to prevent JE, there are still children infected with JE virus after vaccination (Zhang et al. Citation2011), and in recent years, there have been adult JE outbreaks in Shanxi in 2006 and Hebei in 2013 (Longbottom et al. Citation2017). C. tritaeniorhynchus also has the ability to transmit some other human and animal viral diseases (Hayes et al. Citation1980; Sallam et al. Citation2013). In view of the above, China still is facing a growing public health threat.
Vector capacity is controlled by genetic factors that affect the mosquito’s ability to transmit pathogen (Donnelly et al. Citation2002; Gorrochotegui-Escalante et al. Citation2002). Therefore, understanding the dynamics of C. tritaeniorhynchus populations, particularly genetic structure and genetic diversity, is important for the prevention and control of mosquito-borne diseases. The cytochrome c oxidase subunit 1 (COI) DNA barcodes region is considered as a valuable and reliable diagnostic tool for studying the genetic structure and genetic diversity of mosquitoes (Zawani et al. Citation2014; Zouré et al. Citation2020). The population genetics study is important for improving the vector control measures, primarily the genetic control, to prevent or reduce the epidemic impacts. This research aims to investigate the population genetics structure of C. tritaeniorhynchus using the COI DNA barcodes region from 21 geographic populations of China for providing significant information on the population dynamics of a species.
Materials and methods
Taxa sampling
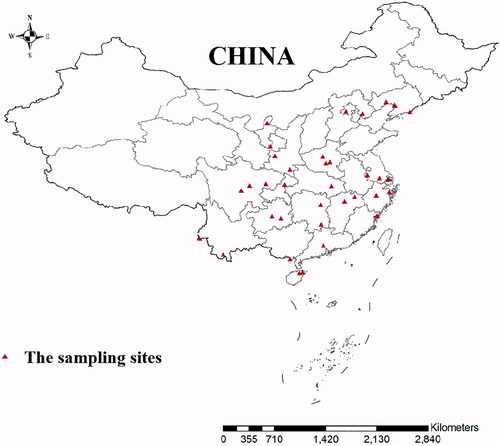
Mosquitoes were collected from the following 38 sampling sites in 21 geographic populations: Liaoning (LN), Zhejiang (ZJ), Shanghai (SH), Jiangsu (JS), Fujian (FJ), Hebei (HB), Jiangxi (JX), Beijing (BJ), Hubei (HUB), Henan (HEN), Guangdong (GZ), Hunan (HUN), Hainan (HAN), Guangxi (GX), Shaanxi (SX), Chongqing (CQ), Guizhou (GZ), Gansu (GS), Ningxia (NX), Sichuan (SC), Yunnan (YN) in the mainland of China, July to September from 2014 to 2020 (). Adult female mosquitoes were captured using light traps and preserved in 95% ethanol and stored at 4 °C. Adults in the traps were collected for morphological identification according to morphological criteria using the key developed (Lu Citation1997). We also uesd 9 specimens of the C. tritaeniorhynchus from Singapore (KF564730.1-KF564732.1) and India (KM350664.1-KM350669.1).
Figure 1. Sampling sites of 21 Culex tritaeniorhynchus geographic populations in the mainland of China.
DNA extraction and polymerase chain reaction amplification
Genomic DNA was extracted from head and thorax with a Micro Tissue Genomic DNA Extraction Kit (BioTeke, Wuxi, China) and a DNA/RNA Extractor-32 system (BioTeke). A 658-bp fragment of COI region was PCR-amplified using the Folmer primers LCO1490 and HCO2198 (Folmer et al. Citation1994). DNA amplification was conducted in 25-μl reactions using 12.5 μl of PCR mix (TsingKe Co. Ltd Beijing, China), 1.0 μl of 10 μM each primer, 1.5 μl of template DNA, and 9 μl of ddH2O. The amplification program consisted of one cycle at 94 °C for 5 min, followed by 35 cycles at 94 °C for 30 s, 55 °C for 30 s, and 72 °C for 1 min, and one cycle at 72 °C for 5 min (Beebe Citation2018). PCR products were electrophoresed on 1.0% agarose gel and then sent for sequencing at TsingKe Co., Ltd. (Beijing, China).
Data analysis
Raw sequences were edited and assembled using SeqMan version 7.1.0 (Swindell and Plasterer Citation1997) and aligned using the Muscle algorithm in MEGA X (Sudhir et al. Citation2018). MEGA X was used to calculate the genetic distance between populations. MEGA X was utilized to select Tamura 3-parameter (T93) model and gamma distributed (G) rates among sites for construction of a maximum likelihood (ML) tree. A neighbor joining (NJ) tree based on Kimura 2-parameter model was also generated using MEGA X. We also used the sequences from GenBank of Culex species inculding C. restuans (GU908095.1), C. interrogator (JX259909.1), C. tarsalis (GU908102.1), C. salinarius (GU908096.1), C. nigripalpus (JX259910.1), and C. pipiens pallens (FN395206.1), C. pipiens (GU908084.1), C. quinquefasciatus (HQ398883.1), C. quinquefasciatus (GQ165798.1) were included as out-group taxa. A mtDNA COI haplotype network was constructed using the TCS inference method (Clement et al. Citation2000) implemented in POPART (Leigh and Bryant Citation2015). Analysis was performed using DnaSP V.5.10.1 to reveal the number of haplotypes, haplotype diversity, nucleotide diversity, and variable sites (Librado and Rozas Citation2009). The partitioning of genetic variation within and among populations was calculated via the analysis of molecular variance (AMOVA) with 1,000 permutations implemented in Arlequin v. 3.0 (Excoffier et al. Citation2017).
Results
The COI gene amplified 658 bp sequence with 160 variable sites, 94 parsimony-informative sites and 66 were singleton variable sites for C. tritaeniorhynchus. The average percentages of T, C, A, and G nucleotides were 39.1%, 15.5%, 29.6%, and 15.8% respectively, the content of A + T was higher than that of G + C, which showed the use of nucleotides was favorable. The overall genetic diversity of C. tritaeniorhynchus are summarized in . High haplotype diversity (Hd = 0.98) and low nucleotide diversity (p = 0.02245) were showed in C. tritaeniorhynchus populations. A total of 303 haplotypes were identified which the most common haplotype was H2, H55 and H130. Genetic distance was calculated based on the Kimura 2-parameter model. The results showed that the intraspecific genetic distance was 0.000–0.069 among 21 C. tritaeniorhynchus population. The average genetic distances between intraspecific genetic distance was 0.024.
Table 1. Genetic diversity of 21 geographic populations based on COI barcode.
The AMOVA results are displayed in . The inheritance within populations accounted for 98.8% of the total genetic variation, suggesting that most of the population variation in C. tritaeniorhynchus was due to genetic variation within populations. According to the topology of NJ tree and ML tree, the phylogenetic tree showed the clustering of these samples into two maternal lineages and four groups, group one includes Singapore, LN, FJ, HB, BJ, HEN, GZ, HUN, HAN, GX, HUB, CQ, SC, group two includes India, YN, GZ, group three includes JX, JS, ZJ, SH, group four includes GS, NX, SX (). The results were further supported by haplotype network based on COI gene (). The 21 C. tritaeniorhynchus populations distributed in the mainland China showed a certain degree of genetic differentiation and a great deal of gene flow (Fst = 0.01203, Nm = 47.11).
Figure 2. Neighbor-joining tree based on COI barcodes region of C. tritaeniorhynchus. Bootstrap support (1,000 replicates) of nodes from NJ tree and ML tree are indicated above and below the branches, respectively. Only nodes with BS > 70% are labeled.
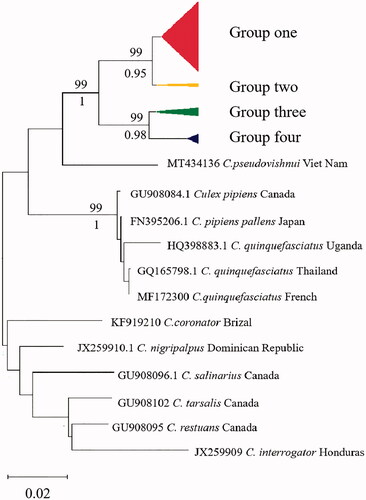
Figure 3. Haplotype network based on COI barcodes of Culex tritaeniorhynchus. Node sizes are proportional to haplotype frequencies. Lines linking the nodes are proportional to the mutation steps.
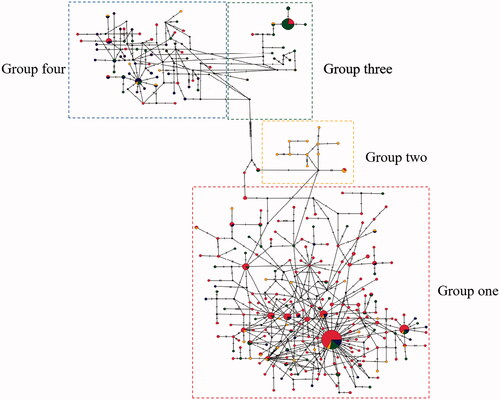
Table 2. AMOVA analysis of C. tritaeniorhynchus populations based on COI gene fragments.
Discussion
This is the first extensive study of C. tritaeniorhynchus in the mainland China with sampling spanning many of provinces. It was found that C. tritaeniorhynchus with high haplotype diversity and low nucleotide diversity, we assumed that C. tritaeniorhynchus population had experienced a bottleneck effect, accompanied by rapid population expansion and accumulation of variation (John Citation2010). The degree of differentiation among different populations of C. tritaeniorhynchus was small and gene flow was frequent (Fst = 0.01203, Nm = 47.11). AMOVA analysis showed that the genetic differentiation of C. tritaeniorhynchus was mainly between individuals within the population (98.80%), and there was little difference between different populations (1.20%). This may due to the long flight distance of C. tritaeniorhynchus, with an average maximum flight distance of 2.2 km and a maximum flight distance of 7.5 km (Verdonschot and Besse-Lototskaya Citation2014), which may increase gene exchange among different populations. The population of C. tritaeniorhynchus in Hainan Island, China also showed high haplotype diversity (Li et al. Citation2020), which was basically consistent with the results of this study. The C. tritaeniorhynchus in this study came from different geographical populations. The average genetic distances between intraspecific genetic distance was 0.024.In diptera family, 4–7% of the genetic distance is normal intraspecie variation and morphologically within the same species, while the genetic distance of cryptic species or pseudocryptic species are usually higher than 13% (Lin et al. Citation2015).
According to the topology of NJ tree and ML tree, COI sequences of C. tritaeniorhynchus revealed that there were two maternal lineages and four groups in the mainland China. This study revealed that most geographically closer populations were genetically similar and were included in the same sub cluster except group one. The sites in group one are located in Singapore and the north, central and south of China. Human activities may also assist mosquito movement and migration by transporting scarp tires, also by moving water-holding containers (Md Naim et al. Citation2020). It indicates that C. tritaeniorhynchus from different regions had more gene flow and clustered into a single group. The geographic groups of Gansu (GS), Ningxia (NX) and Shannxi (SX) are grouped into one branch, NX was in the north of China which occurred an outbreak of JE in 2018 (Liu et al. Citation2020). Thus, the gene flow of C. tritaeniorhynchus may increase the risk of JE in these areas. With the movement of people and trade, it will enhance the gene flow between adjacent areas which leads to the formation of groups three and four. C. tritaeniorhynchus is the main vector of JE with a wide distribution in China. Except the use of bed nets, window screens and repellent, insecticides are also effective for vector control. Gene flow among the populations may assist the spread of insecticide resistance genes over geographical areas (Barnes et al. Citation2017), it will be a challenging for controlling the populations. Moreover, our study fills the genetic structure vacant of C. tritaeniorhynchus population in the mainland China which providing guidance for vector control of JE disease.
Conclusion
In this study, C. tritaeniorhynchus has a certain pedigree and geographical structure in the mainland China. The results showed that the populations of C. tritaeniorhynchus had high haplotype diversity, low nucleotide diversity and high gene flow with two maternal lineages four groups. Human activities and the use of pesticides will affect the mosquito populations which may develop insecticide resistance gene and a challenging for controlling the mosquito vector populations.
Disclosure statement
No potential conflict of interest was reported by the author(s).
Data availability statement
The data that support the findings of this study are available in the National Center for Biotechnology Information (NCBI) at [https://www.ncbi.nlm.nih.gov/], reference number [MW488441-MW488925]
Additional information
Funding
References
- Barnes KG, Irving H, Chiumia M, Mzilahowa T, Coleman M, Hemingway J, Wondji CS. 2017. Restriction to gene flow is associated with changes in the molecular basis of pyrethroid resistance in the malaria vector Anopheles funestus. Proc Natl Acad Sci USA. 114(2):286–291.
- Beebe NW. 2018. DNA barcoding mosquitoes: advice for potential prospectors. Parasitology. 145(5):622–633.
- Clement MT, Posada D, Crandall KA. 2000. TCS: a computer program to estimate gene genealogies. Mol Ecol. 9(10):1657–1659.
- Donnelly MJ, Simard F, Lehmann T. 2002. Evolutionary studies of malaria vectors. Trends Parasitol. 18(2):75–80.
- Excoffier L, Laval G, Schneider S. 2017. Arlequin (version 3.0): An integrated software package for population genetics data analysis. Evol Bioinform. 2005(1):47–50.
- Folmer O, Black M, Hoeh W, Lutz R, Vrijenhoek R. 1994. DNA primers for amplification of mitochondrial Cytochrome C oxidase subunit I from diverse metazoan invertebrates. Mol Mar Biol Biotechnol. 3(5):294–299.
- Gorrochotegui-Escalante N, Gomez-Machorro C, Lozano-Fuentes S, Fernandez-Salas I, Delourdes-Munoz M, Farfan-Ale JA, Garda-Rejon J, Beaty BJ, Black WC. 2002. Breeding structure of Aedes aegypti populations in Mexico varies by region. Am J Trop Med Hyg. 66(2):213–222.
- Hayes CG, Basit A, Bagar S, Akhter R. 1980. Vector competence of Culex Tritaeniorhynchus (Diptera: Culicidae) for West Nile virus. J Med Entomol. 17(2):172–177.
- John CA. 2010. Perspective: conservation genetics enters the genomics era. Conservation Genetics. 11:665–669.
- Leigh JW, Bryant D. 2015. PopART: full-feature software for haplotype network construction. Methods Ecol Evol. 6(9):1110–1116.
- Li S, Jiang F, Lu H, Kang X, Wang Y, Zou Z, Wen D, Zheng A, Liu C, Liu Q, et al. 2020. Mosquito diversity and population genetic structure of six mosquito species from Hainan Island. Front Genet. 11:602863.
- Librado P, Rozas J. 2009. DnaSP v5: a software for comprehensive analysis of DNA polymorphism data. Bioinformatics. 25(11):1451–1452.
- Lin X, Stur E, Ekrem T. 2015. Exploring genetic divergence in a species-rich insect genus using 2790 DNA barcodes. PLoS One. 10(9):e138993.
- Liu B, Gao X, Ma J, Jiao Z, Xiao J, Wang H. 2018. Influence of host and environmental factors on the distribution of the Japanese encephalitis vector Culex tritaeniorhynchus in China. IJERPH. 15(9):1848.
- Liu W, Fu S, Ma X, Chen X, Wu D, Zhou L, Yin Q, Li F, He Y, Lei W, et al. 2020. An outbreak of Japanese encephalitis caused by genotype Ib Japanese encephalitis virus in China, 2018: a laboratory and field investigation. PLoS Negl Trop Dis. 14(5):e8312.
- Longbottom J, Browne AJ, Pigott DM, Sinka ME, Golding N, Hay SI, Moyes CL, Shearer FM. 2017. Mapping the spatial distribution of the Japanese encephalitis vector, Culex tritaeniorhynchus Giles, 1901 (Diptera: Culicidae) within areas of Japanese encephalitis risk. Parasit Vectors. 10(1):148.
- Lu B. 1997. Fauna Sinaca, Insecta, Diptera: Culicidae II, Volume 9. Beijing, China: Science Press.
- Mansfield KL, Hernández-Triana LM, Banyard AC, Fooks AR, Johnson N. 2017. Japanese encephalitis virus infection, diagnosis and control in domestic animals. Vet Microbiol. 201:85–92.
- Md Naim D, Kamal NZM, Mahboob S. 2020. Population structure and genetic diversity of Aedes aegypti and Aedes albopictus in Penang as revealed by mitochondrial DNA cytochrome oxidase I. Saudi J Biol Sci. 27(3):953–967.
- Ren X, Fu S, Dai P, Wang H, Li Y, Li X, Lei W, Gao X, He Y, Lv Z, et al. 2017. Pigsties near dwellings as a potential risk factor for the prevalence of Japanese encephalitis virus in adult in Shanxi. Infect Dis Poverty. 6(1):6.
- Sallam MF, Al AAM, Abdel-Dayem MS, Abdullah MAR, Edward PR. 2013. Ecological niche modeling and land cover risk areas for rift valley fever vector, Culex tritaeniorhynchus Giles in Jazan, Saudi Arabia. Plos One. 8(6):e65786.
- Sudhir K, Glen S, Li M, Christina K, Koichiro T. 2018. MEGA X: molecular evolutionary genetics analysis across computing platforms. Mol Biol Evol. 35(6):1547–1549.
- Swindell SR, Plasterer TN. 1997. SEQMAN. Contig assembly. Methods Mol Biol. 70:75–89.
- Verdonschot PFM, Besse-Lototskaya AA. 2014. Flight distance of mosquitoes (Culicidae): a metadata analysis to support the management of barrier zones around rewetted and newly constructed wetlands. Limnologica. 45:69–79.
- Yun S, Lee Y. 2014. Japanese encephalitis: the virus and vaccines. Hum Vaccin Immunother. 10(2):263–279.
- Zawani MKN, Abu HA, Sazaly AB, Zary SY, Darlina MN. 2014. Population genetic structure of Aedes albopictus in Penang, Malaysia. Genet Mol Res. 13(4):8184–8196.
- Zhang JS, Zhao QM, Guo XF, Zuo SQ, Cheng JX, Jia N, Wu C, Dai PF, Zhao JY. 2011. Isolation and genetic characteristics of human genotype 1 Japanese encephalitis virus, China, 2009. PLoS One. 6(1):e16418.
- Zheng Y, Li M, Wang H, Liang G. 2012. Japanese encephalitis and Japanese encephalitis virus in mainland China. Rev Med Virol. 22(5):301–322.
- Zouré AA, Noël G, Sombié A, Somda Z, Badolo A, Francis F. 2020. Genetic analysis and population structure of the Anopheles gambiae complex from different ecological zones of Burkina Faso. Infect Genet Evol. 81:104261.