
Abstract
Black-boned chickens (Gallus domesticus, herein abbreviated BBCs) are well known for their unique appearance and medicinal properties and have a long breeding history in China. However, the genetic diversity and demographic history of BBCs remain unclear. In this study, we analyzed 844 mitochondrial DNA D-loop sequences, including 346 de novo sequences and 498 previously published sequences from 20 BBC breeds. We detected a generally high level of genetic diversity among the BBCs, with average haplotype and nucleotide diversities of 0.917 ± 0.0049 and 0.01422, respectively. Nucleotide diversity was highest in populations from Southwest China (0.01549 ± 0.00026), particularly in Yunnan Province (0.01624 ± 0.00025). Significant genetic divergence was detected between most breeds, particularly between Yunnan chickens and those from all other provinces. Haplogroups F and G had the highest levels of genetic diversity and were restricted to Southwest China, particularly Yunnan Province. Based on neutrality tests and mismatch distribution analyses, we did not obtain evidence for rapid population expansions and observed similar demographic histories in BBCs and local non-BBCs. Our results suggest that Chinese BBCs have complex breeding histories and may be selected in situ from local domestic chickens. These results improve our understanding of the genetic heritage and breeding histories of these desirable chickens.
Introduction
Black-boned chickens (Gallus gallus domesticus; herein abbreviated BBCs), renowned for their characteristic black skin, bone, and muscle, have a long history, appearing in the ancient Chinese herbology volume “Bencao Gangmu” written around 1578 C.E. (Li Citation2005). In China, over 18 BBC breeds have been recorded across 11 provinces (China National Commission of Animal Genetic Resources Citation2011). For example, Silkie, described in the thirteenth century travelogue “The Travels of Marco Polo” (Benedetto Citation2014), is a famous breed defined by a set of ten traits: walnut-shaped comb, dark wattles, turquoise-blue earlobes, bearded, silky feathers, five toes, black skin, bones, and meat, and booted feet (China National Commission of Animal Genetic Resources Citation2011). Studies of BBCs have focused on the chemical properties of the meat (Jaturasitha et al. Citation2008; Tian et al. Citation2011), distribution of melanin pigmentation (Nganvongpanit et al. Citation2020), molecular mechanism underlying melanin deposition (Dorshorst et al. Citation2011; Shinomiya et al. Citation2012; Yu et al. Citation2018; Li et al. Citation2019), as well as the origin and evolution of fibromelanosis (Dharmayanthi et al. Citation2017; Sohn et al. Citation2018). Additionally, genetic analyses based on genetic markers, such as microsatellites (Tang et al. Citation2005; Qu et al. Citation2006; Yu et al. Citation2006) and mitochondrial DNA (mtDNA) (Zhu et al. Citation2014; Guo et al. Citation2017; Jia et al. Citation2017; Zhang et al. Citation2018; Liu et al. Citation2018; Weng et al. Citation2019) have attempted to unravel the population genetic history of BBCs. However, the scarcity of sampled breeds is a major limitation of these studies, and this issue is further compounded by the complexity of chicken demographics and domestication histories (Tixier-Boichard et al. Citation2011; Miao et al. Citation2013; Lan et al. Citation2017; Huang et al. Citation2018a). Consequently, the patterns of genetic diversity and population history of BBCs, including the degree of similarity in demographic trajectories among breeds endemic to different regions, remain unclear.
Since the 1990s, mtDNA D-loop has been widely used to trace the history of chicken domestication owing to its high mutation rate, lack of recombination, and maternal inheritance (Di Lorenzo et al. Citation2015; Lan et al. Citation2017). In the current study, we evaluated an extensive mtDNA D-loop dataset for various BBC breeds spanning a wide geographical distribution to reassess genetic diversity and divergence across China. Additionally, a d-loop dataset for local non-BBC populations was used for comparative analyses to infer the demographic histories of BBCs.
Materials and methods
Sample collection
A total of 346 wing-vein blood samples were collected and stored at −80 °C in the sample database of Jiaying University. These samples were obtained from 13 BBC breeds distributed across nine provinces in China (Table S1). Animal handling and experimentation followed the animal experimental procedures and guidelines approved by the Ethics Committee of Jiaying University (#20151103). Genomic DNA was extracted using the standard phenol–chloroform method, and the DNA concentration and purity were assessed by gel electrophoresis and using a NanoDrop Spectrophotometer 2000 (ThermoFisher Scientific, Waltham, MA). Additionally, 498 published mtDNA d-loop sequences for 15 BBC breeds in China (Table S2) as well as mtDNA d-loop sequences of local non-BBCs (Table S3) were retrieved from GenBank (www.ncbi.nlm.nih.gov).
PCR amplification and sequencing
The d-loop was amplified using the primers L16750 (5′-AGGACTACGGCTTGAAAAGC-3′′) (Fumihito et al. Citation1994) and H522 (5′-ATGTGCCTGACCGAGGAACCAG-3′′) (Fu et al. Citation2001). PCR amplifications were performed using a Bio-Rad thermal cycler (Bio-Rad, Hercules, CA) in a final volume of 30 μL containing 3 μL of 10× buffer (Mg2+), 2.4 μL of dNTPs (2.5 mM), 0.3 μL of each primer (20 pmol/μL), 0.3 μL of rTaq polymerase (5 units/μL; TaKaRa, Berkeley, CA), 23.2 μL of ddH2O, and 0.5 μL of genomic DNA (50–100 ng/μL). The cycling profile included a 4-min preliminary denaturation cycle at 94 °C, followed by 35 cycles of denaturation at 94 °C for 30 s, annealing at 63 °C for 1 min, and extension at 72 °C for 50 s, with a final extension at 72 °C for 10 min.
The PCR products were separated by electrophoresis on a 1.5% agarose gel containing GelRed (Biotium Inc., Fremont, CA), and visualized under ultraviolet light. Sequencing of the D-loop was carried out at Guangzhou IGE Biotechnology Co., Ltd. (Guangzhou, China) using an ABI 3730xl Analyzer (Applied Biosystems, Foster, CA).
Data analyses
DNA sequences were manually checked using BioEdit (Hall Citation1999), and then aligned using the ClustalW algorithm in MEGA 6.0 (Tamura et al. Citation2013). All sequences were aligned and trimmed to 518 bp, corresponding to nucleotide positions (nps) 1–518 of the red junglefowl reference sequence AP003321. Haplotypes were defined using DnaSP 6.10.01 (Rozas et al. Citation2017). These sequences were then assigned to specific haplogroups according to DomeTree (Peng et al. Citation2015a). Nucleotide (π) and haplotype diversities (Hd) were calculated using DnaSP 6.10.01 (Rozas et al. Citation2017). A median-joining network of d-loop sequences was constructed using NETWORK 5.0 (Bandelt et al. Citation1999). To assess population genetic differentiation and gene flow among sampling locations, pairwise FST values were computed using ARLEQUIN 3.5 with 10,000 permutations (Excoffier and Lischer Citation2010). These pairwise FST values were then used to generate non-metric multidimensional scaling plots using SPSS 19.0 (IBM Corp., Armonk, NY). To further explore geographical structure, an analysis of molecular variance (AMOVA) was also calculated in ARLEQUIN 3.5 (Excoffier and Lischer Citation2010) using breeds (populations), provinces or regions as groups. A mismatch distribution analysis with the expectations of a sudden expansion model was performed and population expansion statistics (Fu’s Fs and Tajima’s D) were calculated using ARLEQUIN 3.5 (Excoffier and Lischer Citation2010) with 10,000 permutations.
Results
Geographical distribution of mitochondrial haplogroups
Our analysis included 844 mtDNA D-loop sequences (346 de novo; GenBank accession numbers: MH923578–MH923923) belonging to 20 BBC breeds in China. In total, 116 haplotypes were identified (nps 1–518), including 90 haplotypes exclusive to a single breed and 26 haplotypes shared by two or more breeds. Yunnan Province had the most haplotypes (54), followed by Zhejiang (33), Guizhou (24), and Sichuan (15). BBCs from Yunnan and Zhejiang provinces had more private haplotypes (Table S4). The 116 haplotypes belonged to haplogroups A–G and Z (Table S4). The geographical distribution of mtDNA haplogroups of BBCs is shown in Table S5. Interestingly, a similar pattern (haplogroups F and G) was also observed in non-BBCs in China (Table S6). Overall, all seven haplogroups were found in Yunnan Province, whereas the other provinces lacked two or more haplogroups.
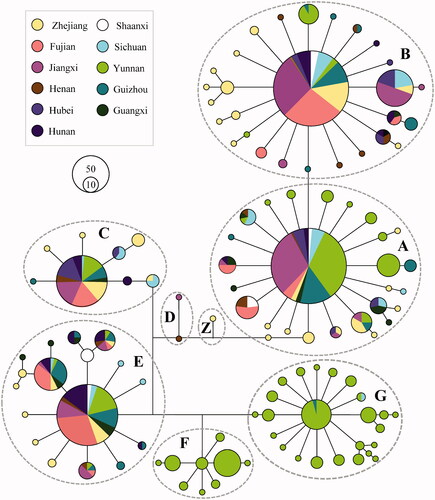
A median-joining phylogenetic network based on 844 mtDNA D-loop sequences showed a clear geographical pattern (). Haplogroups A, B, C, E, and G formed star-like patterns in the network, each of which had a predominant haplotype and few derived haplotypes. Haplogroups D and Z were rare, only occurring in Henan, Jiangxi, and Zhejiang Province. Haplogroup F, detected only in Yunnan Province, was found at a particularly high frequency in the Tengchong white breed, while haplogroup G was mainly observed in the Yanjin Black-boned breed, and only one haplotype was detected in each of Sichuan Silky and Sichuan Mountain Black-boned breeds. The median-joining network of mtDNA d-loop sequences for BBCs (n = 844) and local non-BBCs (n = 1663) did not demonstrate BBC-specific or non-BBC-specific patterns, and the two groups shared the same haplogroups or major haplotypes (Figure S1).
Figure 1. Median-joining network of mtDNA haplotypes of BBCs from eleven provinces. The links are labeled by the nucleotide positions to designate transitions. Cycle sizes are roughly proportional to the haplotype frequency.
Genetic diversity
The Hd and π values, and the average number of nucleotide differences (K) for all samples were 0.917 ± 0.0049, 0.01442, and 7.365, respectively (). The Wuliangshan Black-boned breed had the highest π value (0.01633 ± 0.00048), while the Silkies breed had the lowest (0.00733 ± 0.00063). With respect to the 11 provinces, BBCs from Yunnan Province had the highest π value (0.01624 ± 0.00025), while those from Jiangxi Province had the lowest (0.01024 ± 0.00062). Regionally, the highest π value was detected in Southwest China (0.01549 ± 0.00026) and the lowest was detected in Northwest China (0.01162 ± 0.00081). Regarding Hd, Yunnan, Guangxi, Henan, and Zhejiang Provinces showed the highest values (>0.9), while Fujian and Jiangxi Provinces had the lowest (<0.8) (). Combining the results for Hd and π, diversity was the highest in chickens from Southwest China, especially those from Yunnan Province, and the lowest in chickens from Northwest China. Interestingly, it shows near levels of π in both BBCs and non-BBCs, with the exception of those in Yunnan Province, where it harbors higher π values in BBCs than in non-BBCs (Tables 1 and S7). Estimates of genetic diversity for major haplogroups are presented in Table S8. Briefly, π values were the highest in haplogroups F and G in Southwest China.
Table 1. Genetic diversity of mtDNA D-loop in 20 Black-boned chicken breeds.
Genetic divergence
To evaluate genetic differentiation among chickens, pairwise FST values were computed using ARLEQUIN 3.5 according to chicken breeds and provinces. A non-metric multidimensional scaling plot was subsequently generated based on the pairwise FST values to ascertain population/province relationships (Figure S2). The Yunxian Black-boned breed showed the greatest differentiation from other breeds, while Silkies, Hubei Silky black, and Sichuan Silky breeds were clustered together (Figure S2A). The BBC populations from Yunnan Province were significantly divergent from those from other provinces (Figure S2B).
The AMOVA showed that variance was higher within populations than among populations within groups or among groups (Table S9). This suggests that the molecular variance mainly exists within breeds, followed by provinces, and finally regions. These results are generally in accordance with the results of FST analyses.
Demographic history
Neutrality tests and a mismatch distribution analysis of BBCs and non-BBCs were performed to detect population trajectories of BBCs. As determined by Fu’s Fs neutrality statistics for BBCs, only chickens from Yunnan Province and Southwest China showed significant deviations from neutrality, but none of the breeds showed deviations from neutrality (). All Tajima’s D tests for BBCs showed no significant departure from neutrality (). In the Fu’s Fs neutrality tests of non-BBCs, however, departures from neutrality were detected in populations from Yunnan, Henan, and Hubei Provinces (Table S7). The mismatch distribution graph is in accord with the results of neutrality tests (Figure S3).
Discussion
Based on the most comprehensive dataset to date, including 844 mtDNA d-loop sequences for 20 breeds from 11 provinces across China, we characterized genetic diversity and genetic differentiation in Chinese BBCs, which show interesting geographical patterns. Haplogroups A–G were disproportionately observed among the 844 chickens. Additionally, these haplogroups showed differential geographical endemicity. Common haplogroups, including A, B, and E, were found in all eleven provinces. However, haplogroup C was absent in Northwest China, haplogroup D occurred in Central and East China, while haplogroups F and G were restricted to Southwest China. Interestingly, non-BBCs in China showed a similar geographical distribution pattern to those of haplogroups F and G.
Specific mitochondrial haplogroups are widely used as candidate genetic markers to trace the demographic history of chickens (Lan et al. Citation2017), including chicken C1 (Huang et al. Citation2018a) and haplogroup D (Herrera et al. Citation2017; Zhang et al. Citation2017). Thus, the geographical distribution observed in the current study suggests that BBC breeds associated with different areas are likely to have distinct demographic histories.
To evaluate this possibility, we performed detailed genetic analyses of mtDNA D-loop sequence data for Chinese BBCs. Compared with that of other indigenous Chinese chickens, such as chicken breeds from Guangdong Province and its adjacent regions (Huang et al. Citation2018b), Jiangsu Province (Jia et al. Citation2017), East China (Jia et al. Citation2017), and other regions in China (Huang et al. Citation2018b), BBCs maintained a high level of genetic diversity. In particular, genetic diversity of BBCs from Southwest China was higher than diversity estimates for chickens from other regions, whereas BBCs from East China showed the lowest diversity. This observation may be explained by differences in traditional cultures as well as different intensities of selection. BBCs are fascinating breeds owing to their unique appearance, and local residents tend to limit crossbreeding to maintain characters. Silkies is a famous BBC breed with an atypical fluffy plumage; it was officially recognized in 1874 in North America as the Standard of Perfection (Ekarius Citation2007). Owing to its popularity, Silkies has been subjected to intense selection, resulting in a decline in genetic diversity (Jia et al. Citation2017). With a relatively large sample size, we detected few exclusive haplotypes and low genetic diversity in Silkies, confirming its breeding history.
Neutrality tests indicated that BBCs in China have not undergone rapid population expansion. The mismatch distribution graph showed that BBCs and non-BBCs share similar demographic trajectories, except for those from Henan and Hubei provinces. This finding is in accordance with the results of Huang et al. (Citation2018a). A neighbor-joining network did not indicate BBC-specific haplogroups or major haplotypes. Consistent with the estimates of genetic diversity and genetic divergence and with husbandry reports, numerous BBC breeds endemic to China may be selected in situ from local domestic chickens (Weng et al. Citation2019).
The significant differentiation between chickens from Southwest China, particularly Yunnan Province, and those from other regions suggests that BBCs of Southwest China experienced limited gene flow with each other and with chicken from other regions, with only weak genetic selection (Miao et al. Citation2015). Both Fu’s Fs and pairwise FST values indicated that no breed deviates from neutrality, whereas deviations were detected at the province/region level. It is noteworthy that genetic analyses by haplogroups showed that F and G, privatized to Southwest China, have higher π values than those of other haplogroups, including A and C. Although previous research has reported that the chickens from Yunnan Province display high levels of genetic diversity and multiple unique mtDNA haplogroups (Liu et al. Citation2006; Miao et al. Citation2013; Huang et al. Citation2018a), the complex history of chicken domestication (Xiang et al. Citation2014; Peng et al. Citation2015b; Peters et al. Citation2015, Citation2016; Eda et al. Citation2016; Huang et al. Citation2018a) necessitates further research using more robust approaches and high-density markers, such as genome-wide SNPs, to establish whether the breeding center of Chinese BBCs is in Southwest China and to obtain a more in-depth understanding of BBC evolution.
Acknowledgements
The authors are grateful to Prof. ZhongSheng Xia and Xiurong Yang from Guangxi University, Prof. Ang Li from Fujian Agriculture and Forestry University, Dr Yanping Wu from Jiangxi Academy of Agricultural Sciences, and volunteers for the help of sampling. The authors also thank Dr Minsheng Peng and Newton Otieno Otecko of Kunming Institute of Zoology for constructive comments on the manuscript.
Disclosure statement
The authors declare that they have no competing interests.
Data availability statement
The mitochondrial DNA D-loop data were submitted to NCBI under the GenBank accession nos. MH923578–MH923923.
Additional information
Funding
References
- Bandelt HJ, Forster P, Rohl A. 1999. Median-joining networks for inferring intraspecific phylogenies. Mol Biol Evol. 16(1):37–48.
- Benedetto LF. 2014. The travels of Marco Polo. London: Routledge Press.
- China National Commission of Animal Genetic Resources. 2011. Animal genetic resources in China – poultry. Beijing: China Agriculture Press.
- Dharmayanthi AB, Terai Y, Sulandari S, Zein MSA, Akiyama T, Satta Y. 2017. The origin and evolution of fibromelanosis in domesticated chickens: genomic comparison of Indonesian Cemani and Chinese Silkie breeds. PLoS One. 12(4):e0173147.
- Di Lorenzo P, Ceccobelli S, Panella F, Attard G, Lasagna E. 2015. The role of mitochondrial DNA to determine the origin of domestic chicken. World Poult Sci J. 71(2):311–318.
- Dorshorst B, Molin AM, Rubin CJ, Johansson AM, Strömstedt L, Pham MH, Chen CF, Hallböök F, Ashwell C, Andersson L. 2011. A complex genomic rearrangement involving the endothelin 3 locus causes dermal hyperpigmentation in the chicken. PLoS Genet. 7(12):e1002412.
- Eda M, Lu P, Kikuchi H, Li ZP, Li F, Yuan J. 2016. Reevaluation of early Holocene chicken domestication in northern China. J Archaeol Sci. 67:25–31.
- Ekarius C. 2007. Storey’s illustrated guide to poultry breeds. Massachusetts: Storey Publishing.
- Excoffier L, Lischer HEL. 2010. Arlequin suite ver 3.5: a new series of programs to perform population genetics analyses under Linux and Windows. Mol Ecol Resour. 10(3):564–567.
- Fu Y, Niu D, Luo J, Ruan H, He GQ, Zhang YP. 2001. Studies of the origin of Chinese domestic chickens. Yi Chuan Xue Bao. 28(5):411–417.
- Fumihito A, Miyake T, Sumi S, Takada M, Ohno S, Kondo N. 1994. One subspecies of the red junglefowl (Gallus gallus gallus) suffices as the matriarchic ancestor of all domestic breeds. Proc Natl Acad Sci U S A. 91(26):12505–12509.
- Guo HW, Li C, Wang XN, Li ZJ, Sun GR, Li GX, Liu XJ, Kang XT, Han RL. 2017. Genetic diversity of mtDNA D-Loop sequences in four native Chinese chicken breeds. Br Poult Sci. 58(5):490–497.
- Hall TA. 1999. Bioedit: a user-friendly biological sequence alignment editor and analysis program for Windows 95/98/NT. Nucleic Acids Symposium Series, Vol. 41, p. 95–98.
- Herrera MB, Thomson VA, Wadley JJ, Piper PJ, Sulandari S, Dharmayanthi AB, Kraitsek S, Gongora J, Austin JJ. 2017. East African origins for Madagascan Chickens as indicated by mitochondrial DNA. R Soc Open Sci. 4(3):160787.
- Huang XH, Wu YJ, Miao YW, Peng MS, Chen X, He DL, Suwannapoom C, Du BW, Li XY, Weng ZX, et al. 2018a. Was chicken domesticated in northern China? New evidence from mitochondrial genomes. Sci Bull. 63(12):743–746.
- Huang XH, Yu ZQ, Weng ZX, He DL, Yi ZH, Li WN, Chen JB, Zhang XQ, Du BW, Zhong FS, 2018b. Mitochondrial genetic diversity and maternal origin of Guangdong indigenous chickens. Biodiv Sci. 26(3):238–247.
- Jaturasitha S, Srikanchai T, Kreuzer M, Wicke M. 2008. Differences in carcass and meat characteristics between chicken indigenous to Northern Thailand (Black-Boned and Thai Native) and imported extensive breeds (Bresse and Rhode Island Red). Poult Sci. 87(1):160–169.
- Jia XX, Tang XJ, Fan YF, Lu JX, Huang SH, Ge QL, Gao YS, Han W, 2017. Genetic diversity of local chicken breeds in East China based on mitochondrial DNA D-loop region. Biodiv Sci. 25(5):540–548.
- Lan D, Hu Y, Zhu Q, Liu Y. 2017. Mitochondrial DNA study in domestic chicken. Mitochondrial DNA A DNA Mapp Seq Anal. 2728(1):25–29.
- Li SZ. 2005. Bencao Gangmu. Beijing: People’s Medical Publishing House.
- Li D, Wang X, Fu Y, Zhang C, Cao Y, Wang J, Zhang Y, Li Y, Chen Y, Li Z, et al. 2019. Transcriptome analysis of the breast muscle of Xichuan black-bone chickens under tyrosine supplementation revealed the mechanism of tyrosine-induced melanin deposition. Front Genet. 10:457.
- Liu YP, Wu GS, Yao YG, Miao YW, Luikart G, Baig M, Beja-Pereira A, Ding ZL, Palanichamy MG, Zhang YP. 2006. Multiple maternal origins of chickens: out of the Asian jungles. Mol Phylogenet Evol. 38(1):12–19.
- Liu LL, Yang YQ, Liu YT, Yang N, Xie D, Huang Z. 2018. Complete mitochondrial genome sequence of Zhuxiang chicken (Gallus domesticus) and its phylogenetic analysis from D-loop region. Mitochondrial DNA B Resour. 3(2):874–875.
- Miao YW, Peng MS, Wu GS, Ouyang YN, Yang ZY, Yu N, Liang JP, Pianchou G, Beja-Pereira A, Mitra B, et al. 2013. Chicken domestication: an updated perspective based on mitochondrial genomes. Heredity (Edinb). 110(3):277–282.
- Miao YW, Sun LM, Wang SF, Ouyang YN, Zhang YY, Yuan F, He SC, Li QL. 2015. Genetic diversity analysis of three indigenous chicken populations in Yunnan using mtDNA D-loop sequences. J Yunnan Agric Univ. 30(3):395–401.
- Nganvongpanit K, Kaewkumpai P, Kochagul V, Pringproa K, Punyapornwithaya V, Mekchay S. 2020. Distribution of melanin pigmentation in 33 organs of Thai Black-Bone Chickens (Gallus gallus domesticus). Animals. 10(5):777.
- Peng MS, Fan L, Shi NN, Ning T, Yao YG, Murphy RW, Wang WZ, Zhang YP. 2015a. DomeTree: a canonical toolkit for mitochondrial DNA analyses in domesticated animals. Mol Ecol Resour. 15(5):1238–1242.
- Peng MS, Shi NN, Yao YG, Zhang YP. 2015b. Caveats about interpretation of ancient chicken mtDNAs from northern China. Proc Natl Acad Sci U S A. 112(16):E1970–E1971.
- Peters J, Lebrasseur O, Best J, Miller H, Fothergill T, Dobney K, Thomas RM, Maltby M, Sykes N, Hanotte O, et al. 2015. Questioning new answers regarding Holocene chicken domestication in China. Proc Natl Acad Sci U S A. 112(19):E2415.
- Peters J, Lebrasseur O, Deng H, Larson G. 2016. Holocene cultural history of Red jungle fowl (Gallus gallus) and its domestic descendant in East Asia. Quaternary Sci Rev. 142:102–119.
- Qu LJ, Li XY, Xu GF, Chen KW, Yang HJ, Zhang LC, Wu GQ, Hou ZC, Xu GY, Yang N. 2006. Evaluation of genetic diversity in Chinese indigenous chicken breeds using microsatellite markers. Sci China C Life Sci. 49(4):332–341.
- Rozas J, Ferrer-Mata A, Sánchez-DelBarrio JC, Guirao-Rico S, Librado P, Ramos-Onsins SE, Sánchez-Gracia A. 2017. DnaSP 6: DNA sequence polymorphism analysis of large data sets. Mol Biol Evol. 34(12):3299–3302.
- Shinomiya A, Kayashima Y, Kinoshita K, Mizutani M, Namikawa T, Matsuda Y, Akiyama T. 2012. Gene duplication of *endothelin 3 is closely correlated with the hyperpigmentation of the internal organs (Fibromelanosis) in silky chickens. Genetics. 190(2):627–638.
- Sohn JI, Nam K, Hong H, Kim JM, Lim D, Lee KT, Do YJ, Cho CY, Kim N, Chai HH, et al. 2018. Whole genome and transcriptome maps of the entirely black native Korean chicken breed Yeonsan Ogye. Gigascience. 7(7):1–14.
- Tamura K, Stecher G, Peterson D, Filipski A, Kumar S. 2013. MEGA6: Molecular Evolutionary Genetics Analysis Version 6.0. Mol Biol Evol. 30(12):2725–2729.
- Tang QP, Chen KW, Li HF, Zhang SJ, Zhao DW. 2005. Analysis of the genetic diversity of 12 Chinese indigenous black-bone chicken breeds using microsatellite marker. Acta Vet Zootechnica Sin. 36(8):755–760.
- Tian YG, Zhu S, Xie MY, Wang WY, Wu HJ, Gong DM. 2011. Composition of fatty acids in the muscle of black-bone silky chicken (Gallus gellus demesticus brissen) and its bioactivity in mice. Food Chem. 126(2):479–483.
- Tixier-Boichard M, Bed’hom B, Rognon X. 2011. Chicken domestication: from archeology to genomics. CR Biol. 334(3):197–204.
- Weng ZX, Huang JQ, Zhang SH, Yu KC, Zhong FS, Huang XH, Zhang B. 2019. Genetic diversity and population structure of black-bone chickens in China revealed by mitochondrial COI gene sequences. Biodiv Sci. 27(6):667–676.
- Xiang H, Gao JQ, Yu BQ, Zhou H, Cai DW, Zhang YW, Chen XY, Wang X, Michael H, Zhao XB. 2014. Early Holocene chicken domestication in northern China. Proc Natl Acad Sci U S A. 111(49):17564–11569.
- Yu SG, Wang G, Liao J, Tang M. 2018. Transcriptome profile analysis identifies candidate genes for the melanin pigmentation of breast muscle in Muchuan black-boned chicken. Poult Sci. 97(10):3446–3455.
- Yu YB, Wang JY, Mekki DM, Tang QP, Li HF, Gu R, Ge QL, Zhu WQ, Chen KW. 2006. Evaluation of genetic diversity and genetic distance between twelve Chinese indigenous chicken breeds based on microsatellite markers. Int J Poult Sci. 5(6):550–556.
- Zhang T, Du W, Lu H, Wang L. 2018. Genetic diversity of mitochondrial DNA of Chinese black-bone chicken. Braz J Poult Sci. 20(3):565–572.
- Zhang L, Zhang P, Li QQ, Gaur U, Liu YP, Zhu Q, Zhao XL, Wang Y, Yin HD, Hu YD, et al. 2017. Genetic evidence from mitochondrial DNA corroborates the origin of Tibetan chickens. PLoS One. 12(2):e0172945.
- Zhu WQ, Li HF, Wang JY, Shu JT, Zhu CH, Song WT, Song C, Ji GG, Liu HX. 2014. Molecular genetic diversity and maternal origin of Chinese black-bone chicken breeds. Genet Mol Res. 13(2):3275–3282.