
Abstract
To analyze the genetic background of ‘white’ type Northern snakehead (Channa argus), and provide atheoretical basis for breeding of C. argus, the investigation of genetic diversity and population structure were investigated based on the complete sequences of mitochondrial DNA D-loop region for three cultured ‘white’ type C. argus populations, and four ‘bicolor’ type C. argus populations were used to compare with them; 28 mutation loci and 30 haplotypes were found in the D-loop sequence of all individuals with a total length of 907 bp. The highest haplotype diversity (Hd) and nucleotide diversity (Pi) in the ‘white’ type C. argus populations were 0.505 and 0.00057, respectively, which lower than those in the ‘bicolor’ type C. argus populations (Hd = 0.911, Pi = 0.00326). Population differentiation values (FST) show that the four ‘bicolor’ type C. argus populations had obvious genetic differentiation (Fst: 0.21902–0.49428. p < 0.01), but not in the three ‘white’ type C. argus populations (Fst: −0.00571 to 0.07261. p > 0.05). The phylogenetic tree and Median Joining (MJ) network showed that the genetic distance among ‘white’ type C. argus populations is very close. Therefore, much attention should be paid to protecting population genetic diversity and avoiding inbreeding in the breeding of ‘white’ type C. argus.
Introduction
The Northern snakehead (Channa argus) is the most widely distributed and most prolific species in the Channidae (Wang et al. Citation2020). There are two distinct color morphs of C. argus; The ‘bicolor’ type C. argus exhibits a decorative pattern of alternate black and white color, and it is widely distributed in China. The ‘white’ type C. argus is white without any blotches, and it is only found in Jialing river (Su et al. Citation2018; Zhou et al. Citation2021). The two color morphs of C. argus has been classified as two distinct species (Kimura Citation1934), and the ‘white’ type was written as ‘Opniocepnalus Argus var’ in some studies (Li et al. Citation2016; Zhou et al. Citation2018). However, some studies compared the morphological characteristics, lactate dehydrogenase, esterase isozyme, chromosome type, and mitochondria of the two color morphs of C. argus, and they showed that the ‘white’ type C. argus could not be divided into a subspecies and should be regarded as an albino variant of the ‘bicolor’ type C. argus (Wang et al. Citation1992; Zhou et al. Citation2021). However, the contents of nutrients such as crude protein and polyunsaturated fatty acid in the muscle of ‘white’ type C. argus were higher than ‘bicolor’ type C. argus (Zhou et al. Citation2018), and the ‘white’ type C. argus is very popular among consumers because of its good taste, medicinal, and ornamental values (Su et al. Citation2018).
Since the 1990s, artificial breeding of wild ‘white’ type C. argus populations has been conducted by harvesting from the Jialing River (Liu Citation1997). The studies on ‘white’ type C. argus were mainly focused on breeding technology (Su and Xiong Citation2001), culture model (Su et al. Citation2019), chromosome karyotype (Li et al. Citation2016), disease (Mou et al. Citation2014; Wu et al. Citation2018), and nutritional composition (Deng et al. Citation2019), but there are few studies on the genetic diversity of ‘white’ type C. argus. In recent years, the scale of ‘white’ type C. argus cultivation has increased (Su et al. Citation2018). To protect and utilize the resources of ‘white’ type C. argus, it is necessary to investigate the genetic diversity and population structure of ‘white’ type C. argus.
The mtDNA D-loop region contains conserved fragments, and it is also the region with the largest variation in sequence and length (Chen et al. Citation2011). The mtDNA D-loop sequences have been widely used in the study of genetic differentiation, genetic structure, and variation in fish, such as the genetic structure and variation in the wild and breeding populations of Chinese carp (Liu et al. Citation2017), genetic diversity and population structure of endangered Clarias magur (Das Citation2020), and the genetic variation of Ptychidio jordani (Peng et al. Citation2020). The mtDNA D-loop region has been used to analyze the genetic diversity and population structure of ‘bicolor’ type C. argus populations in different regions, such as the Huaihe River (Xiao et al. Citation2013), Baiyangdian and Dongting lake (Dong et al. Citation2014), the rivers in Shangxi, Henan, Luoyang, and Jiangsu province (Zhou et al. Citation2017). Many studies have been reported on the genetic diversity and population structure of ‘bicolor’ type C. argus, but few studies have been reported on ‘white’ type C. argus (Zhou et al. Citation2017, Citation2021). Thus far, little is known about the genetic background of ‘white’ type C. argus; therefore, it is essential to study the mtDNA D-loop region to understand the genetic diversity and population structure of ‘white’ type C. argus populations.
In this study, the genetic diversity and population structure were evaluated based on the complete sequences of mitochondrial DNA D-loop region for three cultured ‘white’ type C. argus populations. Meanwhile four ‘bicolor’ type C. argus populations were used for genetic comparison with the ‘white’ type C. argus, with the aim of provide a theoretical basis for breeding, protection of fishery resources, and sustainable development.
Materials and methods
Study area
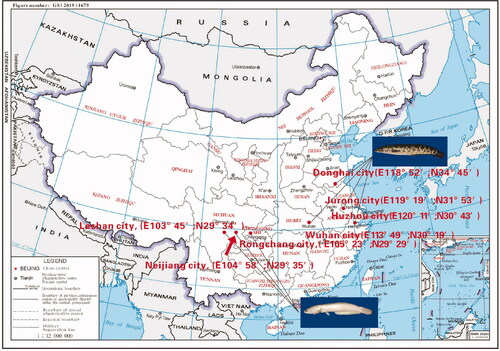
A total of 350 individuals of two color morphs C. argus were collected from different geographical locations (); 150 individuals of ‘white’ type C. argus were collected, among which 50 individuals each were obtained from Rongchang city (RC), Neijiang city (NJ), and Leshan city (LS). Besides, 200 individuals of ‘bicolor’ type C. argus were collected, among which 50 individuals each were obtained from Donghai city (DH), Wuhan city (WH), Jurong city (JR), and Huzhou city (HZ).
Figure 1. Schematic diagram of the study area.
Sample collection
A part of caudal fin was collected from each individual, preserved in 95% alcohol and stored at −20 °C in the herbarium of Fishery Institute of the Sichuan Academy of Agricultural Sciences. The genomic DNA was extracted using an Ezup Column Animal Genomic DNA Purification Kit (Sangon Biotech Co., Ltd., Shanghai, China) and stored at −20 °C.
PCR amplification and sequencing
The primers were designed using Primer 5.0 (Zhai et al. Citation2008). According to the full-length mitochondrial sequence of C. argus (GenBank NC015191.1), the upstream primers and downstream primers were 5′-GCCTCTTTCCTTTACTTCTC-3′ and 5′-GGGTGTATTGAGCCTGATA-3′, respectively. An amplification reaction was carried out in 25 μL volumes consisting of 12.5 μL of 2xTaq PCR mix buffer (Sangon Biotech Co., Ltd, Shanghai, China), 1 μL of 100 ng/μL DNA template, 1 μL of 10 mM of each primer, and 9.5 μL of sterile ultrapure water. The PCR amplification procedure was as follows: predenaturation at 94 °C for 3 min, 36 cycles of amplification (94 °C 40 s, 58 °C 55 s, 72 °C 1 min), extension at 72 °C for 10 min, and finally preservation at 4 °C. The PCR products were bidirectionally sequenced by Sangon Biotech Co., Ltd.
Data analysis
The D-loop sequences were separately aligned and trimmed to equal lengths using the MEGA 5.2 (Tamura et al. Citation2011) and ClustalX 2.1 (Thompson et al. Citation1997) software. Genetic diversity parameters were estimated using DnaSP 5.0 (Rozas et al. Citation2003) software. The Unweighted Pair Group Method with Arithmetic Mean (UPGMA) tree and the genetic distance among all the populations were constructed and computed using MEGA 5.2 software. Network 4.6 (Polzin and Daneshmand Citation2003) was used to construct Median Joining (MJ) network.
Results
Genetic diversity
A total of 350 homologous sequences of 907 bp were used for the genetic diversity analysis. A total of 28 nucleotide variation sites and 30 haplotypes (Hap) were detected in all individuals (). The haplotype diversity (Hd) of ‘bicolor’ type C. argus was 0.187–0.911, and the Hd of ‘white’ type C. argus was in the middle (0.301–0.505). The nucleotide diversity (Pi) and average nucleotide differential number (K) of ‘bicolor’ type C. argus (Pi: 0.00066–0.00326, K:0.598–2.955) were higher than ‘white’ type C. argus (Pi: 0.00033–0.00057, K:0.321–0.521). The Tajima’s D values showed that all the populations did not significantly deviate from neutral (p > 0.05).
Table 1. Genetic diversity parameters of two color morphs C. argus.
Genetic differentiation
The fixation indexes (FST) of ‘white’ type C. argus ranged from −0.00571 to 0.07261 (, above diagonal), and that in ‘bicolor’ type C. argus was higher (0.21902–0.85314). The FST among the three ‘white’ type C. argus populations was not significant (p > 0.05); but was significant among ‘bicolor’ type C. argus populations and between the two color morphs of C. argus (p < 0.001). The gene flow (Nm) values among ‘bicolor’ type C. argus were less than 1, and the Nm absolute values among ‘white’ type C. argus were more than 1 (, below diagonal).
Table 2. Nm (below diagonal) and FST (above diagonal) of two color morphs C. argus.
Phylogenetic relationship analysis
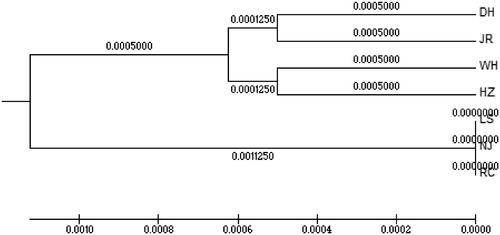
The phylogenetic tree was inferred from these sequences using the Bootstrap method of UPGMA and MEGA 5.2 software. Two independent branches are shown in ; All the three ‘white’ type C. argus populations were clustered in one independent branch, and the genetic distance was very close.
Figure 2. UPGMA tree of two color morphs C. argus.
Haplotype network analysis
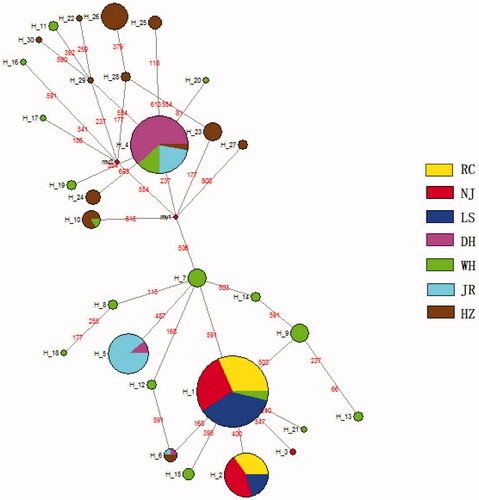
The median joining (MJ) network was constructed for the identified 30 haplotypes (). Only three haplotypes (Hap1, Hap2, and Hap3) existed in the three ‘white’ type C. argus populations; Hap1 and Hap2 were the dominant haplotypes in all the ‘white’ type C. argus populations, and Hap2 was not present in ‘bicolor’ type C. argus.
Figure 3. Haplotypes network of two color morphs C. argus.
Discussion
Haplotype diversity and nucleotide diversity are important indicators of population genetic variation (Wang et al. Citation2021). According to the range of Hd and Pi proposed by Grant and Bowen (Citation1998), Hd < 0.5 and Pi < 0.005 showed slight genetic divergence across. In this study, the NJ ‘white’ type C. argus population (Hd = 0.505), the WH and HZ ‘bicolor’ type C. argus populations (Hd = 0.911, Hd = 0.851, respectively) showed higher haplotype diversity, and the other populations showed lower haplotype diversity (Hd < 0.5). The nucleotide diversity in all the two color morphs of C. argus was low (Pi < 0.005), indicating slight genetic divergence across. However, the Pi and K of ‘bicolor’ type C. argus (Pi: 0.00066–0.00326, K: 0.598–2.955) were higher than that in ‘white’ type C. argus (Pi: 0.00033–0.00057, K: 0.321–0.521); the genetic diversity level of ‘white’ type C. argus populations was lower than ‘bicolor’ type C. argus populations. Few new parents introduced, thus decreasing the population genetic diversity. The lower genetic diversity is less tolerant to environmental stress (Zhou et al. Citation2017); the adaptive ability of ‘white’ type C. argus populations to the environment is weaker than that of ‘bicolor’ type C. argus populations.
Fst is an important indicator of genetic differentiation among populations, 0 < Fst < 0.05 indicates no differentiation; 0.05 < Fst < 0.15 indicates moderate differentiation; 0.15 < Fst < 0.25 indicates high differentiation (Wang et al. Citation2021). In this study, the Fst of four ‘bicolor’ type C. argus populations was 0.21902–0.85314 (p < 0.01); moderate differentiation was observed between the WH and JR populations (Fst = 0. 21902, 0.15 < Fst < 0.25); high differentiation was observed among the other ‘bicolor’ type C. argus populations (Fst was 0.25562 to 0.85314, Fst > 0.25), indicating that the alleles on mitochondrial DNA D-loop region were differentiated and fixed in four ‘bicolor’ type C. argus populations. The Fst of three ‘white’ type C. argus populations was −0.00571, 0.01909, and 0.07261 (p > 0.05); no significant differentiation was observed among the ‘white’ type C. argus populations. Nm < 1 between populations indicates that the population might be differentiated due to genetic drift; Nm > 1 indicates that the level of gene flow between populations was higher, and the genetic differentiation between populations was smaller (Wang et al. Citation2021). In this study, the values of Nm among the four ‘bicolor’ type C. argus populations were less than 1, indicating that geographic isolation had completely hindered the gene exchange of the four populations, but the absolute values of Nm among the three ‘white’ type C. argus populations were more than 1, indicating that the level of gene flow among those populations was high.
Genetic distance can be used to analyze the degree of genetic differentiation among different populations. The UPGMA phylogenetic tree indicated that a closer relationship was maintained in the ‘white’ type C. argus populations. The MJ network showed that the haplotype number in ‘white’ type C. argus was 10% of all the haplotypes; the genetic diversity of ‘white’ type C. argus was less than ‘bicolor’ type C. argus. The results of this study showed that the genetic diversity of ‘white’ type C. argus populations was relatively low. Therefore, attention should be paid to protecting the genetic diversity of ‘white’ type C. argus and to avoid inbreeding.
In this study, the genetic diversity and population structure were evaluated based on the complete sequences of mitochondrial DNA D-loop region for three cultured ‘white’ type C. argus populations and four ‘bicolor’ type C. argus populations, providing a theoretical basis for breeding, fishery resource protection, and sustainable development of C. argus. However, the genetic diversity and population structure of wild ‘white’ type C. argus populations were not analyzed in this study, and the genetic background could not be completely revealed. The studies should continue to use the mitochondrial DNA D-loop region of wild ‘white’ type C. argus populations to completely reveal the genetic background of ‘white’ type C. argus and to provide a theoretical basis for fishery resource protection in the future.
Author contributions statement
Wei Fan and Lu Zhang, Conceptualization, Data analysis and interpretation, Writing original draft, Writing review and revising; Su Jian, Yu Luo, and Xiao-Lei Jiao, Conceptualization, Data analysis, Validation, Writing review and editing; Zhi-Peng Huang, Han Zhao, and Zhong-Meng Zhao, Data curation, Data analysis, Writing review and editing; Yuan-Liang Duan, Qiang Li, and Jun Du, Formal analysis, Writing review and editing; Ting Zhuo, Quan-Sen Su, and Jun Wu, Conceptualization, Writing review and revising; Jian Zhou, Conceptualization, Data curation, Supervision, Funding acquisition, Writing original draft, Revising it critically for intellectual content; and the final approval of the version to be published; and that all authors agree to be accountable for all aspects of the work.
Ethical statement
This study was approved by the Institutional Animal Care and Use committee of the Neijiang Academy of Agricultural Sciences, Neijiang, Sichuan, China, under permit no. NAS-S20210501. All experiments were carried out in accordance with the Guide for the Care and Use of Experimental Animals of China.
Disclosure statement
The authors declare no conflicts of interest.
Data availability statement
The data that support the findings of this study were available in figshare at https://doi.org/10.6084/m9.figshare.14872083. The sequence data that support the findings of this study are openly available in GenBank of NCBI at (https://www.ncbi.nlm.nih.gov/) under the accession no. MZ450074-MZ450103.
Additional information
Funding
References
- Chen SH, Qu YJ, Li JE. 2011. Fish mitochondrial DNA and its research progress. Biotechnol Bull. 3:13–20.
- Das G. 2020. Genetic diversity and population structure of endangered Indian catfish, Clarias magur as revealed by mtDNA D-loop marker. Turk J Fish Aquat Sci. 21:09–18.
- Deng XX, Lei L, Yang HL, He Y, Wu J, Su J, Chao GX, Li Y, Lv GJ, Zhou CW. 2019. Effects of different storage temperature and time on muscle quality and nutrient composition of Ophicephalus argus. Food Ferment Ind. 45(14):170–176.
- Dong XP, Mu SM, Zhou N, Du XJ, Bai JJ. 2014. Genetic diversity of mitochondrial DNA D-Loop sequences of Channa argus Baiyangdian. J Hebei Univ (Nat Sci Ed). 34:201–206.
- Grant WAS, Bowen BW. 1998. Shallow population histories in deep evolutionary lineages of marine fishes: insights from sardines and anchovies and lessons for conservation. Journal of Heredity. 89(5):415–426. doi:https://doi.org/10.1093/jhered/89.5.415.
- Kimura S. 1934. Description of the fishes collected from the Yangtzekiang, China by the late Dr. K. Kishinouye and his party in 1927-1929. J Shanghai Sci Inst Sect. 3:11–247.
- Li Z, Xiang KH, Zou YC, Yue XJ, Wang YM, Qin CJ, Xie BW, Wang Y, Qi ZM. 2016. Analysis on karyotype and DNA content of Opniocepnalus argus. Freshwater Fish. 46:104–108.
- Liu N, Fu JJ, Dong ZJ, Zhu WB, Wang LM, Su SY, Song FB, Chen XT. 2017. Genetic variation analysis of mtDNA D-loop sequence in six Chinese carp populations. J Hydroecol. 38:75–82.
- Liu RQ. 1997. The breeding of Opniocepnalus argus var fry and fingerling. Livestock and Poultry industry. 000:66.
- Mou CY, Ren SJ, Qiao GX, Suo H. 2014. Prevention and treatment of Nocardia disease in Opniocepnalus argus: a case report. Sci Fish Farm. 3:65.
- Peng M, Wang DP, Shi J, Han YQ, Lei JJ, Li YS, Wu WJ, He AY. 2020. Genetic diversity analysis of mitochondrial D-loop sequence of Curleostomus in the Xijiang River Basin. Adv Fish Sci. 41:30–37.
- Polzin T, Daneshmand SV. 2003. On Steiner trees and minimum spanning trees in hypergraphs. Oper Res Lett. 31(1):12–20.
- Rozas J, Sanchez-DelBarrio JC, Messeguer X, Rozas R. 2003. DnaSP, DNA polymorphism analyses by the coalescent and other methods. Bioinformatics. 19(18):2496–2497.
- Su J, Luo Y, Su QS, Jiao XL, Yang H, Wu J, Fan W. 2018. Key techniques for high yield, high efficiency and healthy aquaculture of Opniocepnalus argus. Sci Fish Farm. 3:44–45.
- Su J, Wu J, Jiao XL, Luo Y, Su QS, Yang H, Fan W. 2019. A new ecological culture model of Opniocepnalus Argus in rice field. Sci Breed Fish. 7:38–39.
- Su SQ, Xiong B. 2001. Experiment on artificial breeding of Opniocepnalus argus. Water Fish. 21:19–20.
- Tamura K, Peterson D, Peterson N, Stecher G, Nei M, Kumar S. 2011. MEGA5: molecular evolutionary genetics analysis using maximum likelihood, evolutionary distance, and maximum parsimony methods. Mol Biol Evol. 28(10):2731–2739.
- Thompson JD, Gibson TJ, Plewniak F, Jeanmougin F, Higgins DG. 1997. The CLUSTAL_X Windows interface: flexible strategies for multiple sequence alignment aided by quality analysis tools. Nucleic Acids Res. 25(24):4876–4882.
- Wang XX, Zhao XF, Zhou CW, Liao ZG. 1992. Comparative study on the Ophiocephalus argus and Channa argus. Trans Oceanol Limnol. 2:51–57.
- Wang Y, Mou CJ, Zhu SR, Duan FW, Liu SQ. 2020. Cultivation technology of factory Ophiocephalus Argus seedlings. Aquaculture. 41:54–55.
- Wang YJ, Lu JH, Liu Z, Zhang JP. 2021. Genetic diversity of Gymnocypris chilianensis (Cypriniformes, Cyprinidae) unveiled by the mitochondrial DNA D-loop region. Mitochondrial DNA B Resour. 6(4):1292–1297.
- Wu J, Su J, Zhu CK, Lv GJ, Zhen ZL, Deng XX, Lei L. 2018. Prevention and control of small melon worm disease in Opniocepnalus Argus. Chongqing Aquat. 11:50–51.
- Xiao MS, Cui F, Kang J, Zhang XH. 2013. Genetic structure and variation of wild Ophicephalus argus cantor from Huaihe River based on MtDNA D-loop sequences. J Central China Norm Univ (Nat Sci). 47:82–90.
- Zhai ZH, Chen XN, Wang J. 2008. Primer design with primer Premier 5.0. Northwest Med Educ. 16:695–698.
- Zhou AG, Sun D, Liu SL, Feng YY, Zhang Y, Chen YF, Xie SL, Zo JX. 2021. The species identity of the two color morphs of northern snakehead (Channa argus) based on mtDNA control region sequences. PJZ. 53(4):1–4.
- Zhou CW, Lei L, Deng XX, Zheng ZL, Zheng YH, Wu J, Su J, Fan W, Cao GX, Li Y. 2018. Nutritional composition analysis and evaluation of Ophicephalus argus and Opniocepnalus argus var. Freshwater Fish. 48:83–89.
- Zhou W, Gao TX, Wang J, Song L. 2017. Genetic diversity and structure analysis based on the mitochondrial DNA control region of the northern snakehead (Channa argus). J Fish China. 40:1521–1532.