
Abstract
The jack silverside (Atherinopsis californiensis), also referred to as jacksmelt, is a neotropical silverside fish that inhabits nearshore shallow waters of the California Current Ecosystem in the Northeast Pacific Ocean, ranging from the coast of Oregon, USA, in the north to as far south as Baja California, Mexico. This fish is the sole member of its genus and is a commonly taken species when hook-and-line fishing in pelagic-neritic environments including bays, estuaries, kelp forests, and along sand beaches. Here we report the first complete mitochondrial genome of jack silverside consisting of 16,519 bp nucleotides and encoding 13 protein-coding regions, 12S and 16S rRNAs, 22 tRNAs, and an 841 bp D-loop control region. Phylogenetic analysis using all protein-coding genes of the complete mitogenome confirmed the inclusion of A. californiensis within subfamily Atherinopsinae of family Atherinopsidae, order Atheriniformes. This complete mitochondrial DNA genome will be of use for biodiversity assessments in the California Current ecosystem, while also providing a foundation for future mtDNA population genetic studies on this prominently caught species in shore- and pier-based recreational sport fishing.
Introduction
The jack silverside (Atherinopsis californiensis, Girard, 1854) – also commonly referred to as ‘jacksmelt’ – is a pelagic schooling fish that reaches up to ∼20 cm in length and lives for 9–10 years (Clark Citation1929). A. californiensis ranges from Yaquina Bay, Oregon in the Pacific Ocean to as far south as Bahía Magdalena, Baja California Sur, Mexico (De La Cruz-Agüero et al. Citation1994). This species is generally considered to be omnivorous and consumes a broad range of food types (Barry et al. Citation1996; Horn et al. Citation2006; Higgins and Horn Citation2014). That versatility in diet allows both adult and juvenile A. californiensis to occupy a variety of open shallow water habitats, typically ranging in depths from approximately 1.5–15 m, from within and beyond the surf zone along sand beaches to estuaries and kelp forests (Horn Citation1979; Allen and Pondella Citation2006). With a nearshore distribution, A. californiensis is commonly caught by recreational sport anglers fishing from boats or shore (Ono Citation1982; Hill and Schneider Citation1999; Jarvis et al. Citation2004).
Materials
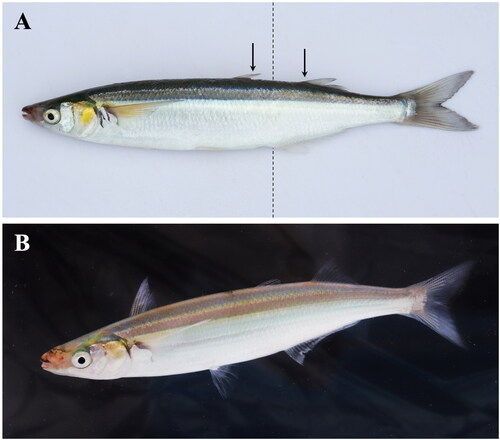
Here we report the first complete mitochondrion DNA genome for A. californiensis. Skeletal muscle tissue was dissected from an adult jack silverside () (mass: 216.49 g; standard length: 25.8 cm; total length: 30.9 cm) collected on 21 September 2018 from Estero Bay near Cayucos, California, USA (35.445556 N, 120.908056 W). A sample of that tissue has been archived in the collections of the Natural History Museum of Los Angeles County, Los Angeles, California, USA (Dr. William Ludt, Assistant Curator, Ichthyology: [email protected]) under tissue no. LACM T-001462.
Figure 1. Photos of the jack silverside, Atherinopsis californiensis. (A) Jack silverside, commonly also called jacksmelt, belongs to the family of silversides (family Atherinopsidae) and not the taxon of ‘true’ smelts (family Osmeridae). Jack silverside are distinguished from another morphologically similar species – the topsmelt silverside (Atherinops affinis) – by the anterior edge of the anal fin (dotted line) being positioned between the posterior edge of the first dorsal fin and anterior boundary of the second dorsal fin (arrows). (B) Adult jack silverside showing the typical yellow color on the gill operculum, with positioning of the two dorsal fins stretched upright. Photos by Sean Lema.
Methods
DNA was extracted from the skeletal muscle using the DNeasy Blood and Tissue Kit (Qiagen, Valencia, CA), analyzed for quality and quantity both fluorometrically (Qubit 2.0 Fluorometer, Life Technologies, Carlsbad, CA) and by gel electrophoresis. DNA was then fragmented into a ∼350 bp library (Illumina Nextera DNA Flex Library Prep kit) and sequenced on the Illumina NovaSeq 6000 System (Novogene, Sacramento, CA) to generate ∼125 million 150 bp PE reads (GenBank BioSample no. SAMN27483993, Run Sequence Read Archive no. SRR18689888). Raw read quality was evaluated using FastQC version 0.11.9 (Andrews Citation2010). Raw 150 bp sequences were then assembled into a complete mitogenome using SMART2 (Alqahtani and Mandoiu Citation2020) using a partial sequence of the A. californiensis cytochrome b (cytb) gene (GenBank accession no. JQ282018; Bloom et al. Citation2012) as the ‘seed sequence’ for mitogenome assembly. SMART2 assembly generated a 16,519 bp nucleotide complete mitogenome from 400,000 of the raw 150PE sequences (median coverage depth: 26X). The complete mitogenome was subsequently confirmed in Galaxy version 21.09 (https://usegalaxy.org/) by going back to the raw 150 bp reads and conducting a separate alignment of those reads to the mitogenome assembled from the SMART2 pipeline. For that confirmational assembly, sequencing adaptors were first trimmed from the raw reads using fastp (Chen et al. Citation2018), and the trimmed sequences were aligned to the SMART2-generated mitogenome using Bowtie2 (Langmead and Salzberg Citation2012). Trimmed sequences that aligned to the SMART2 mitogenome were then downloaded and reassembled in Sequencher version 5.4.6 software (GeneCodes Corp., Ann Arbor, MI) for final confirmation of the complete mitogenome sequence. The resulting mitogenome was annotated using MitoFish (Iwasaki et al. Citation2013; Sato et al. Citation2018).
To confirm evolutionary relationships of A. californiensis, a maximum-likelihood phylogenetic tree was constructed using all amino acid coding sequence (CDS) regions concatenated from the mitogenomes of A. californiensis and eleven other fishes of Order Atheriniformes. Sequences were aligned using Clustal X software (Larkin et al. Citation2007), and the tree was constructed using all sites with pairwise gap deletion in MEGA version 11 (Tamura et al. Citation2021). Percent confidence values for each node were calculated from 1000 bootstrap replicates. The tree was rooted using the complete mitogenome from the Northern Anchovy, Engraulis mordax (MH613715) (Lewis and Lema Citation2019).
Results
The 16,519 bp complete mitogenome of jack silverside (GenBank accession no. ON310810) contains 13 protein-coding genes, 22 tRNAs, and 12S and 16 rRNAs in the typical arrangement of mitochondrial genes for actinopterygian fishes (). Of the 13 protein-coding genes, only nd6 was encoded on the light strand (L-strand), and all others were found on the heavy strand (H-strand) (). Similarly, eight of the tRNA genes (tRNAGln, tRNAAla, tRNAAsn, tRNACys, tRNATyr, tRNASer, tRNAGlu, and tRNAPro) were located on the L-strand, while the other 14 tRNAs and both rRNAs were positioned on the H-strand. Overall nucleotide composition of the mitogenome had a GC content of 46.63% composed of the following: A, 26.24%; T, 27.13%; G, 17.34%; and C, 29.29%.
Figure 2. Circular sketch map of the complete mitogenome of the jack silverside Atherinopsis californiensis. Positions of amino acid coding sequence (CDS) genes, rRNAs, and tRNAs are indicated, as is GC nucleotide composition variation. Visualization generated using the Proksee server (https://proksee.ca/), which utilizes GCView (Stothard and Wishart Citation2005) for circular genome drawing.
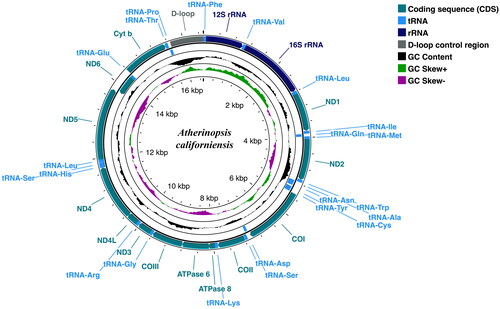
Table 1. Location and arrangement of genes on the mitogenome of A. californiensis.
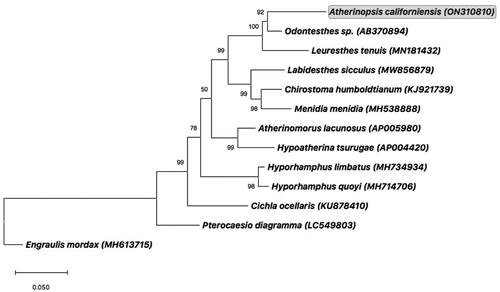
Phylogenetic analysis of protein-coding genes confirmed that A. californiensis belongs to the clade of Neotropical silverside fishes of subfamily Atherinopsinae, family Atherinopsidae (). That phylogenetic arrangement corroborated the close relationship of A. californiensis to California grunion (Leuresthes tenuis) (Muñoz et al. Citation2020), which agrees with the relationship of A. californiensis to Leuresthes fishes observed previously using allozyme variation (Crabtree Citation1987).
Figure 3. Consensus maximum-likelihood phylogenetic tree of the complete mitogenome of jack silverside Atherinopsis californiensis (GenBank accession no. ON310810; shown in grey box) and other fishes of Order Atheriniformes. GenBank accession numbers are provided in parentheses accompanying each taxon. The tree was rooted using the complete mitogenome from the Northern Anchovy, Engraulis mordax (Lewis and Lema Citation2019). Additional information on previously published complete mitogenomes for the following species used in this phylogenetic analysis can be found as follows: Odontesthes sp. (AB370894) (Setiamarga et al. Citation2008); Leuresthes tenuis (MN181432) (Muñoz et al. Citation2020); Chirostoma humboldtianum (KJ921739) (Barriga-Sosa et al. Citation2016); Menidia menidia (MH538888) (Lou et al. Citation2018); Hypoatherina tsurugae (AP004420) (Miya et al. Citation2003); Hyporhamphus limbatus (MH734934) (Lü et al. Citation2018); Hyporhamphus quoyi (MH714706) (Zhu et al. Citation2018), and Cichla ocellaris (KU878410) (Lin et al. Citation2017).
Discussion and conclusion
Although A. californiensis has received little research attention due to the species not being a target of commercial fisheries, A. californiensis is commonly caught in nearshore saltwater recreational sport fishing and is regularly consumed (Jarvis et al. Citation2004). The complete mitochondrial genome for A. californiensis reported here supports the evolutionary relationships of this species within subfamily Atherinopsinae, family Atherinopsidae, and provides a foundation for future assessments to fill a data gap on the population structure and genetic diversity of A. californiensis across its geographic range. Studies into how fishing and climate change are affecting marine fish biodiversity in the California Current Ecosystem are increasingly utilizing environmental DNA (eDNA) and other high throughput DNA sequencing approaches (e.g. Closek et al. Citation2019; Stat et al. Citation2019). The cytochrome oxidase I (coi) sequence from this new mitogenome and other sequences from A. californiensis (e.g. KM019227-KM019229) show >7% nucleotide sequence divergence compared to topsmelt silverside Atherinops affinis (OL806589-OL806590), the closest relative of A. californiensis, and ∼10% divergence with California grunion (L. tenuis, MN181432), indicating coi is a viable target for distinguishing these species in large-scale, DNA-based studies in the California Current Ecosystem.
Author’s contributions
Janae Shew and Sean Lema jointly designed the project, conducted DNA extraction and sequence analyses, and drafted and edited the manuscript. Both authors approved all aspects of the presented work and the final version of this manuscript.
Acknowledgments
Fish were collected with permission of the California Department of Fish and Wildlife (Permit # SC-13413). The authors thank Sylvie Lema, Nicholas Vu, and Steve Henricks for assistance with fish collection, and Dr. William Ludt of the Los Angeles Museum of Natural History for archiving tissue from the specimen. The authors also thank three anonymous reviewers for suggestions that improved the quality of this article.
Disclosure statement
The authors report no conflicts of interest and are alone responsible for the content and writing of this manuscript.
Data availability
The mitochondrion genome sequence data that support the findings of this study are openly available in GenBank of the National Center for Biotechnology Information (NCBI) at https://www.ncbi.nlm.nih.gov/ under accession no. ON310810. Raw 150PE reads generated by the authors to assemble this mitogenome are available under GenBank BioProject no. PRJNA824876, BioSample no. SAMN27483993, and Run Sequence Read Archive no. SRR18689888.
Additional information
Funding
References
- Allen LG, Pondella II, DJ. 2006. Surf zone, coastal pelagic zone, and harbors. In: Allen LG, Pondella II, DJ, Horn MH, editors. The ecology of marine fishes: california and adjacent waters. Berkeley, (CA): University of California Press; p. 149–166.
- Alqahtani F, Mandoiu I. 2020. SMART2: multi-library statistical mitogenome assembly with repeats. In: Mandoiu I, Murali T, Narasimhan G, Rajasekaran S, Skums S, Zelikovsky A, editors. Computational advances in bio and medical sciences. Lecture notes in bioinformatics. Vol. 12029. Cham, Switzerland: Springer.
- Andrews S. 2010. FastQC: a quality control tool for high throughput sequence data. https://www.bioinformatics.babraham.ac.uk/projects/fastqc/.
- Barriga-Sosa IDLA, García De León FJ, Del Río-Portilla MA. 2016. The complete mitochondrial DNA of the endemic shortfin silverside, Chirostoma humboldtianum (Valenciennes, 1835). Mitochondrial DNA A DNA Mapp Seq Anal. 27(2):1545–1546.
- Barry JP, Yoklavich MM, Cailliet GM, Ambrose DA, Antrim BS. 1996. Trophic ecology of the dominant fishes in Elkhorn Slough, California, 1974–1980. Estuaries. 19(1):115–138.
- Bloom DD, Unmack PJ, Gosztonyi AE, Piller KR, Lovejoy NR. 2012. It’s a family matter: molecular phylogenetics of Atheriniformes and the polyphyly of the surf silversides (Family: notocheiridae). Mol Phylogenet Evol. 62(3):1025–1030.
- Chen S, Zhou Y, Chen Y, Gu J. 2018. Fastp: an ultra-fast all-in-one FASTQ preprocessor. Bioinformatics. 34(17):i884–i890.
- Clark FN. 1929. Fish Bulletin No. 16: the life history of the California jack smelt, Atherinopsis californiensis. Division of Fish and Game of California. 23 p.
- Closek CJ, Santora JA, Starks HA, Schroeder ID, Andruszkiewicz EA, Sakuma KM, Bograd SJ, Hazen EL, Field JC, Boehm AB. 2019. Marine vertebrate biodiversity and distribution within the central California Current using environmental DNA (eDNA) metabarcoding and ecosystem surveys. Front Mar Sci. 6:732.
- Crabtree CB. 1987. Allozyme evidence for the phylogenetic relationships within the silverside subfamily Atherinopsinae. Copeia. 1987(4):860–867.
- De La Cruz-Agüero J, Galvan-Magana F, Abitia-Cardenas LA, Rodriquez-Romero J, Gutierrez-Sanchez FJ. 1994. Systematic list of marine fishes from Bahia Magdalena, Baja California Sur (Mexico). Ciencias Mar. 20:17–31.
- Higgins BA, Horn MH. 2014. Suction among pickers: jaw mechanics, dietary breadth and feeding behaviour in beach-spawning Leuresthes spp. compared with their relatives. J Fish Biol. 84(6):1689–1707.
- Hill KT, Schneider N. 1999. Historical logbook databases from California’s commercial passenger fishing vessel (partyboat) fishery, 1936–1997. San Diego (CA): University of California, Scripps Institution of Oceanography Ref. Ser. No. 99–19.
- Horn MH, Gawlicka AK, German DP, Logothetis EA, Cavanagh JW, Boyle KS. 2006. Structure and function of the stomachless digestive system in three related species of New World silverside fishes (Atherinopsidae) representing herbivory, omnivory, and carnivory. Mar Biol. 149(5):1237–1245.
- Horn MH. 1979. Diel and seasonal variation in abundance and diversity of shallow-water fish populations in Morro Bay. California Fish Bull. 78:759–770.
- Iwasaki W, Fukunaga T, Isagozawa R, Yamada K, Maeda Y, Satoh TP, Sado T, Mabuchi K, Takeshima H, Miya M, et al. 2013. MitoFish and MitoAnnotator: a mitochondrial genome database of fish with an accurate and automatic annotation pipeline. Mol Biol Evol. 30(11):2531–2540.
- Jarvis ET, Allen MJ, Smith RW. 2004. Comparison of recreational fish Catch trends to environment-species relationships and fishery-independent data in the Southern California Bight, 1980–2000. California Cooperat Ocean Fish Invest Rep. 45:167.
- Langmead B, Salzberg SL. 2012. Fast gapped-read alignment with Bowtie 2. Nat Methods. 9(4):357–359.
- Larkin MA, Blackshields G, Brown NP, Chenna R, McGettigan PA, McWilliam H, Valentin F, Wallace IM, Wilm A, Lopez R, et al. 2007. Clustal W and Clustal X version 2.0. Bioinformatics. 23(21):2947–2948.
- Lewis OH, Lema SC. 2019. Sequence and phylogenetic analysis of the mitochondrial genome for the Northern Anchovy, Engraulis mordax (Engraulidae: clupeiformes). Mitochondrial DNA B Resour. 4(1):14–16.
- Lin M, Mu X, Yan X. 2017. The complete mitochondrial genome of Cichla ocellaris. Mitochondrial DNA B Resour. 2(2):620–622.
- Lou RN, Fletcher NK, Wilder AP, Conover DO, Therkildsen NO, Searle JB. 2018. Full mitochondrial genome sequences reveal new insights about post-glacial expansion and regional phylogeographic structure in the Atlantic silverside (Menidia menidia). Mar Biol. 165(8):1–18.
- Lü Z, Zhu K, Liu L, Liu B, Jiang L, Gong L. 2018. Phylogenetic analysis of the complete mitochondrial genome of Hyporhamphus limbatus (Beloniformes; hemiramphidae). Mitochondrial DNA B Resour. 3(2):1292–1293.
- Miya M, Takeshima H, Endo H, Ishiguro NB, Inoue JG, Mukai T, Satoh TP, Yamaguchi M, Kawaguchi A, Mabuchi K, et al. 2003. Major patterns of higher teleostean phylogenies: a new perspective based on 100 complete mitochondrial DNA sequences. Mol Phylogenet Evol. 26(1):121–138.
- Muñoz NC, Dickson KA, Walter RP. 2020. The mitogenome of the California grunion (Leuresthes tenuis). Mitochondr DNA B. 5(2):1138–1140.
- Ono DS. 1982. Southern California marine sport fishing from privately owned boats: catch and effort for January–March 1982. Marine Resources Administrative Report 82–12. Sacramento (CA): California Department of Fish and Game.
- Sato Y, Miya M, Fukunaga T, Sado T, Iwasaki W. 2018. MitoFish and MiFish pipeline: a mitochondrial genome database of fish with an analysis pipeline for environmental DNA metabarcoding. Mol Biol Evol. 35(6):1553–1555.
- Setiamarga DHE, Miya M, Yamanoue Y, Mabuchi K, Satoh TP, Inoue JG, Nishida M. 2008. Interrelationships of Atherinomorpha (medakas, flyingfishes, killifishes, silversides, and their relatives): The first evidence based on whole mitogenome sequences. Mol Phylogenet Evol. 49(2):598–605.
- Stat M, John J, DiBattista JD, Newman SJ, Bunce M, Harvey ES. 2019. Combined use of eDNA metabarcoding and video surveillance for the assessment of fish biodiversity. Conserv Biol. 33(1):196–205.
- Stothard P, Wishart DS. 2005. Circular genome visualization and exploration using CGView. Bioinformatics. 21(4):537–539.
- Tamura K, Stecher G, Kumar S. 2021. MEGA11: molecular evolutionary genetics analysis version 11. Mol Biol Evol. 38(7):3022–3027.
- Zhu K, Lü Z, Liu B, Gong L, Jiang L, Liu L. 2018. The complete mitochondrial genome of Hyporhamphus quoyi (Beloniformes; Hemiramphidae). Mitochondrial DNA B Resour. 3(2):1235–1236.