
Abstract
Albizia kalkora (Roxb.) Prain 1897, belonging to the family Fabaceae, is not only a landscape tree but also a medicinal plant. At present, few plastomes have been reported from Albizia, which delays the in-depth phylogenomic studies and the development of high-resolution discriminating markers for this genus. Herein, we sequenced the first plastome of A. kalkora by NGS technology. The genome is a circular structure (176,158 bp), containing a large single-copy (LSC) region (91,521 bp), a small copy (SSC) region (5237 bp), and two inverted repeat (IR) regions (39,700 bp each). It has 35.45% GC content and encodes 109 unique genes, which are 76 protein-coding, 4 rRNA, and 29 tRNA genes. The genetic distance analysis of the intergenic spacer regions for A. kalkora, A. odoratissima and A. bracteate shows four intergenic regions with very high K2p values, namely, ccsA-ndhD (15.04), matK-rps16 (10.77), rps11-rpl36 (17.63) and rps3-rps19 (20.08), which can discriminate the three Albizia species. In addition, we identified ten pairs of regions that could be utilized to design primers to discriminate the three Albizia species. The phylogenetic analysis showed Albizia was closely related to Samanea. The results in this study will provide valuable information to elucidate the classification, identification and evolutionary history of Albizia.
Introduction
Albizia kalkora (Roxb.) Prain 1897 is a deciduous tree or shrub with 3–8 m tall, belonging to the family Fabaceae (Legume). Its native range is in northeastern India, China North-Central, China South-Central, China Southeast, East Himalaya, Bangladesh, Japan, Korea, and Vietnam. A. kalkora trees are not only an ornamental plant, but also has medicinal value. Some of its chemical components can be used as raw materials and have potential applications in the pharmaceutical industry. Several researches on the chemical composition of A. kalkora have been reported. Leaves of A. kalkora contain a large number of chemical components, such as squalene, epinephrine, trans-squalene, stachydrine and other chemical components with high medicinal value (Hou et al. Citation2020).
To develop the valuable plant resource, we should delineate the phylogenetic relationship of the species in its family, and then develop high-resolution markers that can be used to distinguish orthodox species from other substitute and adulterant species. In morphology, the A. kalkora is similar to the A. julibrissin. Although the two species can be distinguished by some morphological characteristics, more objective data of molecular biology is helpful to distinguish these two species, especially in the case of intermediate hybridization of the two species. In previous studies, the plastome has been used for species identification, taxonomic classification, evolution investigation, and genetic engineering because of their highly conserved nature and role in monolepsis (Mariga Citation2004). However, there is no reported plastome of A. kalkora up to now. The lack of complete plastomes is severely limiting our ability to perform the phylogenomic and DNA barcoding studies of this species. In this study, we sequenced, assembled, and characterized the first complete plastome of A. kalkora, developed DNA barcodes for distinguishing Albizia species and compared the plastome with others from the tribe Ingeae of Fabaceae. The study results will lay a solid foundation for future phylogenomic study and bioprospecting of Albizia species.
Material
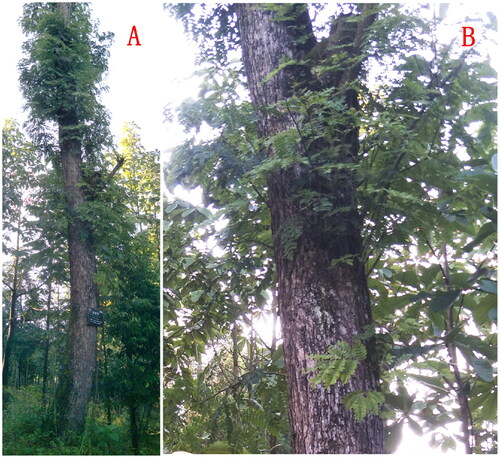
Fresh leaves of A. kalkora () were collected from Central China Medicinal Botanical Garden, EnShi, China (Geospatial coordinates: N 30.180978°, E 109.756823°). The specimen was deposited at the Institute of Medicinal Plant Development (contact person: Haimei Chen, [email protected]) under the specimen number of implad201808110. Total genomic DNA was extracted by using the plant genomic DNA kit (Tiangen Biotech, Beijing, China). The purity and the concentration of the extracted DNA was determined by using a Nanodrop spectrophotometer 2000. The extracted DNA with the ratio of OD260/OD280 between 1.8-2.0 was seen as high-quality samples and was further used to construct the DNA sequencing library.
Figure 1. Panorama (A) and detail (B) photos of Albizia kalkora. The photos were shot by Liqiang Wang and the coordinates of the plant was N 30.180978°, E 109.756823°. Main identifying traits: Trees, deciduous, 3–8 m tall. Branchlets dark brown, pubescent, with conspicuous lenticels. Stipules in-conspicuous. Pinnae 2–4 pairs. Leaflets 5–14 pairs, oblong or oblong-ovate. Heads 2–7, axillary or terminal, arranged in panicles. Flowers dimorphic, primarily white, turning yellow, with conspicuous pedicels. Calyx tubular, 2–3 mm, 5-toothed, calyx and corolla villous. Corolla 6–8 mm; lobes lanceolate. Stamens 2.5–3.5 cm, basally connate into a tube; tube shorter than corolla tube. Seeds 4–12, obovoid or suborbicular; pleurogram oblong.
Methods
The sequencing library with an insert size of 350 bp fragments was constructed and sequenced by using the Illumina HiSeq 2500 platform. The obtained 2 × 350 reads were filtered by the software to obtain high-quality reads (Bolger et al. Citation2014). The high-quality reads were used to assemble the plastome sequence by using NOVOPlasty (v4.2) (Nicolas et al. Citation2017) with matK (GenBank: APA32793.1) as a seed sequence. The CpGAVAS2 web service (Shi et al. Citation2019) was utilized to annotate the plastome with the dataset of “43-plastomes Reference Dataset”. And the plastome was visualized as a circular map by using CPGview-RSG (http://www.herbalgenomics.org/cpgview/). Finally, the plastome annotation results were deposited in the GenBank under accession number MW420923.
The plastomes of A. kalkora and other 13 reported plastomes of Fabaceae (tribe Ingeae) were downloaded from the GenBank database for the phylogenetic analysis. The plastome of Pterolobium punctatum was selected as an outgroup. Then the shared CDS sequences of the 15 plastomes were extracted and concatenated by the PhyloSuite (v 1.1.16) (Zhang et al. Citation2020) and were aligned by the MAFFT (v 7.313) (Katoh and Standley Citation2013) with default parameter of “–auto”. Phylogenetic analysis was carried out based on maximum likelihood (ML) model implemented in the IQ-TREE (v 1.6.8) (Nguyen et al. Citation2015) under the TVM + F + I + G4 nucleotide substitution model. The significance level for the phylogenetic tree was evaluated by bootstrap testing with 1000 replications. To discriminate the Albizia species, potential DNA barcoding markers were identified by using the ecoPrimers software (Tiayyba et al. Citation2011).
Results
The plastome of A. kalkora is 176,158 bp in size with a large single copy (LSC) region of 91,521 bp, a small copy (SSC) region of 5237 bp and two inverted repeats (IRa and IRb) regions of 39,700 bp by each (). The reliability of genome assembly was strongly supported by the results of mapping experiment (Figure S1). The length of the protein-coding sequence in the plastome of A. kalkora is 88,494 bp, representing 50.24% of the total genome length (Table S1). In contrast, the length of the ribosomal RNA (rRNA) and transfer RNA (tRNA) genes is 9242 bp and 2725 bp, representing 5.25% and 1.55% of the total genome length (Table S1). The GC content analysis showed that the overall GC content of the whole plastome is 35.45% (Table S1). The GC content of the IR region (38.66%) is greater than that of the SSC region (28.55%) and that of the LSC region (33.06%) (Table S1).
Figure 2. Circular map of overall features of the Albizia kalkora plastome. The map contains six tracks in default. From the center outward, the first track shows the dispersed repeats. The dispersed repeats consist of direct (D) and Palindromic (P) repeats, connected with red and green arcs. The second track shows the long tandem repeats as short blue bars. The third track shows the short tandem repeats or microsatellite sequences as short bars with different colors. The colors, the type of repeat they represent, and the description of the repeat types are as follows. Black: c (complex repeat); Green: p1 (repeat unit size = 1); Yellow: p2 (repeat unit size = 2); Purple: p3 (repeat unit size = 3); Blue: p4 (repeat unit size = 4); Orange: p5 (repeat unit size = 5); Red: p6 (repeat unit size = 6). The small single-copy (SSC), inverted repeat (IRa and IRb), and large single-copy (LSC) regions are shown with their length on the fourth track. The GC content along the genome is plotted on the fifth track. The genes are shown on the sixth track. The optional codon usage bias is displayed in the parenthesis after the gene name. Genes are color-coded by their functional classification. The transcription directions for the inner and outer genes are clockwise and anticlockwise, respectively. The functional classification of the genes is shown in the bottom left corner.
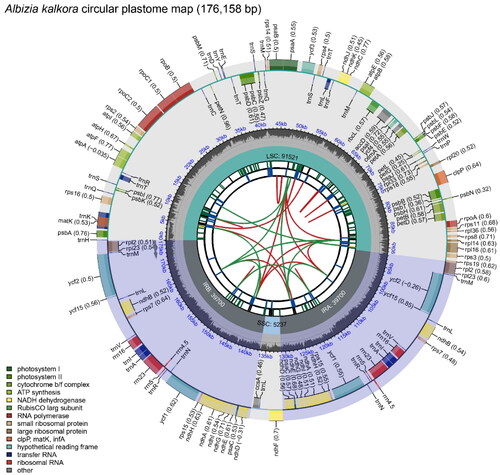
We detected 109 unique genes in the A. kalkora plastome (Table S2), including 76 protein-coding genes (PCGs), 4 rRNA genes, and 29 tRNA genes. Fifteen PCGs (rps15, rps7, rpl2, rpl23, ndhA, ndhB, ndhD, ndhE, ndhG, ndhH, ndhI, psaC, ycf1, ycf15 and ycf2), 7 tRNA genes (trnA-UGC, trnE-UUC, trnL-CAA, trnM-CAU, trnN-GUU, trnR-ACG and trnV-GAU) and 4 rRNA genes (rrn16S, rrn23S, rrn4.5S, rrn5S) are located at the IR regions. Among these genes, 9 PCGs (rps16, atpF, rpoC1, petD, petB, rpl16, rpl2, ndhB, and ndhA) contain one intron, 2 PCGs (ycf3 and clpP) contain 2 introns, and 6 tRNA genes (trnK-UUU, trnT-CGU, trnL-UAA, trnC-ACA, trnE-UUC and trnA-UGC) contain 1 intron. The structures of the cis-splicing PCG genes were shown in Figure S2.
To investigate the plastomic divergence of Albizia species, we conducted a genetic distance analysis of intergenic spacer regions for the plastomes of A. kalkora, A. odoratissima and A. bracteate. The result showed that four intergenic spacer regions had very high K2p values, namely, ccsA-ndhD (15.04), matK-rps16 (10.77), rps11-rpl36 (17.63) and rps3-rps19 (20.08) (Figure S3), indicating a high variation among the three Albizia species. In addition, we identified ten pairs of regions that could be utilized to design primers to discriminate the three Albizia species (), which were mainly from intergenic regions, indicating the high practicability of intergenic regions in distinguishing relatively close species as DNA barcodes.
Table 1. Potential regions to design PCR primers for the discrimination of Albizia odoratissima (KX852437), A. bracteata (MN709837) and A. kalkora (MW420923).
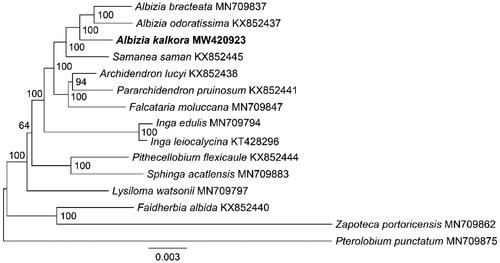
The plastome provides valuable resources for the phylogeny research of angiosperms. Here, we carried out an ML phylogenetic analysis for the 14 species belonging to the tribe Ingeae (Fabaceae). The phylogenetic tree showed the three Albizia species were clustered together (), consistent with the expected relationships. The relationship between A. odoratissima and A. bracteate was the closest. Furthermore, the Albizia species were most closely related to Samanea species with a bootstrap value of 100. The topological structure of the ML tree was tested using Shimodaira-Hasegawa (SH) (Shimodaira and Hasegawa Citation1999) and proximately unbiased (AU) (Shimodaira Citation2002) methods embedded in IQ-TREE. The topological structure of the ML tree was reliable with p-SH and p-AU values of 0.504 and 0.511 respectively.
Figure 3. The phylogenetic tree of 14 Ingeae species and the outgroup of Pterolobium punctatum. The tree was constructed with sequences of 77 shared CDS sequences present in all 15 species using the maximum likelihood method. The 15 species were Albizia bracteate (MN709837) (Zhang et al. Citation2020), A. odoratissima (KX852437) (Huan et al. Citation2017), A. kalkora (MW420923, new plastome in this study), Samanea saman (KX852445) (Huan et al. Citation2017), Archidendron lucyi (KX852438) (Huan et al. Citation2017), Pararchidendron pruinosum (KX852441) (Huan et al. Citation2017), Falcataria moluccana (MN709847) (Zhang et al. Citation2020), Inga edulis (MN709794) (Zhang et al. Citation2020), Inga leiocalycina (KT428296) (Dugas et al. Citation2015), Pithecellobium flexicaule (KX852444) (Huan et al. Citation2017), Sphinga acatlensis (MN709883) (Zhang et al. Citation2020), Lysiloma watsonii (MN709797) (Zhang et al. Citation2020), Faidherbia albida (KX852440) (Huan et al. Citation2017), Zapoteca portoricensis (MN709862) (Zhang et al. Citation2020) and Pterolobium punctatum (MN709875, outgroup) (Zhang et al. Citation2020). The scale of the scale bar represents a substitution frequency of 0.003 for each site base of the shared CDS sequences. Bootstrap supports were calculated from 1000 replicates. The A. kalkora was labeled by bold font in the phylogenetic tree.
Discussion and conclusion
The present study provided useful information for species identification, genetic diverse analysis, and phylogenetic analysis of A. kalkora. However, several limitations still exist in the study. For instance, the distinguishing ability of the DNA barcodes has not been validated extensively because only three complete Albizia plastomes are available at this time. As mentioned earlier, A. kalkora is similar to A. julibrissin, the two species could be distinguished when the plastome of A. julibrissin is reported. In the future, we will plan to collect more Albizia samples for validating the reliability of the developed DNA barcodes and deeply study the phylogenetics of Albizia genus.
In this study, the complete plastome of A. kalkora was sequenced and assembled for the first time. The structure of the plastome was typical tetrad structure. Its length was 176,158 bp and contained 109 unique genes. Ten regions from highly varied intergenic regions could be used to design primers to provide potential DNA barcodes for discriminating Albizia species. Finally, the phylogenetic analysis indicated that Albizia species were clustered together, which were most closely related to Samanea species. The results of this study will provide valuable information to elucidate the classification, identification, and evolutionary history of Albizia.
Ethical statement
All samples in this study were collected with the permission from the Central China Medicinal Botanical Garden, EnShi, China. This study complies with relevant institutional, national, and international guidelines and legislation.
Authors’ contributions
The manuscript includes contributions of all authors. CL conceived the study; MJ and LQW collected the sample of Albizia kalkora; HMC and LQW extracted DNA for next-generation sequencing; SHS and SYL assembled the genome, drafted the manuscript, and performed literature research; BW and QD performed the statistics of the gene content and analyzed the genome structure; HYY and YL annotated the plastome, constructed the phylogenetic tree and revised the manuscript. All authors have read and agreed on the contents of the final manuscript.
Supplemental Material
Download MS Excel (11.7 KB)Supplemental Material
Download MS Excel (10.9 KB)Supplemental Material
Download MS Word (369.4 KB)Supplemental Material
Download MS Word (261.6 KB)Supplemental Material
Download MS Word (235.2 KB)Disclosure statement
No potential conflict of interest was reported by the authors. Dr. CL is an author of this manuscript and also serves as the Editor-in-Chief of Mitochondrional DNA Part B journal. Dr. CL declares no conflicts of interest regarding the research findings in this study.
Data availability statement
The genome sequence data that support the findings of this study are openly available in GenBank of NCBI at (https://www.ncbi.nlm.nih.gov/) under the accession number MW420923. The associated BioProject, SRA, and Bio-Sample numbers are PRJNA704524, SRR13775224, and SAMN18043475, respectively.
Additional information
Funding
References
- Bolger AM, Lohse M, Usadel B. 2014. Trimmomatic: a flexible trimmer for Illumina sequence data. Bioinformatics. 30(15):2114–2120. doi: 10.1093/bioinformatics/btu170.
- Dugas DV, Hernandez D, Koenen EJM, et al. 2015. Mimosoid legume plastome evolution: IR expansion, tandem repeat expansions, and accelerated rate of evolution in clpP. Sci Rep. 5:16958. doi: 10.1038/srep16958.
- Hou K, Zheng D, Zhao Y, et al. 2020. Extract of Albizia kalkora leaves. Therm Sci. 24(3 Part A):1721–1728. doi: 10.2298/TSCI190523044H.
- Huan WY, Qu XJ, Chen SY, et al. 2017. Plastomes of mimosoideae: structural and size variation, sequence divergence, and phylogenetic implication. Tree Genet Genomes. 13(2):1–18.
- Katoh K, Standley D. 2013. MAFFT multiple sequence alignment software version improvements in performance and usability. Mol Biol Evol. 30(4):772–780. doi: 10.1093/molbev/mst010.
- Mariga P. 2004. Plastid transformation in higher plants. Annu Rev Plant Biol. 55(55):289–313.
- Nguyen LT, Schmidt HA, von Haeseler A, et al. IQ-TREE: a fast and effective stochastic algorithm for estimating maximum-likelihood phylogenies. Mol Biol Evol. 32(1):268–274. doi: 10.1093/molbev/msu300.
- Nicolas D, Patrick M, Guillaume S. 2017. NOVOPlasty: de novo assembly of organelle genomes from whole genome data. Nucleic Acids Res. 45(4):e18.
- Shi L, Chen H, Jiang M, et al. 2019. CPGAVAS2, an integrated plastome sequence annotator and analyzer. Nucleic Acids Res. 47(W1):W65–W73. doi: 10.1093/nar/gkz345.
- Shimodaira H, Hasegawa M. 1999. Multiple comparisons of log-likelihoods with applications to phylogenetic inference. Mol Biol Evol. 16(8):1114–1116. doi: 10.1093/oxfordjournals.molbev.a026201.
- Shimodaira H. 2002. An approximately unbiased test of phylogenetic tree selection. Syst Biol. 51(3):492–508. doi: 10.1080/10635150290069913.
- Tiayyba R, Wasim S, Alain V, et al. 2011. ecoPrimers: inference of new DNA barcode markers from whole genome sequence analysis. Nucleic Acids Res. 2011(21):e145.
- Zhang D, Gao F, Jakovlić I, et al. 2020. PhyloSuite: an integrated and scalable desktop platform for streamlined molecular sequence data management and evolutionary phylogenetics studies. Mol Ecol Resour. 20(1):348–355. doi: 10.1111/1755-0998.13096.
- Zhang R, Wang YH, Jin JJ, et al. 2020. Exploration of plastid phylogenomic conflict yields new insights into the deep relationships of Leguminosae. Syst Biol. 69(4):613–622.