
Abstract
Cross-biome data suggest that leaf venation density increases with decreasing moisture availability. If leaf venation traits were related to climatic conditions in such a predictable manner, these traits could serve, for example, as proxies for the reconstruction of past climates from fossil leaf remnants. However, our knowledge on vein–climate relationships is still scarce and relationships are poorly understood, particularly concerning broad-scale patterns in tropical regions. In this study, based on phylogenetic generalized least squares regression, we analysed leaf venation traits together with climatic niche data from 238 herbarium specimens to infer trait–trait and trait–climate relationships along a strong north–south rainfall gradient crossing West African savannas. Variation in leaf venation traits was strong along the climate gradient, yet vein–climate relationships were weak overall. This is in contrast to our expectation from the strong adaptive forces operating in drought-adapted vegetation covered by the gradient. On the other hand, several common patterns including intervein and vein–leaf size relationships were confirmed. A key finding was that while trait–climate relationships were mostly weak, some of these relationships became stronger when breaking down the entire taxon assemblage into smaller family-level units. This suggests that vein traits underlie partially opposing constraints in different clades, a pattern that is likely to become stronger with increasing higher-rank taxonomic diversity of species assemblages.
Introduction
Adaptive plant traits that determine performance in a given environment are key to shaping the composition of species assemblages (McGill et al. Citation2006). Identifying such traits and their correlation with environmental variables is therefore important for the understanding of plant distributions or, for example, for their use as proxies to predict past climatic conditions from fossils (Jordan Citation2011; Parrish Citation2001; Uhl and Mosbrugger Citation1999). With leaves as the primary interface between the plant and the atmosphere, leaf traits are central to the adaptive capacity of plants. One of the key trait dimensions in the global spectrum of plant form and function is the construction cost for photosynthetic leaf area (Díaz et al. Citation2016), of which the leaf hydraulic system is an important component (Sack and Scoffoni Citation2013). Because the construction of the leaf venation is costly, plants are expected to seek a balance between the investment in veins to meet the evaporative demands (providing sufficient veins to efficiently replenish water lost during gas exchange) and the gain in carbon units from photosynthesis (McKown, Cochard, and Sack Citation2010; Sperry Citation2003). This, in turn, means that different hydraulic environments require different vein architectures (e.g. Brodribb, Feild, and Sack Citation2010; Nardini, Peda, and La Rocca Citation2012). The adaptive capacity of the leaf venation was already detected in early studies (Zalenski Citation1902) and is reflected in the strong correlation of vein density with aridity in a cross-biome meta-analysis (Sack and Scoffoni Citation2013), and also within smaller species sets or individual lineages (e.g. Nardini, Peda, and La Rocca Citation2012; Zwieniecki, Boyce, and Holbrook Citation2004).
High vein density in arid environments allows high photosynthetic rates during periods of higher water availability (Sack and Scoffoni Citation2013). A high photosynthetic rate requires high stomatal density but also entails high water loss during gas exchange with the consequence that if water is not replenished stomata will close, thereby halting photosynthesis. To maintain their function, plants are likely to coordinate vein and stomatal densities as has been confirmed for inter- and infraspecific comparisons, and this is independent of whether density is regulated via minor or major veins (Brodribb, Jordan, and Carpenter Citation2013; Carins Murphy, Jordan, and Brodribb Citation2012; Dunbar-Co, Sporck, and Sack Citation2009; Edwards Citation2006; Fiorin, Brodribb, and Anfodillo Citation2015; Li et al. Citation2015; McElwain, Yiotis, and Lawson Citation2016; Schneider et al. Citation2017). Moreover, high vein density prevents damages from vein embolism by providing alternative ways to detour water around vein blockages to the sites of evaporation (Sack and Scoffoni Citation2013; Scoffoni et al. Citation2011). The density of major veins (i.e. vein orders 1°–3°) also increases with aridity because of its linkage with leaf size (Sack et al. Citation2012) and the trend of leaf area to decrease with aridity (Meng et al. Citation2015; Wright et al. Citation2017). Diameters of major veins, in turn, decrease with leaf size (Niinemets et al. Citation2007; Sack et al. Citation2012). Additionally, xylem reinforcement and conduit diameter also respond to increasing aridity as illustrated by the increase of the index (t/b)³ (i.e., the cube of the thickness of cell walls divided by the conduit lumen width) with decreasing precipitation (Jordan et al. Citation2013). Thus, with vein traits being particularly susceptible to increasing drought, climatic gradients reaching into arid regions should be reflected in the architecture of vein networks of the corresponding plant assemblages.
Although the vein network architecture is expected to reflect climatic conditions, still comparatively little is known about vein traits and their changes along broader climatic gradients. Sack and Scoffoni’s (Citation2013) global meta-analysis provided first insights into cross-biome relationships of vein density and climate. They found a global trend for vein density increasing from wet to dry biomes, a correlation that was particularly strong when plotting biome means of vein density against the Priestly-Taylor index, an index of annual moisture availability (but less so when based on individual values for vein density and mean annual precipitation). Whether vein traits respond to climate in a similar way at the within-biome level and at a more regional scale remained unclear because of the scarcity of data for some biomes, especially from the dry spectrum.
Recent studies (Blonder and Enquist Citation2014; Blonder et al. Citation2017; Zhao et al. Citation2016) provided more fine-grained data on vein trait–climate relationships along altitudinal gradients in tropical and temperate regions. However, studies using larger species assemblages and related climate data across latitudinal climatic gradients in tropical drought-adapted vegetation are still lacking.
Cross-community studies have shown that trait–environment relationships may be obscured if the underlying processes that sort species in communities are not primarily driven by the trait’s function but by phylogenetic constraints (e.g. phylogenetic niche conservatism; Blonder et al. Citation2017; Crisp and Cook Citation2012; Liu et al. Citation2015). The more taxonomically complex species assemblages are, the higher the probability that opposing constraints will operate in different taxa, thereby weakening the predictive power of traits. In other words, if there is variation in the degree of exploitation of mechanisms coordinating trait–trait or trait–environment relationships (e.g. Carins Murphy, Jordan, and Brodribb Citation2012), predictions of how traits respond to environment become unreliable. In view of vein traits, we might expect an increase in such diluting effects with increasing heterogeneity of gross venation architecture. For example, a brochidodromous venation (i.e. 2° veins are interconnected by a series of loops and do not reach the leaf margin; Hickey Citation1979) may have a different degree of freedom to vary with environment than a craspedodromous type (i.e. 2° veins terminate in the leaf margin) simply because of architectural/branching constraints. Such differences due to architectural constraints were found in Ochnaceae, in which vein networks with very dense 2° veins disobeyed the global scaling relationship of major vein density with leaf size (Schneider et al. Citation2017). Therefore, if a weak relationship is observed in taxonomically complex surveys, it might be rewarding to decompose the whole set into more homogeneous subsets of closely related taxa or other groups that are coherent in terms of morphological or functional traits.
Because herbarium collections are invaluable archives of present and historical environmental conditions – information that is stored in each specimen’s traits (e.g. vein density or leaf size as indicators of climate; Guerin, Wen, and Lowe Citation2012; Uhl and Mosbrugger Citation1999) – they provide a quick access point for obtaining data for a large-scale taxon-rich analysis of vein–climate relationships. In this study, we used the West Africa collections of the Herbarium Senckenbergianum (FR) to (1) characterize changes in leaf venation traits along a strong precipitation gradient in West Africa including different savanna vegetation types; to uncover (2) whether variation in vein density, vein diameter, and leaf size corresponds to variation in climatic conditions; and (3) to discover whether taxonomic breadth or diversity in gross venation types of species assemblages are important factors in the analysis of large-scale trait–climate relationships.
Materials and methods
Taxon sampling, georeferencing, study area and climatic variables
We initially selected 448 specimens from the West African collection of the Herbarium Senckenbergianum (FR) primarily based on their frequency as reported in Schmidt et al. (Citation2013). These specimens belong to 217 woody plant species from 126 genera and 39 angiosperm families (classification according to APG IV (Byng et al. Citation2016); taxon names according to the African Plant Database, version 3.4.0 (Citation2017)) and are from Burkina Faso (69%), Benin (20%) and Nigeria (5%), the remaining 6% from Ivory Coast, Niger, Mali and Cameroon (Figure S1). If available, three representative specimens were chosen per species (for some well-represented species more than three).
Most specimens were already georeferenced. For those without coordinates, georeferencing was done by retrieving coordinates from the GeoNames server (http://geonames.org/) using locality information of the specimens. Specimens which could not be georeferenced unambiguously were excluded from further extraction of climatic niche data (see below). Four bioclimatic variables that are expected to influence the species’ responses in leaf traits to the environment (e.g. Jordan Citation2011; Niinemets Citation2001) were used: mean annual temperature (MAT); mean annual precipitation (MAP); temperature seasonality, i.e. the standard deviation × 100 (TS); precipitation seasonality, i.e. coefficient of variation in monthly precipitation (PS). These were extracted from the WorldClim database (Hijmans et al. Citation2005; Fick and Hijmans Citation2017; http://www.worldclim.org/bioclim) with 30 arc-seconds resolution based on the occurrence data using the R package raster (Hijmans and van Etten Citation2015). The West African Sahelian-Sudanian zone is a region of low topographical complexity and with a pronounced north–south climatic gradient (Brice and Kampmann Citation2010; Konaté and Kampmann Citation2010; Thiombiano and Kampmann Citation2010). Therefore, the WorldClim data are expected to be sufficiently precise to overcome the lack of information due to sparse climate stations and, thus, to reflect well the climatic gradient in the region (Hijmans et al. Citation2005; Waltari et al. Citation2014).
The study area ranges from 2° to 25° N and 12° W to 17° E, covering a strong precipitation gradient from the Sahel zone in the north (with MAP as low as 300 mm year−1 and a rainy season of 2–3 months) to the Sudanian zone and the Sudanian-Guineo-Congolian transition zone in the south (with MAP surpassing 1100 mm and a rainy season of 5–6 months). MAT shows a reverse gradient with highest temperatures in the north and an overall interval ranging from 24°C to 29.5°C. The climatic gradient is mirrored in the vegetation covering Acacia wooded grassland and deciduous bushland in the dry north, Sudanian woodlands in the centre, and mosaics of lowland rainforest with woodlands in the more humid south (Brice and Kampmann Citation2010; Konaté and Kampmann Citation2010; Thiombiano and Kampmann Citation2010).
X-ray imaging
To keep destructive sampling of the herbarium specimens at a minimum, leaf venation networks were visualized using a combination of non-destructive high-resolution X-ray technology (Schneider et al. Citation2017) together with destructive chemical leaf clearing of small fragments (see below; they were used to visualize the smallest veins that were often not fully resolved on the X-ray images). Well-preserved, flat leaves were placed on flexible ultra-high definition image plates with a resolution of 20 μm and scanned in a Faxitron X-ray system (Hewlett-Packard) at tube voltages of 13 kV and with exposure times of 600–1020 s. Image data were read with a semi-automatic image plate scanner (Dürr, Germany) and stored as 16-bit RAW and 8-bit BMP files (the latter for image size definition of the RAW import). X-ray images can be retrieved from the Cleared Leaf Image Database (Das et al. Citation2014; www.clearedleavesdb.org) and are mirrored at the portal of the German Federation for Biological Data (www.gfbio.org). For data access see also the corresponding Senckenberg website (www.senckenberg.de/root/index.php?page_id=18149&abteilungID=27&institutID=1).
Chemical leaf clearing
Leaf fragments of 1–2 cm² were taken from the X-rayed leaves and placed in a biopsy cassette with a chamber size of 31 × 26 mm (Swingsette, Carl-Roth, Germany). For rehydration and softening, these cassettes were transferred into a glass jar with an aqueous solution of 5% NaOH and heated (80°C) for 2 h to 7 d until leaf fragments became transparent and soft. Then, the samples were washed in distilled water and placed for 5–15 min in an aqueous bleaching solution of 2.5% sodium hypochlorite until the leaf had turned pale white. The samples were washed again and transferred (within the cassettes) into 50% ethanol. After 30 min, samples were brought into a staining solution (1% safranin O in ethanol, w/vol) for about 5–15 min. Then, excessive stain was removed by leaving the samples in 50% ethanol for at least 30 min. Subsequently, the samples were transferred into 99% ethanol, before they were mounted on glass slides in Roti-Mount (Carl Roth, Germany). Images were taken at 25× and 63× magnification using a Dialux 22 light microscope (Leitz, Wetzlar, Germany) and the Leica DC300 camera system. Calibration was done with the measurement module of the IM1000 software, version 1.20, release 9 (Leica Microsystems, Heerbrugg, Switzerland). If leaf clearing was not successful (some clades such as Capparaceae were particularly reluctant), we also tried paradermal sections which was, however, much more challenging and often did not result in major improvements. We only used specimens in which all veins were clearly visible for subsequent analyses. For the storage of images, the same public databases/portals as mentioned above for X-ray images were used.
Vein measurements and gross venation types
Densities of the first two vein orders were calculated from measurements of vein lengths in one half of a leaf using the X-ray images of one leaf per specimen (except for very small leaves/leaflets as in Acacia). The same images were used to measure the leaf area (LA). The densities of 3° and minor veins were measured in three rectangles (usually based on chemically cleared fragments) in central positions of each leaf between the midrib and the margin. These data were used to calculate the total vein density (i.e. vein length per area, VLA), and the density of the major (major VLA) and minor veins (minor VLA). The diameters of the 1°–3° veins were measured centrally at three positions. All measurements were done with the program ImageJ (Rasband Citation2016) and the plugin ObjectJ, version 1.03x (Vischer and Nastase Citation2014). Leaf venation was further classified based on their gross venation patterns as observed on the X-ray images using terminology from Hickey (Citation1979) and Ellis et al. (Citation2009). The following types were found: brochidodromous (for definition see above), craspedodromous (for definition see above), eucamptodromous (i.e. 2° veins do not terminate at the margin; they gradually diminish near the margin and are connected to the superadjacent 2° veins by a series of vanishing loops), semicraspedodromous (2° veins branch within the margin with one branch terminating at the margin, the other joining the superadjacent 2° vein), and some intermediate types as brochido-eucamptodromous, and the less frequent clado-brochidodromous, and mixed craspedodromous types. Further, we separated palmately veined taxa (i.e. with more than one 1° vein) from the rest.
Phylogenetic comparative methods
To model the impact of phylogenetic relatedness on correlations between variables, we used a phylogenetic comparative approach. First, we constructed a phylogenetic tree containing all taxa of our study using the S.PhyloMaker function (Qian and Jin Citation2016) in R (R Core Team Citation2017). S.PhyloMaker produces a user-modified tree based on an updated version of the “Zanne megaphylogeny” (Zanne et al. Citation2014) that contains 31,383 species (including 30,193 angiosperms). This megaphylogeny contains all genera of our three family subsets (see below) with the exception of Piliostigma Hochst. and Pseudarthria Wight & Arn. (both Fabaceae). We used “scenario 3”, which is a tree that inserts taxa based on the approach of the program phylomatic (Webb and Donoghue Citation2005). To accommodate recent findings in Fabaceae (LPWG Citation2017), we shifted Piliostigma to a position as sister to Bauhinia L., and Pseudarthria as sister to a clade of Erythrina L. and Flemingia Roxb. ex W.T. Aiton. This was done with Mesquite, version 3.31 (Maddison and Maddison Citation2017), adjusting branch lengths to keep the tree ultrametric. This modified tree was then used to conduct phylogenetic generalized least squares regression (PGLS) with the R package caper (Orme et al. Citation2013). Phylogenetic signal was modelled using Pagel’s (Citation1999) λ, a tree transformation parameter that ranges between 0 (= no phylogenetic signal; i.e. the species are phylogenetically independent) and 1 (the model of trait evolution corresponds to a strict Brownian motion process; i.e. traits co-vary in proportion to shared evolutionary history), and that is robust to incompletely resolved phylogenies (i.e. polytomies) and suboptimal branch-length information (Molina-Venegas and Rodríguez Citation2017) as encountered in phylogenies obtained with phylomatic (see above). This parameter was estimated with a maximum likelihood approach that fits a PGLS model and optimizes the tree transformation applied to the variance–covariance matrix, thereby maximizing the likelihood. Because λ has a very low power to detect phylogenetic signals in small datasets (Freckleton, Harvey, and Pagel Citation2002), we conducted additional analyses with λ set to 0 (i.e. equivalent to an ordinary least squares model, OLS) and λ set to 1 (equivalent to a pure Brownian motion model) when datasets comprised fewer than 25 data points (see subsets below), and compared the effect on the trait–trait or trait–climate relationships. We determined λ for each vein trait with the R package phytools (Revell Citation2012) using the phylosig function. For data normalization and minimizing heteroscedasticity, variables were log-transformed (McDonald Citation2014). Model diagnostics were performed for PGLS in caper to identify possible violations of model assumptions. For data with studentized residuals greater than ±3, outliers were removed and the analysis rerun to check if there was a qualitative change in the variable’s relationships (following recommendations by Natalie Cooper, unpublished material). This was repeated for several rounds if new outliers appeared. However, qualitative changes were not observed for the studied variables. To reduce the amount of missing data, we finally worked with a dataset of 238 specimens for all vein trait–climate analyses (Table S1).
Because the influence of precipitation on responses in vein traits (or related physiological traits) is likely to be lower in plants dwelling close to water bodies (e.g. gallery forests), such species might bias our trait–climate analysis. Therefore, we initially tested their influence running analyses with the gallery forest species removed. With herbarium specimens sometimes lacking precise habitat information, we used published species lists from gallery forests of the study region (Savadogo et al. Citation2007) to exclude species reported to be exclusively or predominantly occurring in this forest type from our dataset. Since removing these species had little impact on the inferred trait–climate relationships (see Table S2), we kept the complete dataset for our analyses.
In addition to the complete dataset, we also segregated datasets for well-represented plant families to examine whether taxonomically more homogeneous assemblages provide more precise insights into relationships based on the assumption that in broader assemblages phylogenetically divergent trends (or divergent evolution in different traits) obscure the global pattern. Families with at least 15 representatives and distributed across a broader climatic gradient as informed by their latitudinal expansion (4° minimum range) were grouped into separate datasets. This included Combretaceae, Fabaceae, and Malvaceae. Moreover, we also created subsets for non-palmate venation as well as for brochidodromous, craspedodromous, and eucamptodromous venation types.
Results
Trait variation, trait–trait relationships, and phylogenetic signal
Vein traits varied considerably across the samples (Figure ). VLA ranged from 2.7 mm mm−2 (Lannea velutina A.Rich., Anacardiaceae) to 26.7 mm mm−2 (Acacia nilotica [L.] Willd. ex Delile), major VLA varied between 0.3 and 10.0 mm mm−2, and minor VLA between 2.2 and 17.5 mm mm−2 (Table S1).
Figure 1. Minor vein architecture of representative specimens with low (A,B) and high vein densities (C,D). (A) Pentadesma butyracea, (B) Drypetes gilgiana, (C) Stereospermum kunthianum, (D) Ziziphus mucronata. Bar = 500 μm (all at same magnification).
Our analysis of trait–trait correlations confirmed some widespread trends in angiosperm leaf venation. The PGLS analysis revealed a significant negative correlation of leaf size with VLA and major VLA but not with minor VLA (Figure , Table ). There was also a very tight relationship between the diameters of the major veins and leaf area, with the strength of the correlation decreasing from the 1°, 2° to the 3° diameters (Table ). For the subsets of Fabaceae, Combretaceae, and eucamptodromous venation, the negative correlation between VLA and leaf area was much stronger than in the whole dataset, but similar for the remaining subsets (Table ).
Figure 2. Relationships of vein density (VLA, major VLA, minor VLA) with leaf area, and of VLA, 1° diameter, and leaf area with MAP based on PGLS.
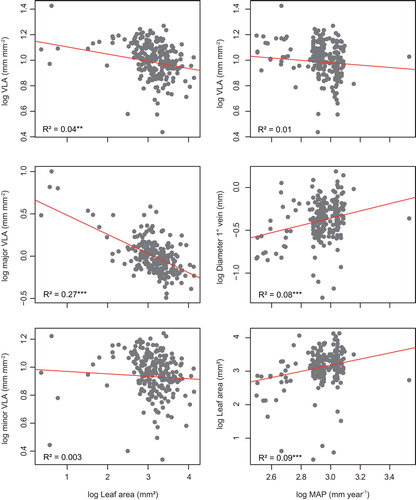
Table 1. Trait–trait and trait–climate relationships of the whole data-set. r, correlation coefficient as determined with PGLS. VLA, total vein density; LA, leaf area; Diam, diameter (of vein order 1°–3°); MAT, mean annual temperature; TS, coefficient of temperature seasonality; MAP, mean annual precipitation; PS, precipitation seasonality; p, probability; df, degree of freedom.
Table 2. Relationships between vein traits and leaf area with climatic variables, comparing the whole dataset with subsets segregated according to family or gross venation type. Values are correlation coefficients (r) as determined with PGLS. The bottom part illustrates changes in the strength of the correlations in the subsets relative to the whole data-set (“All”). +++, increase in strength (positive or negative) ≥ 0.3; ++, 0.29–0.2; +, 0.19–0.05; 0, 0.49–0 (a decrease is given in the same way but using “–” instead). Because λ has a very low power to detect phylogenetic signal in small datasets (<25 individuals; Malvaceae, craspedodromous venation), we also present correlation coefficients for scenarios with no influence of the phylogeny (i.e. λ = 0; equivalent to ordinary least squares regression) and λ = 1 (equivalent to a pure Brownian motion model). VLA, total vein density; LA, leaf area; MAT, mean annual temperature; TS, coefficient of temperature seasonality; MAP, mean annual precipitation; PS, precipitation seasonality; N, number of individuals. Here, we distinguished craspedodromous (craspedo), brochidodromous (brochido) and eucamptodromous (eucampto) venation and additionally grouped all pinnate (i.e. non-palmate) venation types.
Phylogenetic signal as determined from λ was moderate to strong in the analysed traits. It was lowest in 3° diameter (λ = 0.48) and highest in leaf area (λ = 0.93), in between were VLA (λ = 0.75), major VLA (λ = 0.80), minor VLA (λ = 0.66), 1° diameter (λ = 0.86), and 2° diameter (λ = 0.73).
Trait–climate relationships
Vein trait–climate relationships were weak for the complete dataset, albeit with some significant trends. The correlations between VLA with MAT, MAP and PS were not significant, contrary to the correlation with TS (Table ). The decrease of VLA with increasing MAP is a pattern consistently observed across the different vein types and familial clades analysed here, in Malvaceae only under a scenario of strong phylogenetic signal (Table ). Compared with the whole dataset, major VLA showed a significant correlation with TS (Table ), but not with the other climatic variables. Leaf area exhibited stronger correlations with climatic variables than the vein traits. Except for MAT, the correlations were significant (Table ). Correlations were non-significant for the 1° and 2° diameters with MAT, but with MAP both were significant (Table , Figure ).
The family subsets showed contrasting relationships between vein traits and climate. For example, VLA decreased with increasing MAP in Fabaceae and Combretaceae, whereas in Malvaceae this relationship was very weak (Table ). Both indices of temperature and precipitation seasonality were also moderately to strongly correlated with VLA in Fabaceae and Combretaceae (Table ). In contrast, the relationship of MAT with vein density was weak (with the exception of Fabaceae).
With species sorted according to gross venation type, the vein trait–climate relationships did not differ much from the whole dataset. The category with most changes in the strength of the correlations was the brochidodromous type (Table ).
Contrasting patterns among the subsets were also observed with reference to the strength of the correlations (Table ). In particular, the family sets showed strong increases in the strength of the correlations between VLA and climatic variables compared with the whole dataset. In Fabaceae and Combretaceae, the increase was very strong for all climatic variables (except MAT in the latter family). In contrast, Malvaceae showed no or minor changes in the strength of the correlations compared with the analysis of all species.
The whole dataset and all subsets shared a moderate to strong positive correlation between leaf area and MAP. This was strongest in Combretaceae and in species with craspedodromous venation (Table ). The scaling of LA with MAT was weak, whereas TS and PS showed a moderate correlation with LA (Table ) for the whole dataset.
For the small subsets (Malvaceae and craspedodromous venation) we ran analyses also with λ set to 0 (corresponding to a GLS model) and λ set to 1 (corresponding to a Brownian motion model). This showed that qualitative changes in the relationships of VLA with climatic variables were rare. Thus, in Malvaceae the changes in the strength of the correlations compared with the whole dataset were still much weaker than in Fabaceae and Combretaceae. Thus, even if λ may have failed to infer a phylogenetical signal correctly, the outlined differences in the vein trait–climate relationships between the families were not affected.
Discussion
Relationships between vein traits and leaf size
Our findings on trait–trait relationships from an understudied tropical biome corroborated the global pattern that major leaf veins of eudicots underlie developmental constraints, that is, their density is bound to leaf size because they initiate during the phase when leaf size increases due to cell proliferation. During later stages of leaf development, when leaf growth is principally based on cell expansion, these veins are pushed apart. Minor veins, in turn, originate throughout this later stage with the consequence that they are independent of leaf size (Sack et al. Citation2012). This is seen in our data, which show a strong negative correlation of major VLA with leaf size, whereas the relationship between minor VLA and leaf size is only weak and non-significant. Furthermore, major vein diameters revealed a strong positive scaling with leaf size (strong in 1° and 2° veins, moderate in 3° veins), which has been also found in previous studies (Niinemets et al. Citation2007; Sack et al. Citation2012). An increase in diameter in these veins with increasing leaf size ensures proper leaf functioning because major veins serve as the mechanical backbone of the leaf (Roth-Nebelsick et al. Citation2001; Sack et al. Citation2012). Moreover, large major veins with their high percentage of cross-sectional area represented by xylem are required for large leaves to guarantee effective water transport (Sack et al. Citation2012). Since these relationships are independent of the environmental conditions, they are observed in our savanna-forest transition as well as globally (see Sack et al. Citation2012).
The relationship between leaf venation architecture and climate
While the trait–trait relationships outlined above are well understood in terms of functional and developmental constraints, the relationships of vein traits with climate are still poorly known with studies often reporting contrasting responses. This suggests scale-dependent processes and the operation of phylogenetic or biotic constraints.
In our study, the overall relationships between vein traits and climatic variables were rather weak in spite of the strong environmental gradient from semi-arid to semi-humid (humid) climate. In particular, MAT showed a weak correlation with VLA, major VLA and major vein diameters. The weak predictive power of MAT is perhaps not surprising given the comparatively low variation across the climatic gradient in the study area. TS, in turn, expresses the annual temperature variation, which is much stronger across the north–south gradient. Therefore, its relationship with vein traits is stronger and lies in a similar range as MAP and PS.
Regarding the clear trend of VLA increasing with aridity across biomes at a global scale (Sack and Scoffoni Citation2013), the comparatively weak correlations were unexpected. This means that what is seen at a global scale or cross-biome level is not reflected at the within-biome level at a more regional scale. On the other hand, Sack and Scoffoni’s (Citation2013) study also revealed that VLA plotted against MAP resulted in a much weaker correlation (r = 0.17, P < 0.05; based on individual trait-climate values) than with their index of moisture availability (r = 0.93, P = 0.003; based on biome means). While at global scale MAP still produces a significant correlation with VLA, at a more regional scale the variation in responses of VLA to changes in MAP among species is too large to generate a significant relationship. Blonder et al. (Citation2017) also did not observe a significant relationship between MAP and VLA along the strong gradient from the Andes to the Amazon, but given that water was not a limiting factor along that transect the lack of correlation was unsurprising. In contrast, limited water availability is ubiquitous in large parts of our study area, rendering adaptations of the leaf hydraulic system to drought essential. Therefore, the heterogeneity in the responses of leaf venation architecture to MAP, resulting in the weak vein–climate relationships even towards the dry edge of vegetation, was surprising.
Perhaps different adaptive strategies are effective that weaken the predicted relationships. For example, drought deciduous strategies, which are common among woody savanna plants, might circumvent the problem of maintaining the leaf hydraulic system functional during unfavourable periods (Nardini and Luglio Citation2014). Another confounding factor might arise from stomata density. Generally, plants are expected to coordinate the density of veins and stomata to keep the photosynthetic rate efficient (e.g. Brodribb, Jordan, and Carpenter Citation2013; Fiorin, Brodribb, and Anfodillo Citation2015), which should vary with climatic conditions. If such a coordination is lacking, this may cause some additional plasticity in the responses of vein density to climate.
Although overall weak, some of the relationships confirm observations from previous studies. For example, the increase of VLA with decreasing moisture availability was also found in a global meta-analysis and is explained with the capability of plants to accomplish higher photosynthetic rates during pulses of high water availability in arid regions (Sack and Scoffoni Citation2013). The link between high vein density and aridity also reflects the lower mean air humidity in drier regions, increasing the difference between air water content of the leaf interior and the atmosphere. Thus, under a given stomatal conductance and leaf temperature, transpiration increases with increasing vapour pressure deficit. High VLA also coincides with small leaves, a common adaptation to aridity (Scoffoni et al. Citation2011). This is further reflected in the comparatively strong positive correlation between leaf area and MAP. The decrease in vein diameters with decreasing MAP fits the general adaptive strategy of size reduction with increasing aridity. Reducing diameters helps in maintaining vein spacing at levels that do not interfere with photosynthetic rate, otherwise the carbon gain–cost balance might become disadvantageous (Blonder et al. Citation2017; Brodribb, Feild, and Jordan Citation2007). Moreover, narrower veins, if associated with smaller conduit diameters, decrease the risk of vein embolism, which is particularly high under conditions of drought (Scoffoni et al. Citation2017).
The influence of taxonomic diversity on vein–climate relationships
In addition to the influence of different adaptive strategies outlined above, we assume that the weak vein–climate relationships arose from the taxonomic heterogeneity of the dataset, which increases the likelihood of divergent evolutionary constraints overriding climate effects. Support for this hypothesis comes from the phylogenetic signal in the dataset. In contrast to an Amazon–Andes transect in which phylogenetic constraints were reported to be weak in VLA (Blonder et al. Citation2017), our study revealed at least a moderate to strong influence of phylogeny on the variation in this trait as well as in the remaining vein traits. With phylogeny constraining variation in vein traits to some degree, the broad-scale effect of climate on shaping plant communities along the environmental gradient in this study seems to be limited. However, when breaking down the taxonomic complexity of our dataset by separating taxa on the family level, this pattern changed. Now, vein–climate relationships become stronger, as observed in Combretaceae and Fabaceae, but weaker in Malvaceae. This novel, although perhaps not surprising, finding suggests that evolution constrains vein traits in different, sometimes contrasting ways in different families. Considering the complex interplay between leaf hydraulics, the photosynthetic system, including size and density of stomata, leaf size and biomechanics (see Note S9 in Sack and Scoffoni Citation2013), there are many ways how trait variation can be constrained, with different effects on the leaf hydraulic architecture (e.g. Carins Murphy, Jordan, and Brodribb Citation2012). Blonder and Enquist (Citation2014) already speculated that different performance requirements as, for example, mechanical strength or sequestration of secondary compounds may explain the high intra-site variation in vein traits in their elevational transects. It is evident that the more distant the taxa, the higher the likelihood of divergent physiological or biomechanical constraints and thus responses of vein traits to climate. The slightly stronger correlation between VLA and MAP observed at the global scale across the world’s major biomes with their different taxonomic compositions (Sack and Scoffoni Citation2013) seems to be contradictory. However, spanning such a strong gradient (e.g. MAP < 200 to > 4000 mm year−1) makes it more likely that taxonomic effects are overridden by the strong differences in adaptive requirements across the diverse biomes.
Another factor that influences the variability of vein traits is gross venation pattern. Whether leaves have a highly reticulate or a strictly parallel venation implies, for example, different biomechanical characteristics (Roth-Nebelsick et al. Citation2001) which in turn confine the species’ trait variation. In pantropical Ochnaceae, different gross venation types also showed different relationships with climate (Schneider et al. Citation2017; Schneider, unpublished data). Palmate venation with their redundant major veins has been shown to provide a different adaptive capacity from non-palmate venation (Sack and Scoffoni Citation2013; Sack et al. Citation2008). However, overall patterns were similar among the gross venation types analysed here. This suggests that phylogenetic constraints are more important in determining the responses of veins to climate than those imposed by network architecture (if these exist at all).
Conclusion
A strong trait-environment relationship means that species may be filtered into different environments based on the function of a given trait (Blonder et al. Citation2017). If true, such a trait could serve as a predictor of environmental conditions. For the savanna biome analysed here, the response of vein traits to climatic conditions is apparently controlled not only by the trait’s function but by different factors of which phylogeny is a prominent one. This renders the predictive power of these traits rather limited. However, the considerable variation in the strength of the vein–climate relationships across families in our study also suggests that relationships are more consistently recovered at the level of widely distributed individual families. Vein density as well as the 1° and 2° vein diameters are the most promising candidates for such vein–climate links.
Notes on contributors
Julio V. Schneider conceived the study, performed the experiments and led the analysis and writing. He is a postdoc who is interested in the taxonomy and evolution of angiosperms.
Vanessa Negraschis performed the experiments, analysed the data and wrote the manuscript. She holds a Master’s degree in Biology from Goethe-University, Frankfurt, Germany.
Jörg Habersetzer performed the experiments and contributed to writing the paper. He is the head of the section Vertebrate Radiography and Paleobiology at the Senckenberg Research Institute.
Renate Rabenstein performed the experiments and contributed to writing the paper. She is the head of the section Chiroptera Project Management at the Senckenberg Research Institute.
Jens Wesenberg , analysed the data and contributed to writing the paper. He is a postdoc at the Senckenberg Museum of Natural History Görlitz.
Karsten Wesche contributed to the design of the overall project and its implementation, and also contributed to writing. He is the head of the Department of Botany of the Senckenberg Museum of Natural History Görlitz and teaches plant biodiversity at the International Institute Zittau, Technische University Dresden.
Georg Zizka conceived the study and contributed to writing the paper. He is the head of the Department of Botany and Molecular Evolution at the Senckenberg Research Institute and Professor at the Goethe University.
Disclosure statement
The authors disclose any conflict of interest.
Funding
This work was supported by the Deutsche Forschungsgemeinschaft (DFG) under Grants Zi 557/11-1; Ha 1393/4-1 and We 2601/4-2.
Supplemental data
Supplemental material for this paper is available online at https://doi.org/10.1080/23818107.2017.1421480
TABG_1421480_Supplementary_Material.zip
Download Zip (1.4 MB)Acknowledgements
The authors thank Marco Schmidt for discussion and access to locality data, Yi Jin for help with S.PhyloMaker, and Rainer Döring, Anna Frenkel, Robin Kunz, Patricia Petry-Ziegler, Regina Posch and Franziska Weber for technical support.
Related Research Data
References
- African Plant Database (version 3.4.0) . 2017. Conservatoire et Jardin botaniques de la Ville de Genève and South African National Biodiversity Institute, Pretoria. Accessed August 2017. http://www.ville-ge.ch/musinfo/bd/cjb/africa/
- Blonder, B. , and B. J. Enquist . 2014. “Inferring Climate From Angiosperm Leaf Venation Networks.” New Phytologist 204: 116–126. doi:10.1111/nph.12780.
- Blonder, B. , N. Salinas , L. P. Bentley , A. Shenkin , P. O. Chambi Porroa , Y. Valdez Tejeira , C. Violle , et al . 2017. “Predicting Trait-Environment Relationships for Venation Networks Along an Andes-Amazon Elevation Gradient.” Ecology 98: 1239–1255. doi:10.1002/ecy.1747.
- Brice, S. , and D. Kampmann , eds. 2010. Atlas de la biodiversité de l’Afrique de l’Ouest [Atlas of Western Africa Biodiversity]. vol. 1. Bénin: Cotonou & Frankfurt am Main.
- Brodribb, T. , T. Feild , and G. Jordan . 2007. “Leaf Maximum Photosynthetic Rate and Venation are Linked by Hydraulics.” Plant Physiology 144: 1890–1898.10.1104/pp.107.101352
- Brodribb, T. , T. Feild , and L. Sack . 2010. “Viewing Leaf Structure and Evolution from a Hydraulic Perspective.” Functional Plant Biology 37: 488–498.10.1071/FP10010
- Brodribb, T. J. , G. J. Jordan , and R. J. Carpenter . 2013. “Unified Changes in Cell Size Permit Coordinated Leaf Evolution.” New Phytologist 199: 559–570.10.1111/nph.12300
- Byng, J. W. , M. W. Chase , M. J. M. Christenhusz , M. F. Fay , W. S. Judd , D. J. Mabberley , A. N. Sennikov , D. E. Soltis , P. S. Soltis , and P. F. Stevens (The Angiosperm Phylogeny Group) . 2016. “An Update of the Angiosperm Phylogeny Group Classification for the Orders and Families of Flowering Plants: APG IV.” Botanical Journal of the Linnean Society 181: 1–20.
- Carins Murphy, M. R. , G. J. Jordan , and T. J. Brodribb . 2012. “Differential Leaf Expansion can Enable Hydraulic Acclimation to Sun and Shade.” Plant, Cell & Environment 35: 1407–1418.10.1111/pce.2012.35.issue-8
- Crisp, M. D. , and L. G. Cook . 2012. “Phylogenetic Niche Conservatism: What are the Underlying Evolutionary and Ecological Causes?” New Phytologist 196: 681–694.10.1111/nph.2012.196.issue-3
- Das, A. , A. Buksch , C. A. Price , and J. S. Weitz . 2014. “ClearedLeavesDB: An Online Database of Cleared Plant Leaf Images.” Plant Methods 10: 8.10.1186/1746-4811-10-8
- Díaz, S. , J. Kattge , J. H. C. Cornelissen , I. J. Wright , S. Lavorel , S. Dray , B. Reu , et al . 2016. “The Global Spectrum of Plant form and Function.” Nature 529: 167–171.
- Dunbar-Co, S. , M. J. Sporck , and L. Sack . 2009. “Leaf Trait Diversification and Design in Seven Rare Taxa of the Hawaiian Plantago Radiation.” International Journal of Plant Sciences 170: 61–75.10.1086/593111
- Edwards, E. J. 2006. “Correlated Evolution of Stem and Leaf Hydraulic Traits in Pereskia (Cactaceae).” New Phytologist 172: 479–489.10.1111/nph.2006.172.issue-3
- Ellis, B. , D. C. Daly , L. J. Hickey , J. D. Mitchell , K. R. Johnson , P. Wilf , and S. L. Wing . 2009. Manual of Leaf Architecture . Ithaca, NY: Cornell University Press.
- Fick, S. E. , and R. J. Hijmans . 2017. “Worldclim 2: New 1-km Spatial Resolution Climate Surfaces for Global Land Areas.” International Journal of Climatology 37: 4302–4315.
- Fiorin, L. , T. J. Brodribb , and T. Anfodillo . 2015. “Transport Efficiency Through Uniformity: Organization of Veins and Stomata in Angiosperm Leaves.” New Phytologist 209: 216–227. doi:10.1111/nph.13577.
- Freckleton, R. P. , P. H. Harvey , and M. Pagel . 2002. “Phylogenetic Analysis and Comparative Data: A Test and Review of Evidence.” American Naturalist 160: 712–726.10.1086/343873
- Guerin, G. R. , H. Wen , and A. J. Lowe . 2012. “Leaf Morphology Shift Linked to Climate.” Biology Letters 8: 882–886. doi:10.1098/rsbl.2012.0458.
- Hickey, L. J. 1979. “A Revised Classification of the Architecture of Dicotyledonous Leaves.” In Anatomy of the dicotyledons , Vol. 1, 2nd ed., edited by C. R. Metcalfe and L. Chalk , 25–38. Oxford: Clarendon Press.
- Hijmans, R. J. , and J. van Etten . 2015. “Raster: Geographic Data Analysis and Modeling.” R package version 2.3-40. Accessed May 10. https://cran.r-project.org/web/packages/raster/index.html
- Hijmans, R. J. , S. E. Cameron , J. L. Parra , P. G. Jones , and A. Jarvis . 2005. “Very High Resolution Interpolated Climate Surfaces for Global Land Areas.” International Journal of Climatology 25: 1965–1978.10.1002/(ISSN)1097-0088
- Jordan, G. J. 2011. “A Critical Framework for the Assessment of Biological Palaeoproxies: Predicting Past Climate and Levels of Atmospheric CO2 from Fossil Leaves.” New Phytologist 192: 29–44.10.1111/j.1469-8137.2011.03829.x
- Jordan, G. J. , T. Brodribb , C. J. Blackman , and P. H. Weston . 2013. “Climate Drives Vein Anatomy in Proteaceae.” American Journal of Botany 100: 1483–1493.10.3732/ajb.1200471
- Konaté, S. , and D. Kampmann , eds. 2010. Atlas de la biodiversité de l’Afrique de l’Ouest [Atlas of Western Africa Biodiversity]. Vol. 3. Cote d’Ivoire: Abidjan & Frankfurt am Main.
- Li, L. , M. L. McCormack , C. Ma , D. Kong , Q. Zhang , X. Chen , H. Zeng , Ü. Niinemets , and D. Guo . 2015. “Leaf Economics and Hydraulic Traits are Decoupled in Five Species-Rich Tropical-Subtropical Forests.” Ecology Letters 18: 899–906.10.1111/ele.2015.18.issue-9
- Liu, H. , Q. Xu , P. He , L. S. Santiago , K. Yang , and Q. Ye . 2015. “Strong Phylogenetic Signals and Phylogenetic Niche Conservatism in Ecophysiological Traits Across Divergent Lineages of Magnoliaceae.” Scientific Reports 5: 12246.10.1038/srep12246
- LPWG . 2017. “A New Subfamily Classification of the Leguminosae Based on a Taxonomically Comprehensive Phylogeny.” Taxon 66: 44–77.
- Maddison, W. P. , and D. R. Maddison . 2017. “Mesquite: A Modular System for Evolutionary Analysis.” Version 3.31. Accessed February 06, 17. http://mesquiteproject.org
- McDonald, J. H. 2014. Handbook of Biological Statistics . Baltimore, MD : Sparky House Publishing.
- McElwain, J. C. , C. Yiotis , and T. Lawson . 2016. “Using Modern Plant Trait Relationships between Observed and Theoretical Maximum Stomatal Conductance and Vein Density to Examine Patterns of Plant Macroevolution.” New Phytologist 209: 94–103.10.1111/nph.13579
- McGill, B. , B. J. Enquist , E. Weiher , and M. Westoby . 2006. “Rebuilding Community Ecology from Functional Traits.” Trends in Ecology and Evolution 21: 178–185.10.1016/j.tree.2006.02.002
- McKown, A. D. , H. Cochard , and L. Sack . 2010. “Decoding Leaf Hydraulics with a Spatially Explicit Model: Principles of Venation Architecture and Implications for its Evolution.” American Naturalist 175: 447–460.10.1086/650721
- Meng, T.-T. , H. Wang , S. P. Harrison , I. C. Prentice , J. Ni , and G. Wang . 2015. “Responses of Leaf Traits to Climatic Gradients: Adaptive Variation versus Compositional Shifts.” Biogeosciences 12: 5339–5352.10.5194/bg-12-5339-2015
- Molina-Venegas, R. , and M. Á. Rodríguez . 2017. “Revisiting Phylogenetic Signal; Strong or Negligible Impacts of Polytomies and Branch Length Information?” BMC Evolutionary Biology 17: 113.10.1186/s12862-017-0946-7
- Nardini, A. , and J. Luglio . 2014. “Leaf Hydraulic Capacity and Drought Vulnerability: Possible Trade-Offs and Correlations with Climate Across three Major Biomes.” Functional Ecology 28: 810–818.10.1111/fec.2014.28.issue-4
- Nardini, A. , G. Peda , and N. La Rocca . 2012. “Trade-offs between Leaf Hydraulic Capacity and Drought Vulnerability: Morpho-Anatomical Bases, Carbon Costs and Ecological Consequences.” New Phytologist 196: 788–798.10.1111/nph.2012.196.issue-3
- Niinemets, Ü. 2001. “Global-Scale Climatic Controls of Leaf Dry Mass Per Area, Density, and Thickness in Trees and Shrubs.” Ecology 82: 453–469.10.1890/0012-9658(2001)082[0453:GSCCOL]2.0.CO;2
- Niinemets, Ü. , A. Portsmuth , D. Tena , M. Tobias , S. Matesanz , and F. Valladares . 2007. “Do we Underestimate the Importance of Leaf Size in Plant Economics? Disproportional Scaling of Support costs within the Spectrum of Leaf Physiognomy.” Annals of Botany 100: 283–303.10.1093/aob/mcm107
- Orme, D. , R. Freckleton , G. Thomas , T. Petzoldt , S. Fritz , N. Isaac , and W. Pearse . 2013. “Caper: Comparative Analyses of Phylogenetics and Evolution in R.” R package version 0.5.2. Accessed February 08, 17. https://CRAN.R-project.org/package=caper
- Pagel, M. 1999. “Inferring the Historical Patterns of Biological Evolution.” Nature 401: 877–884.10.1038/44766
- Parrish, J. T. 2001. Interpreting Pre-Quaternary Climate from the Geologic Record . New York : Columbia University Press.
- Qian, H. , and Y. Jin . 2016. “An Updated Megaphylogeny of Plants, a Tool for Generating Plant Phylogenies and an Analysis of Phylogenetic Community Structure.” Journal of Plant Ecology 9: 233–239.10.1093/jpe/rtv047
- R Core Team . 2017. R: A Language and Environment for Statistical Computing . Vienna: R Foundation for Statistical Computing. Accessed February 17, 2017 . http://www.R-project.org/
- Rasband, W. S. 2016. ImageJ . Bethesda, Maryland, USA: U. S. National Institutes of Health. Accessed June 13, 2016. http://imagej.nih.gov/ij/
- Revell, L. J. 2012. “Phytools: An R Package for Phylogenetic Comparative Biology (And Other Things).” Methods in Ecology and Evolution 3: 217–223.10.1111/j.2041-210X.2011.00169.x
- Roth-Nebelsick, A. , D. Uhl , V. Mosbrugger , and H. Kerp . 2001. “Evolution and Function of Leaf Venation Architecture: A Review.” Annals of Botany 87: 553–566.10.1006/anbo.2001.1391
- Sack, L. , and C. Scoffoni . 2013. “Leaf Venation: Structure, Function, Development, Evolution, Ecology and Applications in the Past, Present and Future.” New Phytologist 198: 983–100.10.1111/nph.12253
- Sack, L. , E. M. Dietrich , C. M. Streeter , D. Sánchez-Gómez , and N. M. Holbrook . 2008. “Leaf Palmate Venation and Vascular Redundancy Confer Tolerance of Hydraulic Disruption.” Proceedings of the National Academy of Sciences, USA 105: 1567–1572.10.1073/pnas.0709333105
- Sack, L. , C. Scoffoni , A. D. McKown , K. Frole , M. Rawls , J. C. Havran , H. Tran , and T. Tran . 2012. “Developmentally Based Scaling of Leaf Venation Architecture Explains Global Ecological Patterns.” Nature Communications 3: 837.10.1038/ncomms1835
- Savadogo, P. , M. Tigabu , L. Sawadogo , and P. C. Odén . 2007. “Woody Species Composition, Structure and Diversity of Vegetation Patches of a Sudanian Savanna in Burkina Faso.” Bois et Forêts des Tropiques 294: 5–20.
- Schmidt, M. , S. Traoré , A. Ouédraogo , E. Mbayngone , O. Ouédraogo , A. Zizka , I. Kirchmair , et al . 2013. “Geographical Patterns of Woody Plants’ Functional Traits in Burkina Faso.” Candollea 68: 197–207.10.15553/c2012v682a3
- Schneider, J. V. , J. Habersetzer , R. Rabenstein , J. Wesenberg , K. Wesche , and G. Zizka . 2017. “Water Supply and Demand Remain Coordinated During Breakdown of the Global Scaling Relationship Between Leaf Size and Major Vein Density.” New Phytologist 214: 473–486.10.1111/nph.14382
- Scoffoni, C. , M. Rawls , A. McKown , H. Cochard , and L. Sack . 2011. “Decline of Leaf Hydraulic Conductance with Dehydration: Relationship to Leaf Size and Venation Architecture.” Plant Physiology 156: 832–843.10.1104/pp.111.173856
- Scoffoni, C. , C. Albuquerque , C. R. Brodersen , S. V. Townes , G. P. John , H. Cochard , T. N. Buckley , A. J. McElrone , and L. Sack . 2017. “Leaf Vein Xylem Conduit Diameter Influences Susceptibility to Embolism and Hydraulic Decline.” New Phytologist 213: 1076–1092.10.1111/nph.14256
- Sperry, J. S. 2003. “Evolution of Water Transport and Xylem Structure.” International Journal of Plant Sciences 164: S115–S127.10.1086/368398
- Thiombiano, A. , and D. Kampmann , eds. 2010. Atlas de la biodiversité de l’Afrique de l’Ouest [Atlas of Western Africa Biodiversity]. vol. 2. Bénin: Ouagadougou & Frankfurt am Main.
- Uhl, D. , and V. Mosbrugger . 1999. “Leaf Venation Density as a Climate and Environmental Proxy: A Critical Review and New Data.” Palaeogeography, Palaeoclimatology, Palaeoecology 149: 15–26.10.1016/S0031-0182(98)00189-8
- Vischer, N. , and S. Nastase . 2014. “ObjectJ. Non-Destructive Marking and Linked Results.” A plugin for ImageJ . Accessed June 13, 2016. https://sils.fnwi.uva.nl/bcb/objectj/
- Waltari, E. , R. Schroeder , K. McDonald , R. P. Anderson , and A. Carnaval . 2014. “Bioclimatic Variables Derived from Remote Sensing: Assessment and Application for Species Distribution Modelling.” Methods in Ecology and Evolution 5: 1033–1042.10.1111/mee3.2014.5.issue-10
- Webb, C. O. , and M. J. Donoghue . 2005. “Phylomatic: Tree Assembly for Applied Phylogenetics.” Molecular Ecology Notes 5: 181–183. Accessed February 13, 2017. http://phylodiversity.net/phylomatic/ 10.1111/men.2005.5.issue-1
- Wright, I. J. , N. Dong , V. Maire , I. C. Prentice , M. Westoby , S. Díaz , R. V. Gallagher , et al . 2017. “Global Climatic Drivers of Leaf Size.” Science 357: 917–921. doi:10.1126/science.aal4760.
- Zalenski, W. v. 1902. “Ueber die Ausbildung der Nervation bei verschiedenen Pflanzen.” [On the formation of nervation for different plants] Berichte der Deutschen Botanischen Gesellschaft 20: 433–440.
- Zanne, A. E. , D. C. Tank , W. K. Cornwell , J. M. Eastman , S. A. Smith , R. G. FitzJohn , D. J. McGlinn , et al . 2014. “Three Keys to the Radiation of Angiosperms into Freezing Environments.” Nature 206: 98–92.
- Zhao, W. L. , Y. J. Chen , T. J. Brodribb , and K. F. Cao . 2016. “Weak Co-Ordination between Vein and Stomatal Densities in 105 Angiosperm Tree Species along Altitudinal Gradients in Southwest China.” Functional Plant Biology 43: 1126–1133. doi:10.1071/FP16012.
- Zwieniecki, M. A. , C. K. Boyce , and N. M. Holbrook . 2004. “Hydraulic Limitations Imposed by Crown Placement Determine Final Size and Shape of Quercus rubra L. Leaves.” Plant Cell and Environment 27: 357–365.10.1111/pce.2004.27.issue-3