
Abstract
Diagnostic and therapeutic purposes are issuing pressing demands to improve the evaluation of the dysplasia condition of the femoral trochlea. The traditional clinical assessment of the dysplasia, based on Dejour classification, recognized 4 increasing (A, B, C, D) levels of severity. It has been extensively questioned in the literature that this classification methodology can be defective suggesting that quantitative measures can ensure more reliable criteria for the dysplasia severity assessment. This study reports on a novel technique to model the trochlear surface (TS), digitally reconstructed by 3D volumetric imaging, using three hyperbolic paraboloids (HP), one to describe the global trochlear aspect, two to represent the local aspects of the medial and lateral compartments, respectively. Results on a cohort of 43 patients, affected by aspecific anterior knee pain, demonstrate the consistency of the estimated model parameters with the morphologic aspect of the TS. The obtained small fitting error (on average lower than 0.80 mm) demonstrated that the ventral aspect of the trochlear morphology can be modeled with high accuracy by HPs. We also showed that HP modeling provides a continuous representation of morphologic variations in shape parameter space while we found that similar morphologic anomalies of the trochlear aspect are actually attributed to different severity grades in the Dejour classification. This finding is in agreement with recent works in the literature reporting that morphometric parameters can only optimistically be used to discriminate between the Grade A and the remaining three grades. In conclusion, we can assert that the proposed methodology is a further step toward modeling of anatomical surfaces that can be used to quantify deviations to normality on a patient-specific basis.
Introduction
Diagnostic and therapeutic purposes are issuing pressing demands to improve the clinical evaluation of the femoral trochlea morphology anomalies (e.g. trochlear dysplasia) that can potentially lead to arthrosis and knee instability. From a diagnostic point of view, understanding how morphologic variations correlate with disease can help clinicians to identify risk factors for the setting of cartilage lesions at patella–femur interface.[Citation1–3] This information has been acknowledged to be beneficial in preventing and treating patellofemoral disorders.[Citation4,Citation5] From a surgical point of view, the extent of the morphologic variations is determinant for the selection of the optimal implant in trochleoplasty interventions.[Citation6–10] Evaluating the morphologic deviations to normality is however complicated by the fact that the three-dimensional (3D) geometric profile of the trochlea is extremely complex and sensibly varies amongst individuals.[Citation11–13]
One of the most applied clinical approach to score the morphologic anomalies of the trochlear surface (TS) is based on the Dejour classification, which encompasses four different qualitative Grades (A, B, C, D) of increasing severity.[Citation14,Citation15] Based on radiological assessment, the evaluation is performed by means of clinical signs, such as the shape of the groove, the roundness of the two facets and their absolute and relative sizes. Specifically, the four grades encode the ‘shallow trochlear groove’, ‘flat trochlea’, ‘medial hypoplasia with potential lateral convexity’, and ‘excessive asymmetry of the trochlear facets’, respectively. However, this grading has been extensively questioned in the literature due to difficulty in clustering the large variability of the morphologic anomalies into such specific classes, suggesting that morphometric measures can yield more reliable criteria to score the anomaly degree.[Citation2,Citation16,Citation17]
Morphometric parameters, such as the trochlear depth, the sulcus angle, the lateral trochlear facet inclination and the trochlear facet asymmetry ratio, to cite the most relevant, are based on anatomical landmarks manually digitized in computed tomography (CT) and magnetic resonance (MR) images.[Citation12,Citation18–21] The use of such parameters have been criticized as well because of difficulties in the precise localization of landmarks, especially in case of large morphologic deviations,[Citation20] dependency on the adopted measurement protocol [Citation2,Citation5,Citation17] and inter-observer variability.[Citation22] These issues further complicate the definition of absolute cut-off values adopted to discriminate between normal and abnormal morphologies and even to identify different severity grades.[Citation5,Citation23,Citation24]
From this background, the manuscript presents a novel modeling technique of the trochlear geometry based on hyperbolic paraboloids (HP). It allows for a synthetic description of the 3D trochlear shape in terms of four parameters which represent the roundness of overall shape and medial and lateral compartments. The work aims at showing that similar morphologic anomalies, encoded by homogeneous HP parameters, are actually identified with different grades of Dejour dysplastic severity, thus restating that the difference among the grades, according to qualitative signs of the trochlear aspect, cannot be simply mapped to monotonic variations of morphometric parameters as recently hypothesized in the literature.[Citation15,Citation16] Distal femur surfaces of symptomatic patients (aspecific anterior knee pain) were retrospectively included in this study to verify the hypothesis.
Materials and methods
Distal femur surface dataset
The distal femur surface dataset of forty-three patients (21 males, 22 females; mean age 56; age range 25–74 years) was reconstructed from diagnostic CT scans, acquired at the CTO Hospital (Orthopedic Trauma Centre) in Milan (Italy) from May 2011 to October 2012. The patients were selected based on aspecific anterior knee pain, no previous interventions, no patellofemoral instability, and International Cartilage Repair Society (ICRS) grade ≤2.[Citation5] All the patients were clinically reviewed by one expert orthopedic surgeon and one radiology expert. From the clinical analysis, 23 patients did not show any pathologic signs of the TS (normal group) whereas 20 patients were indicated with trochlear abnormalities in the first three over the four grades of the Dejour classification (abnormal group). 4, 5, and 11 patients were classified with Grades A, B, and C, respectively. No patient was classified with D grade. The study was approved by the CTO hospital Institutional Review Board.
Every image dataset, running approximately from the distal femur to the proximal tibia, was acquired through a 6-slice CT scanner Siemens Emotion featuring a resolution of 512 × 512 pixels (pixel size from 0.25 × 0.25 mm to 0.5 × 0.5 mm) and an axial range between 1 and 2 mm. An expert radiological operator performed the manual segmentation to extract the bony profiles and reconstruct the triangular surface mesh of the distal femur using the Amira software (VSG|FEI Visualization Sciences Group, Hillsboro, OR, USA). Osteophytes and articular cartilages were not included in the segmentation process. The reconstructed distal femur surfaces had approximately 145,000 faces on average. The distal femur surfaces were smoothed and under-sampled up to 10,000 faces, keeping high the surface quality. On average, throughout the patient dataset, the root mean squared difference between the original segmented femur surfaces and the smoothed surfaces was lower than 0.4 mm. All the surfaces were aligned using rigid registration [Citation4] to the first surface considered as the reference model. The average medio-lateral (frontal plane) and anterior–posterior (sagittal plane) sizes of the distal femur models were 8.3 ± 0.6cm (max: 9.3, min: 6.9) and 6.8 ± 0.5cm (max: 8.4, min: 5.7), respectively.
Trochlear surface segmentation
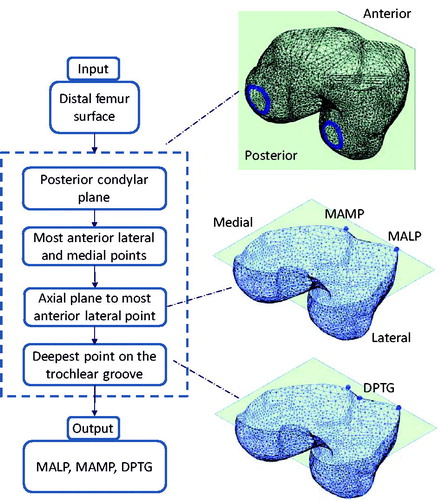
The procedure to extract the TS from 3D models of the femur stems from an earlier technique in the literature,[Citation25–27] which exploits the bony surface curvature to find reliable anatomical region boundaries. Such a technique was demonstrated able to automatically cut apart the trochlear groove from the distal femur surface.[Citation28] In the present work, we extended the technique to extract the overall TS, including the ventral aspect of the two facets. The method is based on three essential geometric landmarks, namely the most anterior lateral point (MALP), the most anterior medial point (MAMP), and the deepest point on the trochlear groove (DPTG). MALP and MAMP were both determined as the points at maximum anterior distance from the posterior condylar plane (PCP) (). For each surface model, the PCP was automatically computed by a custom optimization procedure, which maximizes the similarity between the cross-sections of the two condyles given by the PCP.[Citation27] DPTG was computed as the most interior point on the cross-section curve through MALP and MAMP, obtained by clipping the distal femur surface through the axial plane (CT scan plane) passing through MALP.
Figure 1. Chart of the automatic algorithm to compute the segmentation of the most anterior lateral and medial points, along with the deepest point of the trochlear groove.
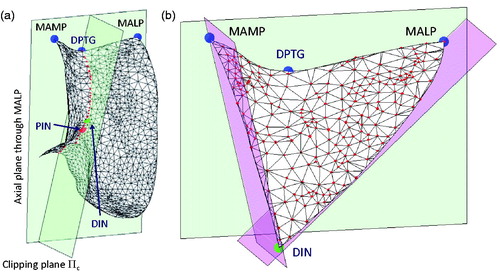
The clipping plane Πc, passing through DPTG and parallel to the principal direction of the trochlear groove,[Citation28] provided the curve of the trochlear groove (). The curve was processed to detect the posterior intercondylar notch (PIN), featuring the minimum (negative) (mean-shifted) curvature.[Citation27] The distal intercondylar notch (DIN) was then chosen as the first point, along the curve, having positive curvature when traversing the curve from posterior to anterior direction starting from PIN. The TS was then obtained by clipping the overall distal femur surface with three planes, namely the axial plane (CT scan plane) passing through the MALP, the plane orthogonal to the axial plane containing the line DIN-MALP and the plane orthogonal to the axial plane containing the line DIN-MAMP (). On average, throughout the 43 patients, the TS was represented by approximately 350 points. The medial and lateral parts were attained by clipping the entire TS plane with the plane Πc, used to identify the curve of the trochlear groove.
Figure 2. Posterior and distal intercoldylar notch points on the internal trochlear region (a). The ventral aspect of the trochlear surface segmented on the distal femur surface (b).
Trochlear surface modeling through hyperbolic paraboloids
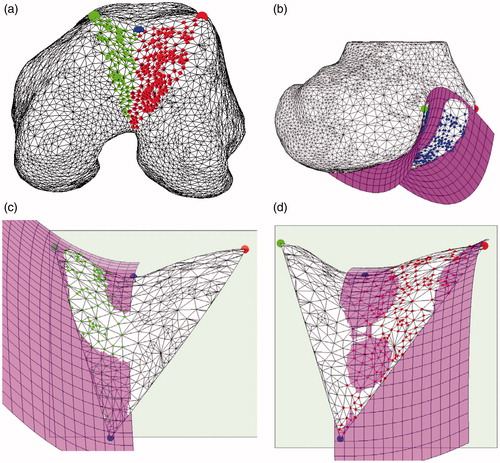
The modeling was carried out in two steps. In the first step, a HP was fit to the overall TS to capture its global roundness (). In the second step, in order to model the medial and lateral facets separately, two local hemi-HPs were taken into account (). Considering the canonical equation of the HP , this can be generalized in matrix form including the rotation matrix R and the translation vector
as:
(1)
where
(2)
(3)
(4)
Figure 3. Lateral and medial sides of the trochlear surface (a). HP modeling of the overall trochlear surface (b). Medial HP modeling (c). Lateral HP modeling (d). Medial and lateral HPs share the location, the orientation and the bL factor.
In this representation, the HP is completely described by 8 parameters, namely 3 rotation parameters, 3 translation parameters and 2 canonical form factors (a, b). Parameters a and b can be regarded as the roundness features of the shape. Without lack of generality, in our case a encodes the roundness in medio-lateral direction whereas b encodes the roundness in antero-posterior direction. The greater the value, of both a and b, the lower the roundness is. aG and bG parameters encode the roundness of the global HP. For the two local HPs, aLm and aLl encode the roundness in medial–lateral direction of the medial and the lateral trochlear facets, respectively. By formulation, the increase of the value aLm (aLl) corresponds to a decrease of the medial (lateral) facet roundness and vice-versa. The two local HPs share the same bL parameter.
The HP parameters (a, b) are not scale invariant. When applying an isotropic scaling transform s to TS, the estimated parameters approximately vary with squared root of s. This means that the differences, across the patients, of the estimated parameters can be affected by the absolute size of the distal femur. In order to remove this bias, assuming that the most relevant dimension is the medial–lateral size and taking the first femur surface as a reference, each femur surface was scaled by the ratio between its medial–lateral size and that one of the reference surface.
The HP fitting problem was solved starting from an initial guess of the 8 parameters computed by closed-form solution in the least-square sense.[Citation7] Then, the parameters were refined using a custom-made iterative optimization algorithm, based on evolution strategies.[Citation25] Residual fitting errors were measured for global and local HPs by computing the distance distributions of the surface points to the estimated models. In order to evaluate the normal/abnormal classification ability of each HP parameter, a statistical analysis using a Wilcoxon rank sum test (p value <0.05) was adopted. In case of significant differences, the optimal classification cut-off value was attained by maximizing the Youden index J on the corresponding ‘Receiver Operating Characteristic’ curve.[Citation8] Furthermore, in order to examine whether the Dejour severity grades could be correlated with the HP parameter ranges, the abnormal subgroup (20 patients) was further subdivided in three subgroups according to the identified (A, B, C) grades. Kruskal–Wallis test (p value <0.05) and Scheffe’ post-hoc comparison procedures were applied for the analysis.
Results
Relation between HP parameters andclinical-based classification
The variations of the estimated global HP parameters as a function of the isotropic scaling applied to the TS showed the dependency on the scale and justified the scaling transform (). Scale variations of 30% lead to parameter variations up to approximately 20%.
Table 1. Variations of the estimated global HP parameters as a function of the isotropic scaling applied to the sample trochlear surface of the sample patients.
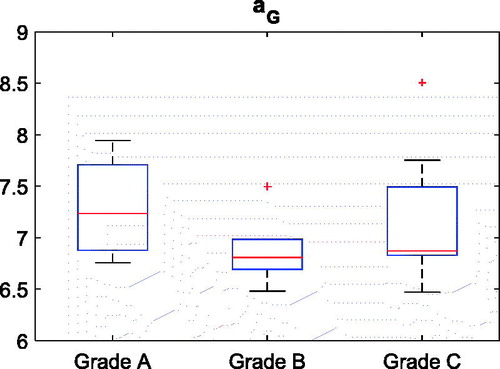
Small residual errors (0.76 ± 0.21 mm) and (0.54 ± 0.15 mm) were found for the global and local HP data fitting, respectively, demonstrating that the ventral aspect of the trochlear facet features very well a HP profile. The aG (global medial–lateral roundness) parameter distributions between the normal (aG, healthy) and the abnormal (aG, dysplastic) groups, as provided by the clinical-based classification, were statistically different (p value = 10−6). As expected, bG (global anterior–posterior roundness) was unable to significantly discriminate (p value >0.80) the trochlear morphology of the normal and the abnormal groups (). The optimal (maximum Youden index) cut-off value (6.4) for aG ensured the best sensitivity (Se =1) and high specificity (Sp =0.87). The (bG, aG) plot emphasized the partition along the aG coordinate (). The decrease of the medial–lateral global flatness was captured by a monotone increase of the aG parameter (). No significant (p value =0.38) relation between aG and the three severity grades could be detected though ().
Figure 4. Box plots of the aG and bG distributions for the two subgroups, dysplastic and normal. Median and lower–upper percentiles are displayed.
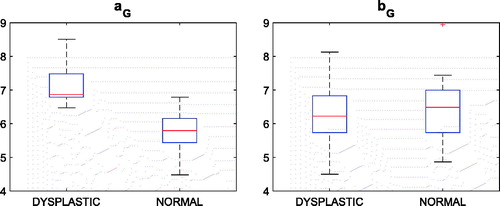
Figure 5. aG versus bG graph along with sample distal femur surfaces. Blue dots indicate patients diagnosed with no dysplasia.
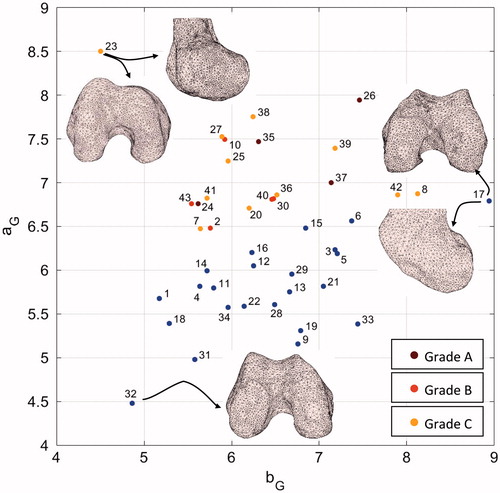
Figure 6. Five distal femur surfaces along with their corresponding aG parameters. A monotonic increase of the parameter corresponds to a decrease of the roundness of the trochlea.
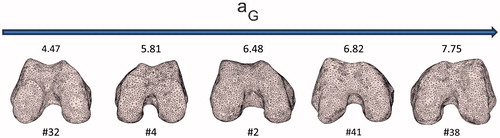
Figure 7. Box plots of the aG distributions of the three dysplastic subgroups (left panel).
Both aLl (local lateral roundness) and aLm (local medial roundness) distributions between the normal and the abnormal groups were not statistically different (p value = 0.48; p value = 0.91), while the variability in the abnormal group was sensibly higher than that of the normal group for both aLl and aLm parameters (). The normal morphology of the trochlea was encoded into a narrow range of the medial (3.2–6.2) and lateral (6.0–8.4) facet roundness, whereas the abnormal morphology spanned lower and higher values of both aLl and aLm. This result can be graphically appreciated in the (aLl, aLm) plot ().
Figure 8. Box plots of the aLl and aLm distributions for the two subgroups, dysplastic and normal. Median and lower–upper percentiles are displayed.
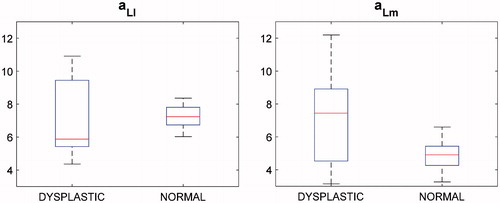
Figure 9. aLm versus aLl graph along with sample distal femur surfaces. Blue dots indicate patients diagnosed with no dysplasia.
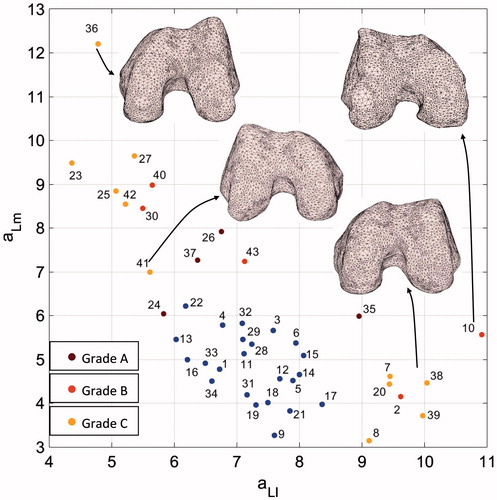
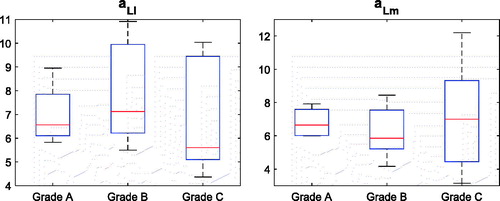
For the normal morphology, the lateral facet was flatter, on average aLl = 7.2, than the medial one, on average aLm = 4.8. As far as abnormal morphology is considered, the (aLl, aLm) pair distribution was spread mainly across two different sub-regions of the plane. Remarkably, values of the aLl parameter higher (>8.5) than the values of the normal subgroup were coupled to low aLm values, pretty similar to the values of the normal subgroup. In contrast, lower (<7.2) aLl values matched to aLm values ranging from about 6.1 to 12.2. As far as the severity grades are concerned, neither aLl nor aLm were able to discriminate among them () providing no statistical inter-grade differences (p value = 0.52; p value = 0.76).
Figure 10. Box plots of the aLl and aLm distributions of the three dysplastic subgroups.
Consistency of the HP parameters with the trochlear morphologies
In order to prove the consistency of the estimated parameters of the HPs with the trochlear morphologies, we qualitatively compared such parameters to the trochlear aspect of some relevant cases. Considering aG and bG parameters, convincing examples are reported in . The bG parameter of patient #17, being the highest value in the dataset, was coherent with the flat anterior–posterior geometry of the two condyles. Patient #23, diagnosed with C grade, because of a major medial hypoplasia associated to an abnormal convexity of the lateral facet, featured the highest aG value. Remarkably, the same patient featured the lowest bG value, morphologically in agreement with the very marked anterior–posterior roundness of the condyles. Patient #32 featured the lowest aG value consistent with the marked roundness of the trochlea in medial–lateral direction.
Considering aLl and aLm parameters, the greatest aLl (minimum predicted lateral facet flatness) value was attained for patient #10 (Grade B) whose TS had a pronounced lateralization of the lateral facet with a concomitant flatness of the trochlear groove (). The trochlear geometry of the patient #36 (Grade C), characterized by a very sharp lateral facet and a very flat medial facet was consistently encoded by a small aLl and the highest aLm (). The medial and lateral geometries of patient #23 (Grade C) were encoded by the smallest aLl and a pretty high aLm in agreement with the medial hypoplasia and the lateral facet convexity (cfr. ). Different severity grades were attributed to patients with similar (aLl, aLm) pairs. For instance, patients #2, #38, and #39 mainly featured a flat lateral facet () and a reduced medial facet which was interpreted as a hypoplasia for patients #38 and #39 (Grade C). Conversely, while being patient #41 scored with Grade C as well, the estimated local HP parameters differed sensibly, especially aLl.
Discussion and conclusions
Main findings
The two main outcomes of this work can be summarized as follows. First, the ventral aspect of the trochlear morphology can be modeled with high accuracy by HPs, both globally and locally for the medial and lateral sides respectively, as ensured by the obtained small fitting errors. Starting from the 3D surface of the distal femur, the modeling is completely automatic. The main advantage is that the model provides a continuous representation of morphologic variations in HP parameter space taking into account the full geometrical complexity of trochlea unlike the traditional morphometric parameters, as the trochlear depth or the sulcus angle, which basically encode the shape variation into a single axial plane.[Citation2,Citation16,Citation17] This approach is novel in the literature with respect to alternative 3D techniques based on statistical shape models that in contrast cannot easily correlated parameter variations with specific morphologic features.[Citation29,Citation30] Second, we found that similar morphologic anomalies of the trochlear aspect, as encoded by similar HP parameters, are actually attributed to different severity grades in the Dejour classification.[Citation14] This finding is in agreement with recent works in the literature reporting that morphometric parameters can optimistically discriminate between the Grade A and the three remaining grades.[Citation15,Citation16] Equivalently, the Dejour classification was shown to be meaningfully effective in separating low-grade from high-grade cases. There are however two main clinical issues that are not adequately addressed by such a technique. First, in the intermediate cases, when the severity discrimination is unclear, the treatment selection is not systematic, may require additional clinical evaluations, and strongly founds on the personal confidence and experience of the physician. For example, the separation between a mild reduction of the trochlear depth (A) and a flat trochlea is not straightforward as there can be an almost continuous variation in between the two. Also, the C grade, identifying lateral convexity and medial hypoplasia, cannot be satisfactory in identifying cases of evident medial hypoplasia but without a severe lateral convexity. Second, the quantitative evaluation of the morphologic anomaly could lead to elaborate new prognostic methodologies (prediction of patellofemoral instability) and corresponding new therapeutic strategies. We confirmed that there is no direct agreement among the severity grades of the trochlear dysplasia and parameter distributions so that we can restate, in agreement with the literature, that the severity increase has not monotonic correspondence to descriptive parameters of the trochlear morphology.
The proposed surface modeling was based upon the 3D segmentation of the TS,[Citation28] using the MAMP, MALP, DPTG, and DIN landmarks to determine its boundaries in medial–lateral and anterior–posterior directions. As far as aG parameter is concerned, for our dataset we found that it is a reliable index to classify normal versus abnormal shapes with excellent sensitivity and good specificity (cfr. ). As a matter of fact, however no explicit relation could be found between aG and the three considered severity grades (cfr. ). Considering the morphologies of healthy TS, the estimated aLl and aLm values (cfr. ) showed on average a slightly greater flatness of the lateral than the medial facet in agreement with the anatomical difference between the two facets.[Citation11,Citation12] Specific results demonstrated robustness of these two parameters in the description of similar geometries and appropriate sensibility to discriminate even small variations of facet curvature as well (cfr. ). Considering the morphologies of abnormal TS, the results of the estimated aLl and aLm values could not be directly used to discriminate among the severity grades (cfr. ). Nonetheless, they allowed a very consistent description of the two facets in agreement with the visual aspect. For example, considering Grade C subgroup, we found out that, in contrast to what expected, the medial facet could be characterized also by a convexity due to narrow and sharp facet (cfr. , Patient #38). As far as of Grade A is concerned, results allows to come out with the consideration that the Grade A (‘shallow trochlea’) appears more related to the overall flatness (small aG) than the specific facet morphology.
Linking general hyperbolic paraboloid parameters to morphologic anomalies of the TS
Considering the global HP, it can be argued that the lower aG is the greater the trochlear groove flatness is. For the local HPs, the normal trochlear morphology (higher and wider lateral facet) should lead to approximately similar aLm and aLl or a slightly increase of aLl with respect to aLm, in agreement with the general consensus that normal knees have deeper trochlear grooves than abnormal ones, with higher trochlear facet on the lateral side with respect to the medial side. In case of severity Grade A, an increase of the aG, with respect to a normal trochlea, and a corresponding similar increase of both aLm and aLl, can be expected. This trend should be further evident in Grade B. Special cases in this severity grade encompass the increase of the lateral facet flatness and narrowing of the prominence of the medial facet making its ventral profile sharper. In such a case, a decrease of aLm with respect to aLl is expected. A different kind of small morphologic deviation of the trochlea encompasses the narrowing of the groove with concomitant increase of the sharpness of the ventral aspect of one, usually lateral, or both facets. In such a case, classification of the morphologic anomaly suffers from a certain degree of uncertainty meaning that the trochlea cannot be necessarily pathologic although the clinical signs can be interpreted to either Grade A or Grade B. As far as Grade C is concerned, while we can expect a further increase of aG, the values of aLm and aLl are determined by the specific geometry of the corresponding facets. In case of medial hypoplasia without apparent lateral convexity, we can expect that aLm increases whereas aLl can be indistinct from the value of a normal or slightly flat facet. Conversely, the presence of a lateral convexity should sensibly decrease the value of aLl. As shown for the dataset considered in this work, most of the above features were consistently encoded by HP parameters.
Final remarks
Some methodologic issues of the work have to be discussed. We first acknowledge that the anterior knee pain is a generic clinical sign that has not direct correlation with trochlear dysplasia. The idea of the experimental validation over a set of knees with no specific indication for dysplasia was motivated by two factors. First, we did have available a few number of dysplastic cases and in addition not homogenously distributed across sex, age, and dysplastic grades (this will be arranged for future works); second, we wanted to analyze whether the clinical evaluation of the trochlear morphology using CT scans was in agreement with the trochlear morphometry independently on the degree of anomaly. Second, the small patient cohort can reduce the extent of our findings. This is especially relevant for the correlation between HP parameters and dysplasia severity grades as less than 10 patients were present in each subgroup (A, B, C) and no patients were scored with D grade. Future investigations are aiming at increasing the population including additional severe morphologic anomalies of the TS. Third, we found that, when applying an isotropic scaling transform s to TS, the estimated HP parameters approximately vary with the squared root of s (cfr. ). In order to cope with this issue, we applied a priori an isotropic scale to all the surface models accounting just for medial–lateral size. However, this scale disregards the anterior–posterior variability in size across the surfaces, this potentially introducing distortion across two surface models that share similar anterior shapes but dissimilar medial–lateral shapes. Next development steps will take into account anisotropic scales.
In conclusion, the proposed representation of the ventral aspect of the TS, based on only three HP parameters (aG, aLl, aLm), can monotonically encode morphologic variations which can be associated with increasing of the anomaly severity. From the dataset considered in this work, we found a consistent linear separation for the binary classification using a cut-off for aG equal to 6.4 expecting that increasing aG values encode increasing severities. The parameters aLl and aLm map the lateral and medial facet curvature providing information about the morphologic deviation to normality likely associated with higher values of either one or both parameters. We found that no linear separation can be defined to classify healthy against abnormal TS surfaces in the (aLl, aLm) plane while the peculiar obtained distributions could be separated using non-linear methods as the neural networks. While higher values of both lateral and medial curvatures were shown to encode increasing morphologic anomalies, similar combinations of the two values could describe different severity grades in the traditional classification method. While requiring further analysis, this paradigmatic result can arise questions about the reliability of traditional severity classification, based on 2D morphological signs measured on X-ray images, indicating both uncertainty in the grade definition and difficulty to manually discriminate the grades, although performed by radiologic experts, as already extensively reported in the literature.[Citation31]
Ethical approval
The study was approved by Ist Orthopaedic Department, C.T.O. Hospital, Istituti Clinici di Perfezionamento, Milan, Italy.
Disclosure statement
The authors report no conflicts of interest.
References
- Carrillon Y, Abidi H, Dejour D, et al. Patellar instability: assessment on MR images by measuring the lateral trochlear inclination-initial experience. Radiology. 2000;216:582–585.
- Escala JS, Mellado JM, Olona JM, et al. Objective patellar instability: MR-based quantitative assessment of potentially associated anatomical features. Knee Surg Sports Traum Arthr. 2006;14:264–272.
- Merchant A. Classification of patellofemoral disorders. Arthroscopy. 1988;4:235–240.
- Myronenko A, Song X. Point-set registration: coherent point drift. IEEE Trans Patt Anal Mach Intell. 2010;32:2262–2275.
- Teichtahl AJ, Parkins K, Hanna F, et al. The relationship between the angle of the trochlear groove and patella cartilage and bone morphology – a cross-sectional study of healthy adults. Osteoarthr Cartil. 2007;15:1158–1162.
- Beitzel K, Schöttle PB, Cotic M, et al. Prospective clinical and radiological two-year results after patellofemoral arthroplasty using an implant with an asymmetric trochlea design. Knee Surg Sports Traum Arthr. 2013;21:332–339.
- Dai M, Newman TS, Cao C. Least-squares-based fitting of paraboloids. Patt Recog. 2007;40:504–515.
- Fawcett T. An introduction to ROC analysis. Patt Rec Let. 2006;27:861–874.
- Mofidi A, Veravalli K, Jinnah RH, et al. Association and impact of patellofemoral dysplasia on patellofemoral arthropathy and arthroplasty. Knee. 2014;21:509–513.
- Saffarini M, Ntagiopoulos PG, Demey G, et al. Evidence of trochlear dysplasia in patellofemoral arthroplasty designs. Knee Surg Sports Traum Arthr. 2014;22:2574–2581.
- Biedert R, Sigg A, Gal I, et al. 3D representation of the surface topography of normal and dysplastic trochlea using MRI. Knee. 2011;18:340–346.
- Iranpour F, Merican A, Dandachli W, et al. The geometry of the trochlear groove. Clin Orthop Relat Res. 2010;468:782–788.
- Shih YF, Bull AM, Amis AA. The cartilaginous and osseous geometry of the femoral trochlear groove. Knee Surg Sports Traum Arthr. 2004;12:300–306.
- Dejour D, Le Coultre B. Osteotomies in patello-femoral instabilities. Sports Med Arthrosc Rev. 2007;15:39–46.
- Lippacher S, Dejour D, Elsharkawi M, et al. Observer agreement on the Dejour trochlear dysplasia classification: a comparison of true lateral radiographs and axial magnetic resonance images. Am J Sports Med. 2012;40:837–843.
- Nelitz M, Lippacher S, Reichel H, et al. Evaluation of trochlear dysplasia using MRI: correlation between the classification system of Dejour and objective parameters of trochlear dysplasia. Knee Surg Sports Traum Arthr. 2014;22:120–127.
- Pfirrmann CWA, Zanetti M, Romero J, et al. Femoral trochlear dysplasia: MR findings. Radiology. 2000;216:858–864.
- LaPrade RF, Cram TR, James EW, et al. Trochlear dysplasia and the role of trochleoplasty. Clin Sports Med. 2014;33:531–545.
- MacKay JW, Godley KC, Toms AP, et al. Trochlear boss height measurement: a comparison of radiographs and MRI. Knee. 2014;21:1052–1057.
- Monk AP, Choji K, O’Connor JJ, et al. The shape of the distal femur: a geometrical study using MRI. Bone Joint J. 2014;96-B:1623–1630.
- Salzmann GM, Weber TS, Spang JY, et al. Comparison of native axial radiographs with axial MR imaging for determination of the trochlear morphology in patients with trochlear dysplasia. Arch Orthop Trauma Surg. 2010;130:335–340.
- Dornacher D, Reichel H, Lippacher S. Measurement of tibial tuberosity-trochlear groove distance: evaluation of inter- and intraobserver correlation dependent on the severity of trochlear dysplasia. Knee Surg Sports Traum Arthr. 2014;22:2382–2387.
- Biedert R, Bachmann M. Anterior–posterior trochlear measurements of normal and dysplastic trochlea by axial magnetic resonance imaging. Knee Surg Sports Traum Arthr. 2009;17:1225–1230.
- Wright SJ, Boymans TA, Grimm B, et al. Strong correlation between the morphology of the proximal femur and the geometry of the distal femoral trochlea. Knee Surg Sports Traum Arthr. 2014;22:2900–2910.
- Cerveri P, Marchente M, Bartels W, et al. Automated method for computing the morphological and clinical parameters of the proximal femur using heuristic modeling techniques. Ann Biomed Eng. 2010;38:1752–1766.
- Cerveri P, Marchente M, Manzotti A, et al. Determination of the Whiteside line on the femur surface model by fitting high-order polynomial functions to the cross-section profiles of the intercondylar fossa. Comput Aid Surg. 2011;16:71–85.
- Cerveri P, Manzotti A, Marchente M, et al. Mean-shifted surface curvature algorithm for automatic bone shape segmentation in orthopedic surgery planning: a sensitivity analysis. Comput Aid Surg. 2012;17:128–134.
- Cerveri P, Manzotti A, Confalonieri N, et al. Automating the design of resection guides specific to patient anatomy in knee replacement surgery by enhanced 3D curvature and surface modeling of distal femur shape models. Comput Med Imaging Graph. 2014;38:664–674.
- Fitzpatrick CK, Baldwin MA, Laz PJ, et al. Development of a statistical shape model of the patellofemoral joint for investigating relationships between shape and function. J Biomech. 2001;44:2446–2452.
- van Haver A, De Roo K, De Beule M, et al. A statistical shape model of trochlear dysplasia of the knee. Knee. 2014;21:518–523.
- Davidson PA, Rivenburgh D. Focal anatomic patellofemoral inlay resurfacing: theoretic basis, surgical technique, and case reports. Orthop Clin North Am. 2008;39:337–346.