
Abstract
Aim: Coronary artery stenosis readings were predicted in this study on the basis of clinical data for patients with coronary heart diseases using the inverse problem algorithm.
Method: Five factors, including age, BSA (body surface area), MAP (mean artery pressure), sugar AC (ante cibum), and LDL-C (low-density Lipoprotein-Cholesterol) were incorporated into a nonlinear first-order regression fit analysis to develop a prediction equation with sixteen terms derived via a revised inverse problem algorithm implemented through the STATISTICA default regression fit. The clinical data acquired from ninety-three coronary heart disease patients were first normalized to the same domain range of [-1 to +1], and then processed by the above algorithm to find the compromised solution of predicted coronary artery stenosis reading. The actual reading was obtained by weighting the stenosis of three major cardiac artery branches, namely, the left anterior descending artery (LAD) (wi 0.3), left circumflex artery (LCA) (wi 0.3), and right coronary artery (RCA) (wi 0.4).
Result: The derived regression fit possessed the final loss function value Φ = 3.589 and correlation coefficient r2 = 0.892 with variance of 79.55%. Accordingly, forty-five patients with similar syndromes were analyzed to verify the prediction, which exhibited a high coincidence. The LDL-C factor was dominant for the prediction of the largest coefficient in the derived equation, whereas the age factor exhibited a minor contribution to the regression fit. The attempts to reduce the number of influence factors to 4, 3 or 2 for the model simplification yielded the results, whose low linearity and high loss function values reflected their inappropriate setting.
Conclusion: The algorithm proved to be an effective technique for prediction of the potential diagnosis in the medical field.
Introduction
Coronary artery stenosis readings were predicted in this study on the basis of clinical data for patients with coronary heart diseases using the inverse problem algorithm. Globally, the coronary artery disease (CAD) causes the highest mortality [Citation1], while in Taiwan the mortality of heart disease is ranked the second highest after carcinoma. Nevertheless, most of heart diseases are classified as CAD [Citation2]. A proper prediction system would be very instrumental for reducing the potential risk for CAD patients, but vast data arrays available in the health care system lack comprehensive interpretation yet. Numerous researchers have tried to apply various approaches for predicting the above risk based on the patient clinical data. Hachesu et al. predicted the length of stay in hospital for 4948 cardiac patients based on 36 input factors and reached an overall accuracy of 96.4% [Citation3]. Dangare and Apte used fifteen factors to refine the heart disease prediction system that originally included thirteen factors by adding the smoking and obesity factors. They used the neutral network analysis coupled with the decision tree and naïve Bayes classification to attain the prediction accuracy of 100, 99.62, and 90.74%, respectively [Citation4]. Shouman et al. summarized the similar studies from 2003 to 2010 and reported the diagnosis accuracy according to different data mining techniques or heart disease datasets [Citation5]. However, few of them can propose an efficient technique to quantify the contribution from specific factor and still to fulfill clinical verification from medical viewpoint. Among the executable techniques used in the data mining, the inverse problem algorithm is the most lucrative for the potential risk prediction based on bountiful medical information. The quantified index derived on the basis of this algorithm is shown to provide a reliable proof for the clinical research [Citation6,Citation7]. The accuracy of prediction can be effectively improved, provided the input factors are well manipulated and normalized in building up the dataset.
In this study, a revised technique was established to quantitatively predict the coronary artery stenosis readings for heart disease patients according to five clinical factors using the inverse problem algorithm. The factors included age, BSA (body surface area), MAP (mean artery pressure), Sugar AC (ante cibum), and LDL-C (low-density Lipoprotein-Cholesterol). The five factors were normalized in this revised algorithm to eliminate the different dimensions, then the algorithm configuration was established via a computational program run with STATISTICA [Citation8]. The algorithm compiled the data on ninety-three patients, which exhibited a potential coronary heart disease within the past three years (2012-2014), and computed a nonlinear first-order regression fit with sixteen terms, in order to obtain a compromised solution. Furthermore, the coefficient of each term also implied the dominance of the specific factor. The prediction was then verified using the data of another group of forty-five patients with similar clinical syndromes, attaining a high accuracy.
Materials and methods
Revised inverse problem algorithm
Assuming a first-order linear correlation equation to have the form of y=βx+a, then y-a=y*=βx, where y is the expected value, β is the sensitivity of x to y, and a is a constant or the interception for the regressed line to y-axis. Similarly, if the expected value, y, is correlated to a multiple group of factors, M, then the correlation equation can be expressed as follows
(1)
(2)
set ∅ is the standard loss function,
(3)
(4)
(5)
(6)
where V is the coefficient matrix and VT is the transpose matrix of the correlation coefficient. In order to derive an extreme value in the compromised process, the first-order derivative of the standard loss function, Φ, must be zero in EquationEq. (4)
(4) , so that the factor matrix, M, can be obtained by deriving the inverse matrix of (VT·V), according to [Citation9]. The computational analysis is implemented via the STATISTICA default program.
Five factors of clinical data
Five factor readings were included in the revised inverse problem algorithm, defined as (1) A: age, (2) B: BSA (body surface area), (3) C: MAP (mean artery pressure), (4) D: sugar AC (Sugar Ante Cibum), (5) E: LDL-C (low-density Lipoprotein-Cholesterol) and (6) F: predicted coronary artery stenosis reading, i.e., the expectation value. The respective mathematical expression is as follows:
(7)
As follows from EquationEq. (7)(7) , the algorithm configuration was defined to correlate the predicted coronary artery stenosis reading (F) with the other five factors (A–E), according to either individual factors (a1–a5) or the cross-interactions between two factors (a6–a15), resulting in a total of sixteen terms. The matrix of coefficients, V[15 × 15], can be used to derive the compromised solution according to EquationEqs. (2–6), whereas the factor terms, M[15 × 1], need to be normalized to the same domain range from approximately −1 to +1, prior to the program execution. This is required for the algorithm configuration to unify the dominating contributions of the dataset.
The factor reading X* after the normalized conversion takes the following form:
(8)
where X, Xmax, and Xmin are the original unconverted, maximum, and minimum readings of a specific factor (A-E), respectively. For example, the maximum and minimum readings for BSA equaled 2.40 and 1.39 [m2], respectively; thus, the BSA of cases Nos. 20 and 35 were converted from their original values, (1.53 and 2.17), to normalized ones (-0.572 and 0.586), respectively, according to EquationEq. (8)
(8) . The main goal of the normalization process was to create a unified scale ranging from −1.00 to +1.00, so that every specific BSA reading, as well as the readings of other factors, after normalization would fall within that range.
displays the readings of the five factors and actual coronary artery stenosis reading before (original) and after the normalization process [cf. EquationEq. (8)(8) ] for the 93 coronary heart disease patients with the diagnosis made in the Taichung Armed Forces General Hospital, Taiwan from 2012 to 2014. The survey was approved by the permission No. 2-105-05-007 of the Institutional Review Board (IRB) of the Tri-Service General Hospital. The BSA (
[m2]) [Citation10] was included in the correlation analysis, since human metabolic mechanisms are known to be strongly correlated with BSA. Large BSA and BMI values are interpreted as high fluid and solute turnover rates in human patients [Citation11]. The MAP is defined as the average pressure in the patient arteries during one cardiac cycle, which is considered to be a better indicator of perfusion to vital organs than the systolic blood pressure. The MAP was calculated as (SBP +2•DBP)/3, whereas SBP and DBP implied systolic and diastolic blood pressures, respectively [Citation12]. Nevertheless, age, sugar AC and LDL-C were essential factors in predicting the coronary heart disease, as reported by numerous researchers [Citation1–5]. As shown in , the readings in each normalized column vary between −1.00 and +1.00 and thereby provide equal contributions to the computational algorithm.
Table 1. The readings of the five factors and actual coronary artery stenosis reading before (original) and after the normalization process [cf. Eq. (8)] for the 93 coronary heart disease patients with the diagnosis made in the Taichung Armed Forces General Hospital, Taiwan from 2012 to 2014. The last column shows the predicted coronary artery stenosis reading.
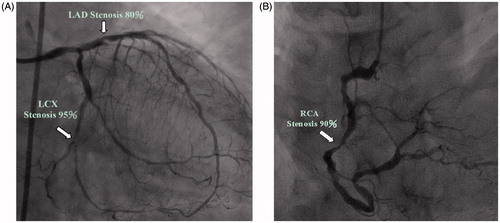
depicts a typical sample of coronary heart disease patient (case no. 17 in ) who got the cardiac diagnosis in the Cardiac Catheterization Laboratory. The three major arteries are: the right coronary artery (RCA) and two major branches of the left coronary artery, i.e., the left anterior descending artery (LAD) and left circumflex artery (LCA). The coronary artery stenosis reading is defined as the sum of 30% of LAD, 30% of LCA, and 40% of RCA. Thus, the reading is 89% (0.3 × (80%+95%) + 0.4 × 90% = 89%), which corresponds to the converted value of 0.917 after normalization by the computational algorithm.
Figure 1. A typical sample of coronary heart disease patient (case no. 17 in ) who got the cardiac diagnosis in the Cardiac Catheterization Laboratory. The three major arteries are: the right coronary artery (RCA) and two major branches of the left coronary artery, i.e., the left anterior descending artery (LAD) and left circumflex artery (LCA).
STATISTICA program
In this study, the revised inverse problem algorithm was implemented via the STATISTICA program [Citation8]. The correlations of the factors [cf. EquationEq. (7)(7) ] were determined and defined as nonlinear models, nonlinear estimations, and user-specified regressions with customized loss functions, in order to perform the numerical analysis using the normalized data of 93 patients. The actual coronary artery stenosis readings were the expectation values of the computational results. Therefore, 1488 individual data points [(15 + 1) × 93 = 1488] were included in the algorithm, in order to optimize the compromised solution array [93 × 1= 93] of the coronary artery stenosis readings. In addition, sixteen items, including one constant, were used in the algorithm to identify any correlation of the factors. The loss function was defined as the total deviation between the predicted and actual coronary artery stenosis readings for all 93 patients.
Results
shows the derived coefficients of all sixteen terms from the STATISTICA computation analysis. The ranks of the normalized coefficients are also listed for reference. The final loss function (Φ) and correlation coefficient (r2) were 3.589 and 0.89191, respectively with the variance of 79.55%. As is seen from , LDL-C is the most dominant factor, in view of its high-contribution coefficient of 1.17. Prior to input, all factors were normalized to the range [−1.0 to +1.0] via the computational algorithm (cf., EquationEq. (8)(8) ), so that the derived coefficients could be interpreted as adjustable amplitudes of the respective factors, in order to manipulate the STATISTICA compromised solution. Accordingly, MAP and BSA were the secondary dominant factors, whereas age factor barely contributed to the prediction. The negative coefficient, −0.085, for Sugar AC factor confirmed the well-known medical indication that low Sugar AC can suppress the coronary artery stenosis. The ability of this revised algorithm to analyze not just factors, but their possible cross-interaction as well, has significantly accelerated the convergence of STATISTICA computational analysis and made it possible to reached a high coincidence with r2 = 0.89191.
Table 2. The derived coefficients of all sixteen terms from the STATISTICA computation analysis. The ranks of the normalized coefficients are also listed for reference.
The last column of the shows the predicted coronary artery stenosis readings. The data were calculated using the revised inverse problem algorithm [cf. EquationEqs. 2–6]. The predicted data coincided well with the actual readings [, column 7] indicating that the algorithm exhibited neither systematic errors in the primary definition, nor any runtime errors during the analyzing process.
Discussion
Clinical verification
The second group of data was obtained from 45 patients with similar symptoms, in order to verify the derived algorithm. The age, BSA, MAP, Sugar AC and LDL-C t-test results indicated the absence of any significant differences between the two groups. The age, BSA, MAP, Sugar AC and LDL-C two tailed p-value were equal to 0.67, 0.99, 0.38, 0.79 and 0.54, respectively. displays the data of 45 coronary heart disease patients used for verification. As shown in , some of the readings, including MAP or LDL-C, become mostly negative after normalization. This can be attributed to the fact that the acquired data are close to the minimum readings of those specific factors in the original group [cf. ]. The predicted coronary artery stenosis readings and their relative discrepancies (%) from the actual ones are listed in the last two columns of . The average discrepancy between the predicted and actual reading is 10.5 ± 7.9%.
Table 3. The data of 45 coronary heart disease patients used for verification. The predicted coronary artery stenosis reading and its relative discrepancy (%) from the actual reading are listed in the last two columns. The average and standard deviation of the discrepancies between predicted and actual reading is 10.5 ± 7.9%.
Manipulating the dominant factors
The five assigned factors can be expanded into sixteen terms of nonlinear first-order regression equation fit (cf. EquationEq. (7)(7) ) for predicting the coronary artery stenosis readings and nearly reach the analytical limit in the STATISTICA program. The analytical threshold of computational frame structure was also referred by other researchers [Citation12]. If the same number of coefficient terms is kept, but the “sugar AC” factor is replaced by “smoking” factor (defined as cigarette pack/day × smoking year), the results will be changed yielding the final loss function value Φ = 4.0917 and correlation coefficient r2=0.87571 with the variance of 76.685%. Apparently, the inappropriate factor mining might result in the incorrect prediction. The number of factors used in the revised algorithm can be reduced, in order to simplify the analysis. The five factors are regrouped to three cases as: (1) four factors, such as age, BSA, MAP, and LDL-C to form the eleven-terms’ correlated equation, (2) three factors, such as BSA, MAP, and LDL-C to form the seven-terms’ equation, and (3) two factors, MAP and LDL-C, to form the four-terms’ equation. The above three equations are reduced to
(9)
(10)
(11)
In contrast, the final loss function value (Φ), correlation coefficient (r2), and variance are depicted via four factors as: 4.3493, 0.86728, 75.218%; three factors: 4.5834, 0.85954, 73.881%; and two factors: 4.7434, 0.85424, 72.973%, respectively. Minimizing the number of adopted factors deteriorates the prediction accuracy and increases the loss function, which should ideally approach zero in the computational analysis [cf. EquationEqs. (3(3) ,Equation4
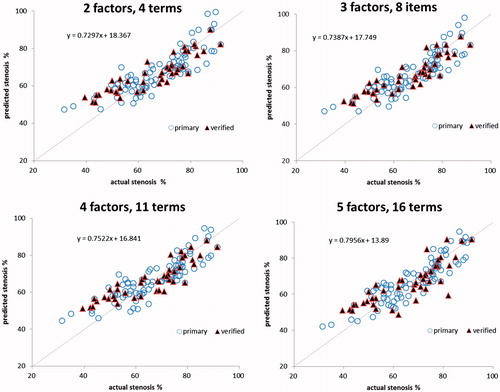
(4) )]. illustrates the four plots linking the actual and predicted coronary artery stenosis readings for the original and verification groups, according to different numbers of factors and expanded terms. The regression lines of the actual and predicted coronary artery stenosis readings of five factors and sixteen terms imply a high degree of agreement, which is specified by the derived correlation coefficient r2. A perfect straight line corresponds to r2 =1.00 whereas that obtained in this study is also quite high (r2 = 0.876). A linear dependence between the predicted and actual readings can be represented by the predicted-to-actual reading ratio and interpreted by the linear regression fit, as is shown in . A perfect linearity has the ratio of 1.0 implying a perfect fit between the actual and predicted readings. In this study, this ratio was reduced from 0.7956 to 0.7522, 0.7387, and 0.7297, when the number of influencing factors was reduced from 5 to 4, 3, and 2, respectively. Therefore, five factors with sixteen terms of a nonlinear first-order equation provide a compromised option satisfying either the maximal analytical ability of the preset STATISTICA program or a highly accurate prediction of the coronary artery stenosis readings.
Figure 2. The four plots linking the actual and predicted coronary artery stenosis readings for the original and verification groups, according to different numbers of factors and expanded terms.
Conclusion
Prediction of coronary artery stenosis readings on the basis of clinical data of coronary heart diseases patients was performed using the revised inverse problem algorithm, and the respective nonlinear first-order regression fit was conducted. Five factors, such as age, BSA, MAP, Sugar AC, and LDL-C, were assigned to derive correlation between the actual and predicted coronary artery stenosis readings with sixteen terms/coefficients. The dataset was constructed for the original 93 coronary heart disease patients and then verified by another group of 45 patients with similar syndromes. The final loss function value (Φ) and correlation coefficient (r2) value were 3.589 and 0.892, respectively with the variance of 79.55%. This can be interpreted as an excellent fit between the actual and predicted readings. The algorithm proved to be an effective technique for prediction of the potential diagnosis in the medical field.
Acknowledgements
The authors would like to thank the Ministry of Science and Technology, contract No. 103-2221-E-166-003-MY3 and the Taichung Armed Forces General Hospital, Contract No. 103A06 for financially supporting this research.
Disclosure statement
No potential conflict of interest was reported by the authors.
Additional information
Funding
Reference
- World Health Otganization, The top 10 causes of death, 2007. Available from: http://www.who.int/mediacentre/factsheets/fs310/en/
- Drugs & Diseases, Cardiology, Risk factors for coronary artery disease, 2016. Available from: http://emedicine.medscape.com/article/164163-overview
- Hachesu PR, Ahmadi M, Alizadeh S, et al. Use of data mining techniques to determine and predict length of stay of cardiac patients. Healthc Inform Res. 2013;19:121–129.
- Dangare CS, Apte SS. Improved study of heart disease prediction system using data mining classification techniques. Int J Comp Appl. 2012;47:44–48.
- Shouman M, Turner T, Stocker R. Using data mining techniques om heart disease diagnosis and treatment. Paper presented at the Japan-Egypt Conference on Electronics, Communications and Computers, IEEE, 2012. p. 189–193. Available from: http://dx.doi.org/10.1016/j.radonc.2011.08.029
- Mozaffarian D, Micha R, Wallace S. Effects on coronary heart disease of increasing polyunsaturated fat in place of saturated fat: a systematic review and meta-analysis of randomized controlled trials. Plos Med. 2010. Available from: http://dx.doi.org/10.1371/journal.pmed.1000252.
- Roerecke M, Rehm J. Irregular heavy drinking occasions and risk of ischemic heart disease: a systematic review and meta-analysis. Am J Epidemiol. 2010;171:633–644.
- STATISTICA version 10, 2017. Available from: http://www.statsoft.com/Products/STATISTICA-Features/Version-10
- Inverse problem algorithm, 2015. Available from: https://en.wikipedia.org/wiki/Inverse_problem
- Body Surface Area, 2017. Available from: https://en.wikipedia.org/wiki/Body_surface_area
- Koyfman A, Ng C, Foran MP. Pediatric Dehydration, 2016. Available from: http://emedicine.medscape.com/article/801012-overview
- Pan LF, Davva O, Chen CY, et al. Quantitative evaluation of contrast-induced-nephropathy in vascular post-angiography patients: feasibility study of a semi-empirical model. BME. 2015;26:s851–s860.