
Abstract
Three-dimensional simulations of coronary artery using finite element analysis are considered as effective means to understand the biomechanical properties after the stent was deployed. Bioresorbable vascular scaffolds are new-generation stents used by people. Intravascular optical coherence tomography is an emerging technique for detecting struts. The common 3 D reconstruction methods are using Intravascular Ultrasound (IVUS) or angiographies. However, it loses the details about geometry model. Fusing of optical coherence tomography and angiography to reconstruct the bioresorbable stented coronary artery based on patient-specific mode is an innovative method to reconstruct the high fidelity geometry. This study aimed to use computer-aided design models and computational fluid dynamics research tools to conduct a systematic investigation of blood flow in an isolated artery with realistically deployed coronary stents. Some important hemodynamic factors such as wall shear stress, wall pressure and streamline were calculated. The doctors could evaluate the local hemodynamic alterations within coronary arteries after stent deployment by reconstructing the high-fidelity geometry about each clinical case.
1. Introduction
Coronary artery disease is a leading cause of death in the Western countries [Citation1]. The narrowing of vessel lumen is the major cause of coronary artery disease because of atherosclerotic plaques. The percutaneous coronary intervention is commonly used for treating coronary artery disease. Hundreds of thousands of patients undergo stent implantation every year. Stents are tiny tube-like devices that are designed to keep the vessel open. The new-generation stents are called bioresorbable vascular scaffold (BVS) [Citation2], which significantly decrease intimal hyperplasia. Bioabsorbable drug-eluting vascular scaffolds are a novel approach that provide transient vessel support with drug delivery capability without the long-term limitations of metallic drug-eluting stents such as permanent caging with or without malapposition [Citation3]. They are fully absorbed later and reduce the risk of stent thrombosis. There are two major hemodynamic stresses imposed at the blood arterial wall interface by flowing blood: the wall shear stress (WSS) acting tangentially to the wall, and the wall pressure (WP) acting normally to the wall [Citation4]. The wall pressure gradient is one of the motive forces for blood flow. The importance of spatial wall pressure gradient (WPG) or else called static wall pressure gradient, is a new concept that be investigated by many researchers in the last few years [Citation5]. Variations in the local hemodynamic environment after bioresorbable stenting result in alterations of wall shear stress (WSS) [Citation6], wall pressure, and streamline, which can invoke a different response around the stent struts. The flow of blood is derived from the heart contraction and the shrinkage of the wall. Clinical investigations suggest that time-varying hemodynamic forces during the cardiac cycle are also related to the growth of atherosclerotic plaques.
Intravascular optical coherence tomography (IVOCT) [Citation7] has been used for automatic stent strut detection. It is an alternative to the intravascular ultrasound that has limited spatial resolution and consists of many kinds of noises, making it hard to segment the struts precisely. It provides an extremely high axial resolution (10–16 µm) and better signal-to-noise ratio compared with intravenous ultrasound. It allows an acquisition speed of 100–160 frames/s and a high pullback speed. Most of the BVS struts have box-shaped black cores. The boundary of BVS struts usually reflects the bright light. These significant optical characteristics help detect the BVS struts effectively. Coronary angiography [Citation8] is a procedure that uses x-ray images to detect blockages in the coronary arteries that are caused by plaque buildup. However, it lacks the details of vascular cross-section information.
Patient-specific studies use an artery or a stent model. Each patient-specific case focuses on the three-dimensional (3 D) reconstruction methodology and results in a unique hemodynamic factor to evaluate the effectiveness of the percutaneous coronary intervention and provide a comprehensive understanding of the hemodynamic changes in an artery after stenting. Several studies on the hemodynamics in coronary arteries have been presented in the last 20 years. Morlacchi et al. [Citation9] used image-based reconstructions to simulate the hemodynamics in coronary bifurcations. Eric et al. [Citation10] investigated the hemodynamic changes associated with stent malapposition in an idealized coronary artery. Balossino et al. [Citation11] illustrated the effects of different stent designs on local hemodynamics in stented arteries. Berry et al. [Citation12] performed the flow evaluation of coronary stents. However, most researchers studied straight and curved stented arteries under ideal conditions. Some important factors were not taken into account in the experiments, such as the strut thickness and lumen profile. Therefore, the studies could not provide a comprehensive understanding of the hemodynamic changes in the realistic artery.
This study aimed to improve the knowledge of the hemodynamic changes in the patient-specific bioresorbable stented coronary artery using 3 D reconstruction of coronary artery. The real model could provide a better environment to carry out the experiments. Computer-aided design models and computational fluid dynamics (CFD) research tools by fusing the OCT and angiography were used to conduct a systematic investigation of blood flow in isolated and realistically stented coronary artery. The changes in WSS, wall pressure, and streamline were the major hemodynamic factors explored in this study.
2. Methods
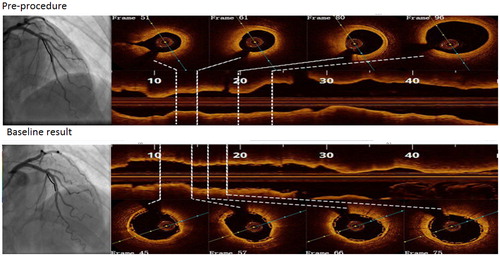
The OCT and angiography image data were obtained from the Department of Cardiology, Shanghai Tongji Hospital of Tongji University, Shanghai, China. OCT images were acquired using the commercial C7-XR Fourier-Domain OCT system (St. Jude Medical, St. Paul, MN, USA) with a C7 Dragonfly catheter (St. Jude Medical). The pullback speed was 18 mm/s, resulting in a data frame rate of 180 frames/s. The left anterior descending(LAD) branch of the coronary artery was studied in this paper. The implanting position of the bioresorbable stent is at the proximal-middle segments of LAD. The length of the bioresorbable stent was 28 mm. Four frames in each segment of interest from two IVOCT pullbacks are compared in .
Figure 1. Selected optical coherence tomographic cross sections of coronary artery lumen matching the centerline of coronary angiography.
A novel methodological approach to analyze the numerical simulation of hemodynamics in bioresorbable stented coronary artery based on the patient-specific model was proposed. The processed OCT images were fused with the angiographic data. The methodological approach has five steps.
The lumen borders in OCT images and bioresorbable stent struts were detected using the automatic segmentation method. An automated characterization method is used that is based on region-growing to detect the newly implanted BVS struts.
The patient-specific luminal centerline of the angiogram was extracted. The middle points of the cross section were selected as the center line points. The centerline was extracted by connecting the middle points.
The detected lumen borders were placed perpendicularly onto the path based on the centroid of each lumen border [Citation13].
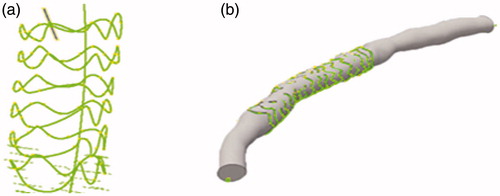
The coronary artery models were created using the 3D computer-aided design software Autodesk Inventor Professional (2017) that is shown in .
Figure 2. (a) 3 D model of the stent comprising the stent point cloud. (b) The coronary artery models were created by fusing optical coherence tomography and angiography.
Inflow boundary conditions were implemented and CFD analysis was performed using the finite-element model.
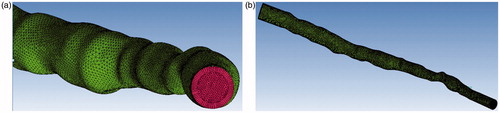
The smoothing operation was performed on the reconstructed coronary artery. The final two models were exported in STL format. ANSYS ICEM CFD v.15 (ANSYS Inc., Canonsburg, PA, USA). was used to perform volume meshing. Hexahedral meshes were generated for the vascular wall, and the lumen of the coronary artery was divided into tetrahedral and hexahedral elements. Meshes () were created successfully. The fluid domain of the stenosed case was discretized using 397486 tetrahedral meshes and 187720 hexahedral meshes. The total number of volume meshes generated from the stented case was 1327848.
Figure 3. (a) Local enlargement of volume meshes. (b) 3D geometry of the coronary artery.
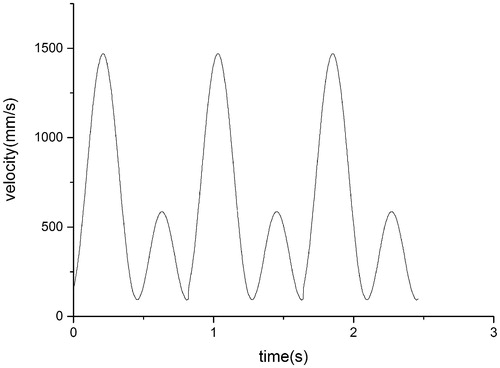
In the present study, blood was assumed to be an adiabatic, incompressible, unsteady Newtonian fluid with a constant density of 1060 kg/m3 and dynamic viscosity of 3.5 × 10⁻³ Pa ⋅ s. The vessel wall was assumed to be rigid. Flow conditions at the arterial wall were assumed to be no-slip, and a zero-pressure boundary condition was applied at the outlet. The period of a cardiac cycle was 0.8 s, and the heart beat was about 75 beats/min. The coronary artery blood flow was 250 mL/min when the patients were at rest. The profile of shape in this study was adapted from the report of Poon E K [Citation10], and the profile of value was adjusted according to the physiological lumen form. The profile of inlet flow waveforms in this study is shown in .
Figure 4. Profile of inlet flow waveforms during the cardiac cycle.
The incompressible Navier–Stokes equations were solved using finite volume methodology. The numerical simulation was based on a 3 D Navier–Stokes equation and the continuity equation.
(1)
(2)
where ‘ρ’ stands for blood density, ‘t’ for time, ‘p’ for blood pressure, ‘U’ for velocity vector, and ‘μ’ for the viscosity of blood.
The haemodynamic characteristics of coronary artery were assessed using three fundamental metrics such as wall shear stress, wall pressure and streamlines. Wall shear stress is the component of stress coplanar with a material cross section. It arises from the force vector component parallel to the cross section and exerted on arterial walls and stent struts. The WSS was computed as:
(3)
where ‘τt’ is the wall traction vector calculated from the stress tensor and ‘n’ is the surface normal [Citation14].
The local magnitude for the spatial WPG (N/m3) is proposed to be an important initiating factor for atherosclerosis and intimal hyperplasia development. The spatial gradient of the wall pressure (WPG) is defined as
(4)
where p is the wall static pressure [Citation5]. The parallel calculation was used to reduce the calculation time.
3. Results
The lumen contour and stent struts were detected automatically. The 3 D model of the stent comprising the stent point cloud is shown in . The coronary artery solid models were created by fusing optical coherence tomography and angiography successfully. Simulations were performed over three complete cardiac cycles with a constant time step size of 10−6 s (i.e., 1600 time steps per cardiac cycle). The flow field was unsteady and laminar. As the flow field soon reached a statistically converged state after the second cardiac cycle, the presented numerical results were collected. For instantaneous quantities, six time points represented by (I)–(VI) were selected, as shown in . These six time points encompassed the important stages of one cardiac cycle and were marked by wide variations in flow velocities that were chosen to compare the calculation results of WSS, wall pressure, streamlines, and velocity in two patient-specific coronary artery models, in which one was stenosed and the other was stented. The local enlargement of coronary artery stenosis and the downstream segment was shown in .
Figure 5. Coronary artery stenosis (a) and downstream segment (b).
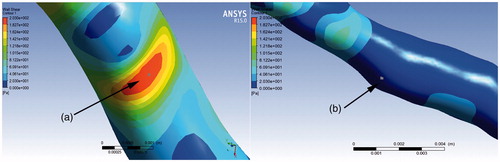
The distribution of WSS in point A and B of two patient-specific model were shown in . Considering the cases without a stent, the WSS from the entrance to the export showed a gradual decline in the trend as a whole. High WSS was located in the stenosed segment. The maximum WSS appeared at t = 1.85 s in the narrowest blood vessels, and the relevant value was 201.92 Pa. The upstream and downstream of the narrow part showed the low WSS. The gradient of WSS in the direction of narrow vessel segment was larger. In a cardiac cycle, the WSS was mostly below 1 Pa at point B of the downstream narrow segment. The WSS in a cardiac cycle was highly correlated with the flow rate. The higher the flow rate, the larger the WSS. The difference in WSS at systolic and diastolic peaks was 146.68 Pa at point A. Considering the stented case, the WSS at point A was lower than before and the WSS was 28.63 Pa when the blood flow velocity was the fastest. The gradient of wall shear stress in the direction of the vascular segment slowed down. The range of the WSS was 1–3 Pa in the entire cardiac cycle at point B. The WSS around the stent struts was higher than that in the surrounding of the vascular segment. The wall shear stress distributions in the four conditions were shown in .
Figure 6. WSS at different moments of isolated and realistically stented coronary artery.
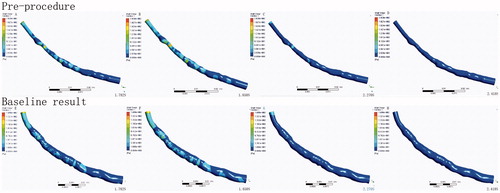
Table 1. Distribution of WSS at points A and B (refer to ) of two patient-specific models.
Diagram for the wall pressure in the four conditions were shown in . It showed a greater pressure on the inlet wall, and the wall pressure decreased as the wall increased from the inlet.
Figure 7. Wall pressure at different moments of isolated and realistically stented coronary artery.
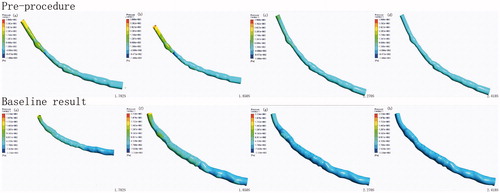
In the cases without a stent, the maximum wall pressure appeared at t = 1.85 s on the inlet wall. The wall pressure declined rapidly from the inlet to the stenosis segment, but increased at the inlet, and the pressure gradient was larger in the stenotic region of the vessel. However, in the downstream of the arterial stenosis, the wall pressure was smaller at each time and the pressure gradient was smaller. In the stented case, the wall pressure was more uniform and the WSS value was about 200 Pa.
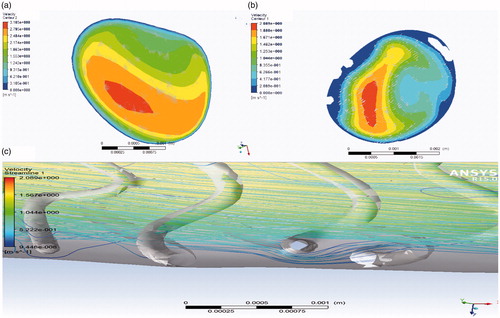
The blood flow in the arterial blood was in the form of laminar flow where the velocity at the center was fast and that on the vascular wall gradually slowed down. In the systolic phase, vortex emerged gradually in stenosis and downstream segment, and became more obvious as the entrance speed increased. In the diastolic phase, the characteristics of inertial flow in the arterial blood vessels appeared obviously and systolic vortex flow continued to exist. The vortex of the implanted stent reduced. Blood flow velocity changed slightly. The stent struts behaved as an obstacle to the blood flow, inducing a ripple effect on the streamlines (). Blood flow at the center of the lumen was faster than that on the tube wall. The flow velocity of the lumen was slow after the stent was deployed.
Figure 8. (a and b) Comparison of blood flow velocity of isolated and realistically stented coronary artery at point A. (c) Obstacle to the blood flow around the stent struts on the streamlines.
4. Discussion
A quantitative validation of automatic image segmentation, stent strut detection, and semi-automatic 3 D geometry reconstruction of the coronary phantom with an implanted stent was performed based on the fusion data obtained by OCT and angiography in this study. It could possibly analyze the hemodynamics in a specific clinical case to evaluate the success of PCI. The altered distribution of WSS, wall pressure, and streamline were simulated by using the most advanced computational tools after the stent was deployed. This method could improve the accuracy of the hemodynamic analysis. The WSS of the vessel wall was generally considered to be one of the most important hemodynamic factors that affected the changes in vascular endothelial cell morphology, structure, and function. Narrow vascular segments produced high WSS easily. It was easy to damage the intima and promote platelet aggregation, leading to atherosclerosis. The low WSS appeared in the region of the narrow downstream long term, resulting in the accumulation of lipid in the region, thus leading to lipid deposition in the subcutaneous layer, and smooth muscle cell migration and proliferation. The shear stress remained in the proper range after implantation of the stent, but varied little along the vessel segment and blood flow velocity. Experiments showed that implanted bioresorbable stents could alleviate high and low WSS.
In the cases without a stent, the wall pressure gradient of the downstream decreases resulting in the blood flow slows down, which in turn reduces the downstream blood flow volume. It may cause atherosclerosis due to the lack of blood supply for a long time. After the stent was deployed, the wall pressure is more uniform. The more uniform wall pressure gradient makes the blood flow more uniform, so that the downstream blood supply is sufficient. The possibility of atherosclerosis is greatly reduced.
Blood flow slows down, leading to downstream blood flow reduction because of vascular stenosis that results in decreased downstream pressure gradient. Downstream organizations may lead to various types of cardiovascular disease due to long-term lack of blood supply. After implantation of the stent, the vascular wall pressure gradient distribution is more uniform. A positive correlation exists between the inlet velocity and wall pressure. The vortex in the stenosis after implantation of the stent is reduced, the blood flow rate is more uniform, the kinetic energy loss is less, and the possibility of atherosclerosis is reduced.
There are two limitations in this study which have to be indicated. Firstly, the rigidity of the vessel wall is not considered as in the study although we restore the realistic geometry of the vessel. Secondly, the profile of inlet flow waveforms and flow boundary conditions were not patient specific.
5. Conclusions
This study presented a novel method to reconstruct the patient-specific model of isolated and deployed stented coronary artery by fusing optical coherence tomography and angiography. The numerical simulation of hemodynamics was carried out with the construction of patient-specific model of coronary artery through images that were routinely acquired during PCI. Distribution and changes in WSS, WP, and streamline in the blood flow field were obtained. The vortex of the stenosis after implantation of the stent was reduced. Experiments showed that implanted bioresorbable stent could alleviate high WSS. It has been proven to be an important tool to test mechanical properties of the stent. The doctors could evaluate the local hemodynamic alterations within coronary arteries after stent deployment by reconstructing the high-fidelity geometry about each clinical case. This study also provided a “proof-of-concept” that ‘bioresorbable vascular scaffold’ is a good product to treat the coronary artery disease. These reconstruction and CFD analyses methods will be useful in future studies with a larger patient population to study in-stent restenosis in the bioresorbable vascular scaffolds.
Additional information
Funding
References
- Joshi R, Cardona M, Iyengar S, et al. Chronic diseases now a leading cause of death in rural India—mortality data from the Andhra Pradesh Rural Health Initiative. Int J Epidemiol. 2006;35:1522–1529.
- Cassese S, Byrne RA, Ndrepepa G, et al. Everolimus-eluting bioresorbable vascular scaffolds versus everolimus-eluting metallic stents: a meta-analysis of randomised controlled trials. Lancet. 2016;387:537–544.
- Serruys PW, Onuma Y, Ormiston JA, et al. Evaluation of the second generation of a bioresorbable everolimus drug-eluting vascular scaffold for treatment of de novo coronary artery stenosis: six-month clinical and imaging outcomes]. Circulation. 2010; 122:2301–2312.
- Liu B, Zheng J, Bach R, et al. Correlations of coronary plaque wall thickness with wall pressure and wall pressure gradient: a representative case study [J]. Biomed Eng Online. 2012; 11:43.
- Giannoglou GD, Soulis JV, Farmakis TM, et al. Wall pressure gradient in normal left coronary artery tree. Med Eng Phys. 2005; 27:455–464.
- Ladisa JF, Olson LE, Hettrick DA, et al. Axial stent strut angle influences wall shear stress after stent implantation: analysis using 3D computational fluid dynamics models of stent foreshortening. Biomed Eng Online. 2005;4:59-59.
- Huang D, Swanson EA, Lin CP, et al. Optical coherence tomography. Science. 1991;254:1178
- Mohr FW, Matloff J, Grundfest W, et al. Thermal coronary angiography: a method for assessing graft patency and coronary anatomy in coronary bypass surgery. Ann Thorac Surg. 1989;47:441–449.
- Morlacchi S, Colleoni SG, Cárdenes R, et al. Patient-specific simulations of stenting procedures in coronary bifurcations: two clinical cases. Med Eng Phys. 2013; 35:1272–1281.
- Poon EK, Barlis P, Moore S, et al. Numerical investigations of the haemodynamic changes associated with stent malapposition in an idealised coronary artery. J Biomechanics. 2014; 47:2843–2851.
- Balossino R, Gervaso F, Migliavacca F, et al. Effects of different stent designs on local hemodynamics in stented arteries. J Biomechanics. 2008; 41:1053–1061.
- Berry JL, Santamarina A, Moore JE, et al. Experimental and computational flow evaluation of coronary stents. Ann Biomed Eng. 2000; 28:386–398.
- Athanasiou LS, Bourantas CV, Siogkas PK, et al. 3D reconstruction of coronary arteries using frequency domain optical coherence tomography images and biplane angiography. Proceedings: Engineering in Medicie and Biology Society (EMBC), 2012 Annual International Conference of the IEEE. San Diego (CA): IEEE, 2012. p. 2647–2650.
- Chen WX, Poon EKW, Hutchins N, et al. Computational fluid dynamics study of common stent models inside idealised curved coronary arteries. Comput Methods Biomech Biomed Eng. 2017; 20:671–681.