
Abstract
We introduce and investigate a method to identify the feature point of an electrocardiogram (ECG) to provide real-time and accurate trigger signals for pulsatile ventricular assist devices (PVADs). An important part of this method is an improved data processing algorithm, in which a differential calculator and another a low-pass filtering were added to avoid drift in the original signal and systematically delay caused by physical devices. The method was systematically illustrated in this article and a test-setup was built based on the LabVIEW program development environment. Both simulations and experiments were carried out to demonstrate the merits of the method. Simulated results based on four typical pathological ECG signals confirm the robustness and adaptability of this method. Experimental results verified the benefits of this method with regard to increased accuracy that can pick up the interested signal accurately in a degree of larger than 99%. This improved technology proposed in this research will be greatly beneficial to simultaneous triggering in VADs and eventually to the heart failure recovery.
1. Introduction
Ventricular assist devices (VADs) are used as a bridge between transplantation and recovery time. More specifically, VADs are currently being employed during final destination therapy for heart failure patients, who are not eligible for heart transplantation [Citation1]. Presently, there are two types of VADs available for clinical use, non-pulsatile and pulsatile pumps. The advantages and disadvantages of both types were studied intensively. Saito et al. conclude that the non-pulsatile device can be safe for long-term support [Citation2–6]. Chow G et al. [Citation7] found that pulsatile flow does not increase cerebral blood flow, while Sezai et al. [Citation8] conclude that pulsatile pumping produces superior circulation in the kidney and liver, and that microcirculation at the cell level was superior also as early treatment of acute heart failure. Results of other studies support similar conclusions [Citation9,Citation10]. The non-pulsatile type usually provides continuous and a large blood flow volume rate with lower pressure, as well as compactness, which is important for implantation. The pulsatile type VAD, on the other hand, offers pulsatile blood flow that is similar to physiological flow, which is more suitable for lower volume rates of flow and pressure applications. The non-pulsatile type pump has attracted increasing attention. However, the relative simple construction and cost-effective structure of the pulsatile pump makes it more suitable for non-implantation application but more research is needed.
In pulsatile ventricular assist devices (PVADs), accurate trigger signal to open or close the pulsatile pump is significant, and it determines the degree of matching with the physiological flow of the patient’s body. The trigger signal to activate the pump should be precisely controlled, and the delay between the trigger signal and the human body’s physiological flow should be as short as possible. What’s more, the control system should be feasible and reliable [Citation11,Citation12]. The closing of the pump is either determined by another body signal or calculated based on experience. The trigger signal to open the pump is the R-wave crest of the electrocardiogram (ECG) signal. The ECG signal is required to be obtained directly from the heart. However, present operation techniques attempt to keep the body wound to be as small as possible, and the ECG signal is usually acquired from a position far away from the heart, such as the wrist. In such a manner, extra noise will be added to the ECG signal due to unexpected body signals, for example, the muscle activity. In addition, human respiration and electrode movement causes low-frequency drifts of the ECG signal. The ECG signals also show large individual differences [Citation13–16]. Even in the same individual, the ECG signal varies with body posture. More precisely, the ECG signal consists of a voltage waveform and a noise signal, and it depends on the individual, race, age, emotion, and body posture. This introduces big challenges with respect to the characteristic identification and the R-wave crest pickup from the indirect ECG signals.
Different techniques were introduced in last decades that improve the identification performance of characteristic points of the ECG. These methods are mostly based on Fuzzy Logic, Artificial Neural Networks (ANN), Genetic Algorithm (GA), Support Vector Machines (SVM), pattern recognition, and other signal analysis techniques [Citation17]. Because the template technique involves intensive cross correlation-based similarity measurements between the QRS template and a number of windowed ECG signals, the heavy computational load can severely limit applications [Citation18]. Cuiwei Li et al. [Citation19,Citation20] reported an algorithm based on Wavelet Transforms, which has the potential for multiscale information analysis that can characterize ECG signals very well. The problem of position deviation associated with wavelet-transform-based techniques, however, cannot be avoided [Citation21]. Yan Sun [Citation22] developed an algorithm using a multiscale morphological derivative transform. The group used a morphological derivative transform, which is defined at different scales, and the noise sensitivity inherent in single-scale operation could be reduced. A better performance than the wavelet transform-based and adaptive thresholding-based techniques could be achieved, but a large number of empirical parameters are required and the morphological derivative transform is not always stable. Recently, Pandit et al. proposed a lightweight QRS detection method using max-min difference (MMD) algorithm, which consists of five key steps, obtains optimal computational efficiency and shows great robustness in dealing with real-time QRS detection with impressive performance [Citation23]. However, its performance degrades when noisy signals, especially with high amplitude spikes.
To solve these problems, we propose a novel method to improve the stability and reliability of the identification of the characteristics of the ECG signal. Only the R-wave crest signal is important for the PVAD application. Thus, in this algorithm, the difference between the original signal and the preliminary filtering signal is obtained and used as a new feature signal for identification the position of the R-wave crest and eventually for determination of the trigger time, which makes this method avoid physical delay of the filter and eliminate the signal shift, improving its stability, adaptability and accuracy. Both simulation and experiment were conducted to demonstrate the proposed method. The details are shown in the following sections.
2. Methods
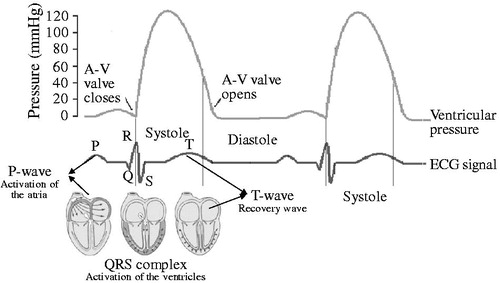
shows a model of the human heart, the ECG signal and its relationship between the ECG and human’s ventricular pressure. As shown in , before mechanical cardiac contraction, electric excitation was generated by the sinoatrial node cells [Citation24]. After the ventricular muscle cells received the signal to contract, the ventricular pressure increases, and produces the pressure to pump blood out to the heart. Simultaneously, the ECG signal reaches the surface of the human body. The changes in ECG signals and ventricular pressure are shown in . In the PVAD, the correction between the ECG signal and the ventricular pressure is used to determine the systolic triggering point of PVAD synchronization by detecting the R-wave crest point of the ECG signal.
Figure 1. ECG signal related to the heart action (a), and correction between the ECG signal and the ventricular pressure (b).
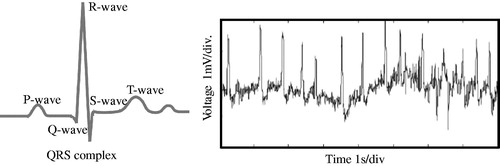
As it is known, the R-wave crest of the ECG signal is the ideal point for triggering the PVAD. However, the challenge is that the real ECG signal is far more complex than the ideal one. shows the difference between the ideal and real ECG signals. illustrates the one period of the ideal ECG signal with clear features for each wave. However, the real signal is always affected by various factors and shows irregular features. As mentioned in the first section, the preference for small wounds in modern clinical surgery demands the ECG signal acquisition mostly from the body surface, where the ECG signal is rather weak. It is usually in the range of sub-mV to several mV. In addition, disturbances caused by muscle tremors in humans occur across a wide range of frequencies. These external influences lead to a small signal to noise ratio (SNR) of the ECG. In addition, human respiration and electrode movement cause a low-frequency drift of the ECG signal. This signal is always less than 10 Hz, as shown in . Therefore, to accurately recognize the R-wave crest, removal of high-frequency noise, drift, and delay of the original signal has to be carried out in advance.
Figure 2. The shape of an ideal ECG signal (a) and a real ECG signal (b).
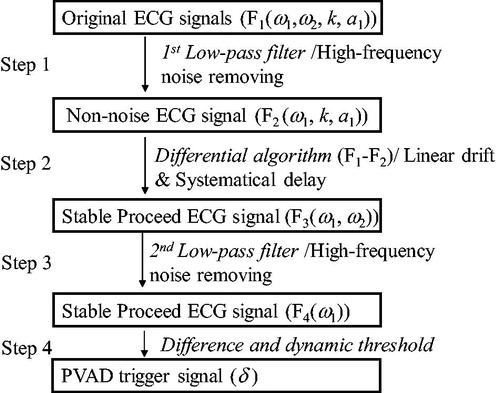
introduces an algorithm from the elimination of linear drift, systematically delay, and unexpected low-frequency vibration. This is all in addition to traditional low-pass filtering and differential thresholds. In Step 2, a differential algorithm between the original ECG signal and the low-pass filtered signal was applied. The systematically delay caused by the low-pass filter in the order of a few ms was created because the strongly changing area exists in the original signal. In other words, the R-wave crest, was enlarged in F3, and generated several milliseconds earlier. The difference signal coincides with the original ECG signal. The relative error is about 0.5% during one period. It should be noted that in this algorithm, low-pass filtering was used twice because the high-frequency noise ω2, which was removed in Step 1, was introduced again because of the algorithm in Step 2. Although this delay pre-processing of this signal using a low-pass filter can be compensated by the following control system. This adds extra pressure to the controller design and reduces the controller stability. Compared with the physical delay, the leading algorithm in this study is more practical. In addition, the linear drift was removed. Furthermore, F1, F2, F3, F4 in are not accurate formulas for the specific calculation, but they represent the components and their characteristics for each signal.
Figure 3. Proposed processing algorithm with addition of a differential calculator.
This simple but effective algorithm greatly improved the feature identification of the ECG signal using the differential threshold for the conventional method. In addition, this algorithm shows great adaptability with respect to many different conditions, and the computation pressure is significantly lowered compared to the conventional wavelet or model matching method. This improved performance benefits the PVAD system in terms of real-time and accurate data processing requirements. Both simulation and experimental confirm this.
3. Experiments and results
Both a simulation based on ECG signals from authoritative database and a human body experiment were carried out by using the LabVIEW program development environment and a home-developed test platform. Program frame, simulation details, experimental setup and results, and discussion were illustrated in this section.
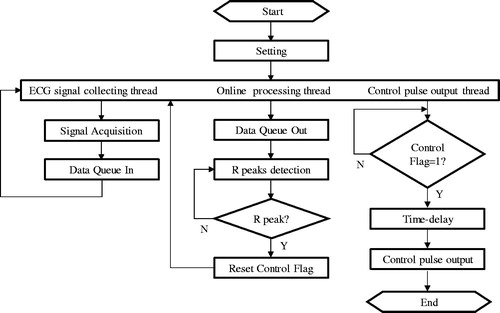
First of all, the LabVIEW program was developed. shows the details of the program for the acquisition, real-time processing of the ECG signal and generation of a trigger signal. It can be seen that there are three threads in this frame, the ECG signal acquisition, feature signal analysis/pickup, and the trigger signal output. In the ECG signal collecting thread, ECG signals were obtained either from an acquisition card connected to a real experimental platform or from an authoritative database for the theoretical simulation. These original signals were then placed into the data queue for processing. It will be carried out at the same time to pick up the characteristic feature of the ECG signals and identify the R-wave crest (R-peak) using the algorithm given by the . When a true R peak was identified, a control flag would be launched and a trigger signal as a judgement demand was generated simultaneously to activate the PVAD, which was not discussed in this paper.
Figure 4. LabVIEW based data acquisition and analysis program.
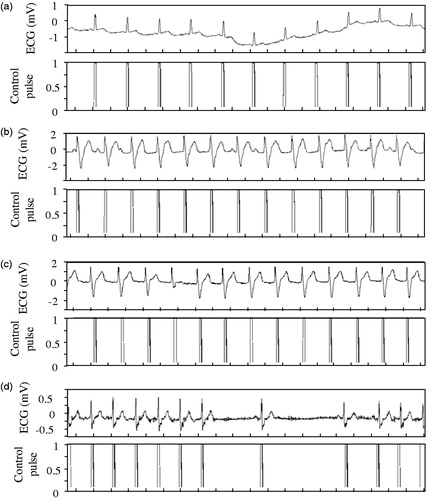
To verify the feasibility of this program, four typical ECG signals from the MIT-BIH Arrhythmia Database, they are, one normal sinus rhythm only with a drift caused by the breath and other three pathological ECG signals were selected to demonstrate the proposed algorithm and developed LabVIEW program abovementioned. These three pathological ECG signals are paced rhythm from people who have pacemakers, atrial fibrillation rhythm from people who suffered atrial fibrillation, and SA conduction disturbance from those people whose heart rate falls below 60, respectively [Citation25,Citation26].
shows the processing results of these four types of ECG signals. The pulse-like signals shown in the lower section of each figure are the trigger signals to activate the VADs as opening commands. Though there are different disturbances in the original ECG signals as shown in the upper section of each figure, such as low frequency drift, amplitude inconsistency, disorder period, atrial fibrillation, which is one of the most common types of arrhythmia [Citation27], the proposed method can always accurately and stably identify the interest signals, These simulation results based on the ECG signals from authoritative database confirmed that this method including the key algorithm and the program based on it is of high adaptability.
Figure 5. Data processing results for the four typical ECG signals (a) Normal sinus rhythm (Record 121) 0.2s/div; (b) Paced sinus rhythm (Record 107) 0.2s/div; (c) Atrial fibrillation (Record 217) 0.2s/div; (d) SA conduction disturbance (Record 232) 0.2s/div.
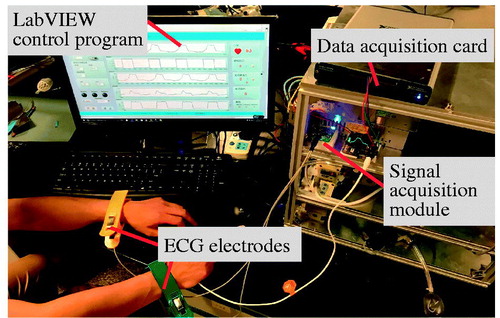
To further demonstrate the proposed method, an experimental setup was built and real-time acquisition and processing of human body ECG signal was carried out. shows the experimental setup. This experimental platform includes four parts, they are, ECG electrodes for real-time acquisition of original signal, a home-developed signal acquisition module, a data acquisition card (NI Corp.), and a LabVIEW program environment. It should be noted that, the ECG signal was obtained directly from a volunteer’s wrists, and there was no body wounds, meeting the requirement of today’s clinical operation.
Figure 6. Experimental setup.
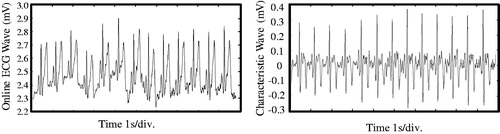
First of all, experiment was conducted to test the R-wave crest identification accuracy of this method. Under a relatively stable human body condition, an ECG signal within around 10 seconds was obtained and real-time processed using the algorithm and program illustrated in and , respectively.
gives the processing results. It can be seen from , the original signal on an amplitude value of a few mV is rather irregular, while after processing with the proposed algorithm, and the characteristic wave as shown in is uniform and suitable for further operation. Though there is still difference in the signal amplitude, the characteristic can be clearly recognized. This comparison verifies that the method proposed in this article is effective in real-time dealing with the ECG signal obtained directly from human body, even on a position far from human heart.
Figure 7. Comparison between the original signals and the processed ECG signals.
To precisely evaluate the accuracy of the proposed method, differences between the original and characterized ECG R-wave crests picked manually were compared and summarized. shows the comparison results. There are 13 peaks within the 10 seconds, and cardiac circle is around 740 ms. It should be noted that for the 1st peak time, no accurate cardiac cycle was recorded since the data was not obtained just from the beginning of a circle. The leading time of each crest can be used to evaluate the accuracy. It can be seen from this table that the leading time is almost constant, about 4 ms, which is 0.5% of the cardiac circle. This means the R-wave crest can always be accurately recognized.
Table 1. Comparison of the ECG R peaks positions and the identified peaks position.
This identification accuracy is acceptable for real-time triggering of the PVAD and for failure heart recovery application. What is more, the small order leading time gives the mechanism of the VAD a certain degree of delay tolerance, which always exists in a real VAD system. A confirmation of this claim will be carried out in a future study.
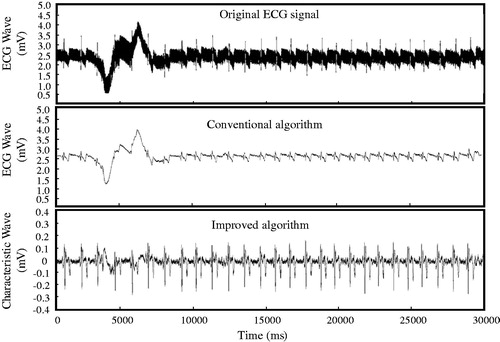
The robustness of this algorithm was then tested by inducing a vibration to the signal acquisition process. As shown in , at the beginning of the data acquisition, the experiment volunteer shakes his hand and ups/downs of the ECG wave can be clearly observed. The processing result of the signal using the conventional algorithm is unable to identify the R-wave crest during the vibration area. On the other hand, the proposed method can pick up the interested signal accurately, and the pickup accuracy can reach 99% under the vibration condition. This result verified the proposed method greatly improved the robustness in ECG identification.
Figure 8. Demonstration of the robustness of the algorithm.
The advantages of method proposed in this article were preliminarily demonstrated. Adaptability of this method for different experiment volunteers, and long-term experiment of this home-designed system are needed to be further investigated before this algorithm and program were integrated into the real PVADs. On the other hand, for activation of the PVADs, apart from a triggering signal for opening, signal for closing is also desired, though in many applications, the closing signal is determined by a constant time delay after the opening signal as mentioned in the beginning of the article. A real-time acquisition and processing of other body signals, including heart sound signal, aortic pressure, and pulse wave, for closing the PVADs is being conducted to form an entire PVAD triggering system in our laboratory and we will report the progress of it as soon as it is available.
4. Conclusion
In this study, we proposed a stable and accurate feature-identification algorithm for electrocardiograms to provide trigger time for pulsatile ventricular assist device systoles. The algorithm introduced a subtraction preprocessor between the original ECG and its low-pass signal, which limits its electromyographic interference, power line interference, and linear drift. Both the simulations based on four typical ECG signals and the experiment based on the real-time acquisition of the human body confirm the feasibility of this method. A high adaptability for different signal types, high identification accuracy up to 99%, and good robustness under unexpected vibration were demonstrated. The algorithm, program, system design methodology, experimental setup and data processing proposed in this work can help the simultaneous triggering of a VAD and will be finally beneficial for heart failure recovery.
Acknowledgements
This research was supported by National Natural Science Foundation of China (51427805), China Postdoctoral Science Foundation Funded Project (2016T90089), Shenzhen Science and Technology Plan (JSGG20150512162908714), National Key Research and Development Program (2016YFF0100704) and Shenzhen Fundamental Research Program (JCYJ20160301153417873).
Disclosure statement
No potential conflict of interest was reported by the authors.
References
- Reul HM, Akdis M. Blood pumps for circulatory support. Perfusion. 2000;15:295–311.
- Saito S, Westaby S, Piggot D, et al. End-organ function during chronic nonpulsatile circulation. Ann Thorac Surg. 2002;74:1080–1085.
- Garatti A, Bruschi G, Colombo T, et al. Clinical outcome and bridge to transplant rate of left ventricular assist device recipient patients: comparison between continuous-flow and pulsatile-flow devices. Eur J Cardio-Thorac Surg. 2008;34:275–280.
- Sandner SE, Zimpfer D, Zrunek P, et al. Renal flow function after implantation of continuous versus pulsatile left ventricular assist devices. J Heart Lung Transplant. 2008;27:469–473.
- Radovancevic B, Vrtovec B, de Kort E, et al. End-organ function in patients on long-term circulatory support with continuous- or Pulsatile-flow assist devices. J Heart Lung Transplant. 2007;26:815–818.
- Kamdar F, Boyle A, Liao K, et al. Effects of centrifugal, axial, and pulsatile left ventricular assist device support on end-organ function in heart failure patients. J Heart Lung Transplant. 2009;28:352–359.
- Chow G, Roberts IG, Edwards AD, et al. The relation between pump flow rate and pulsatility on cerebral hemodynamics during pediatric cardiopulmonary bypass. J Thorac Cardiovasc Surg. 1997;114:568–577.
- Sezai A, Shiono M, Orime Y, et al. Major organ function under mechanical support: comparative studies of pulsatile and nonpulsatile circulation. Artif Organs. 1999;23:280–285.
- O’Neil MP, Fleming JC, Badhwar A, et al. Pulsatile versus nonpulsatile flow during cardiopulmonary bypass: microcirculatory and systemic effects. Ann Thorac Surg. 2012;94:2046–2053.
- Cheng A, Williamitis CA, Slaughter MS. Comparison of continuous-flow and pulsatile-flow left ventricular assist devices: is there an advantage to pulsatility? Ann Cardiothorac Surg. 2014;3:573–581.
- Ai Y, Pan B, Fu Y, et al. Control system design for a novel minimally invasive surgical robot. Comput Assisted Surg. 2016;21:45–53.
- Niu G, Pan B, Ai Y, et al. Intuitive control algorithm of a novel minimally invasive surgical robot. Comput Assisted Surg. 2016;21:92–101.
- Israel SA, Irvine JM, Cheng A, et al. ECG to identify individuals. Pattern Recognit. 2005;38:133–142.
- Singh YN, Gupta P. ECG to Individual Identification. 2nd IEEE International Conference on Biometrics: Theory, Applications and Systems; 2008.
- Yongjin W, Plataniotis KN, Hatzinakos D. Integrating analytic and appearance attributes for human identification from ECG signals. Paper presented at Biometric Consort Conference IEEE; 2006.
- Li G, Zhang S, Yang L, et al. Computerized analysis of acceleration parameter for the non-stress test normal and potentially abnormal fetuses. Comput Assisted Surg. 2016;21:1–5.
- Karpagachelvi S, Arthanari M, Sivakumar M. ECG feature extraction techniques: a survey approach. Physics. 2010;8:76-80.
- Chen HC, Chen SW. A moving average based filtering system with its application to real-time QRS detection. Paper presented at Computers in Cardiology; 2004.
- Li C, Zheng C, Tai C. Detection of ECG characteristic points using wavelet transforms. IEEE Trans Biomed Eng. 1995;42:21
- Pal S, Mitra M. Detection of ECG characteristic points using Multiresolution Wavelet Analysis based selective coefficient method. Measurement. 2010;43:255–261.
- Mallat S, Zhong S. Characterization of signals from multiscale edges. IEEE Trans Pattern Anal Machine Intell. 1992;14:710–732.
- Yan S, Chan KL, Krishnan SM. Characteristic wave detection in ECG signal using morphological transform. BMC Cardiovascu Disord. 2005;5:1–7.
- Pandit D, Zhang L, Liu C, et al. A lightweight QRS detector for single lead ECG signals using a max-min difference algorithm. Comput Methods Programs Biomed. 2017;144:61–75.
- Zhang H, Li R-j, Huang X, et al. Activities of the sinus node pacemaking during the simulated atrial reentry. Comput Assisted Surg. 2016;21:11–16.
- Goldberger AL, Amaral LA, Glass L, et al. Physiobank, physiotoolkit, and PhysioNet: components of a new research resource for complex physiologic signals. Circulation. 2000;101:E215–ee20.
- MIT-BIH Arrhythmia Database [Internet]. Cambridge: Harvard-MIT Division of Health Sciences and Technology Biomedical Engineering Center; 2017 [cited 2017 Sep 18]. Available from: https://physionet.org/physiobank/database/mitdb/
- Lim HW, Hau YW, Lim CW, et al. Artificial intelligence classification methods of atrial fibrillation with implementation technology. Comput Assisted Surg. 2016;21:154–161.