
 ?Mathematical formulae have been encoded as MathML and are displayed in this HTML version using MathJax in order to improve their display. Uncheck the box to turn MathJax off. This feature requires Javascript. Click on a formula to zoom.
Abstract
Surface EEG (Electroencephalography) signal is vulnerable to interference due to its characteristics and sampling methods. So it is of great importance to evaluate the collected EEG signal prior to use. Traditional methods usually use the impedance between skin and electrode to estimate the quality of the EEG signal, which has shortcomings such as monotonous features, high false positive rates, and poor real-time capability. Aiming at addressing these issues, this paper presents a novel model of EEG quality assessment based on Fuzzy Comprehensive Evaluation method. The developed model employs amplitude, power frequency ratio, and alpha band PSD (Power Spectral Density) ratio of resting EEG signal as evaluation factors, and performs a quantitative assessment of the signal quality. Experiments show that the proposed model can significantly determine the EEG signal quality. In addition, the model is simple in implementation with low computational complexity, and is able to present the EEG quality evaluation results in real time. Before the formal measurement, collecting short-term resting EEG data, and evaluating the EEG signal quality and current signal acquisition environment using the model, the collection efficiency of qualified EEG signals can be greatly improved.
1. Introduction
Known as a novel biological characteristic, EEG signal has been widely used in the research of physiology, psychology, neuroscience, and cognitive science [Citation1]. Surface EEG signal is very weak and extremely susceptible to interference during the collection process, resulting in the unavailability of EEG data usually [Citation2]. Therefore, the way of evaluating the quality of EEG signals in real time is of great research significance and application value [Citation3, Citation4].
EEG signal quality evaluation research is still at the early stage of development. The most commonly used method for evaluating the quality of the EEG signal is the impedance method, that is, applying the impedance between electrodes and human body to judge the EEG signal acquisition quality [Citation5–8]. However, this method has limitations, for instance, when using this method, the surface EEG signal needs to be collected in a specific circumstance, which may shield most of the interference, such as power frequency interference and so on. The entire collection process is operated by the professional staff to maintain the error rate in a very low level. In the “nearly interference-free” environment, it is feasible to use the impedance method for the EEG signal quality assessment. However, apart from the above environment, EEG signal is bound to subject to various kinds of interference, which makes the quality evaluation of the EEG signal very difficult [Citation9]. In summary, the existing research may be deficient in the following aspects. First of all, the selected features used for EEG signal evaluation are relatively simple without considering different time and frequency domain factors in different cases [Citation10]. Secondly, most of current EEG quality assessment models are too complex to function in a real-time fashion, which makes the models unfeasible for practical application [Citation11].
To solve the existing problems, this paper presents a mathematical model which can evaluate the quality of the EEG signal based on the characteristics of resting EEG signals. The post-analysis model is transformed into a post-measurement model to avoid the invalid data. It is ensured that each measured EEG signal is qualified so that the EEG measurement efficiency is remarkably improved. Furthermore, the EEG signal quality evaluation model proposed in this paper is of low computational complexity, making it much more implantable into a microprocessor, which can effectively promote the surface EEG application in general environment, especially for portable devices.
The paper is organized as follows. In Section II, we introduce three factors related to the EEG signal quality and characterize their mathematic model using a fuzzy comprehensive evaluation method. In Section III, the experiment design and results are shown briefly. In Section IV, the performance of the proposed EEG signal quality evaluation model is discussed and analyzed in detail. In Sections V, we summarize the paper and give a conclusion and an application forecast bout the method.
2. Method
In this paper, fuzzy comprehensive evaluation model is utilized for EEG signal evaluation. Comparing to the traditional methods, the fuzzy comprehensive evaluation method is more suitable for complicated signal and able to reduce the subjective effects by just relying on experimental data sets, which tremendously strengthen the evaluation credibility [Citation12]. As for fuzzy comprehensive evaluation model design, the factor set is chosen for the studying target, and the remark set, the affecting variable, is chosen based on the corresponding evaluating factor. Considering the EEG signal quality evaluation model, three evaluating factors – the amplitude, alpha band PSD ratio, and power frequency ratio - are chosen based on the thorough literature survey and experiment analysis.
2.1. Amplitude
The following experiment has been conducted focusing on the first evaluating factor–the EEG signal amplitude. EEG signal is measured under standard operating procedure; control experiment is carried out for the same subject. Electrode in the first test is used upon turned on, while electrode in the second test is used after being air dried for 30 min. The median of recorded EEG data is shown in . Based on , amplitude of the signal decreases when quality of the electrode deteriorates (contact quality reduces), indicating that under standard operating procedure, the bigger the amplitude of the signal, the better the quality.
Figure 1. Amplitude of EEG signals using standard and air-dried electrodes. (a) Standard electrode (b) air-dried electrode.
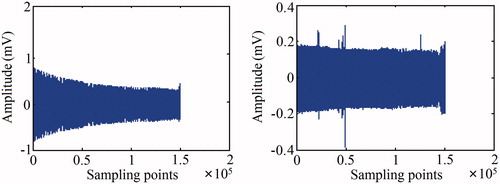
The weight for each factor of the fuzzy comprehensive evaluation model is determined through the statistic or experiments, and the final evaluation can be achieved by multiplying the weights. The membership function of the signal amplitude is shown in Equation (1) with the weight set to 1, the amplitude set to a1, and the evaluating value set to b1. The evaluation value is high when the amplitude falls between 0.2 mV and 2 mV, and is small when the signal amplitude is smaller than 0.2 mV. The membership function makes the EEG signal quality drop rapidly when too much disturbance is injected into the sensor reading.
(1)
(1)
2.2. Power frequency ratio
Although the power frequency (50Hz) trap filter could filter out most of the power frequency signal, it is still unavoidable because of limitations of equipment, and quality of the overall EEG signal will be impacted when power frequency signal is high. By analyzing the frequency spectrum of data from , it is clear that interference signals with high power frequency ratio occur when quality of electrode declines. Thus, it is reasonable to use power frequency ratio for evaluating the quality of EEG signal using EquationEquation (2)(2)
(2) , where, a2 represents the signal power frequency ratio and b2 stands for the evaluating value. Considering that the indoor experimental environment has strong power frequency disturbance, thus the power frequency ratio is large. The chosen membership function ensures that b2 has larger value when power frequency ratio is between 0.95 and 1.05. When the power frequency ratio is below 0.95, although the power frequency ratio decreases, some other types of disturbance ratios increase according to the experimental results. As the power frequency goes beyond 1.05, it is assumed that the EEG signal is interfered seriously by the power frequency ratio.
(2)
(2)
2.3. Alpha band PSD ratio
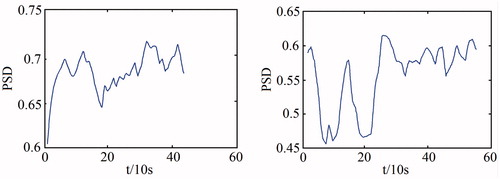
However, since other disturbances exist, quality of a signal could not be justified based only on the amplitude. The second factor – alpha band PSD ratio in EEG signal is introduced as shown in based on the results from the comparison experiment conducted in . Since the signal of the test subject is measured while subject is in resting state, alpha band should dominate in the EEG signal. In view of , alpha band PSD ratio occupies over 65% of the overall EEG signal when the electrode is in a good condition, while the ratio of alpha band PSD decreased by around 10% after the electrode was air dried for 30 min. Thus, the alpha band PSD ratio can determine the quality of EEG signal to some extent – under the same condition, the larger the alpha band PSD ratio, the better the quality of the signal.
Figure 2. Alpha band PSD ratios of EEG signals using standard and air-dried electrodes. (a) Standard electrode (b) Air-dried electrode.
The membership function of alpha band PSD ratio is shown in EquationEquation (3)(3)
(3) . In the same way, the corresponding weight is set to be 1 with a3 and b3 representing the alpha band power spectrum density ratio of EEG signal and the evaluating value respectively. Under the resting state, there exists large difference among the EEG signal data set regarding alpha band power spectrum density ratio. However, alpha band power spectrum density ratio increases as the EEG signal quality grows. The signal is regarded useless when the alpha band power PSD ratio falls below 0.2, b3 increases as a3 increases between 0.2 and 0.4. As a3 is between 0.4 and 1, the membership function is still an increasing function only with smaller growth rate. In fact, due to the fact of the existence of other EEG signal and disturbance, the actual alpha band power spectrum density ratio cannot reach 1.
(3)
(3)
2.4. EEG signal quality evaluation index
The evaluation index is determined through the fuzzy comprehensive evaluation model. The weight of each variable has been investigated during the process of designing evaluation factors. Therefore, the weighted summation of all the evaluation factors leads to the final EEG signal evaluation results, which is shown as
(4)
(4)
where, S stands for the overall evaluation score of EEG signal. shows the relationship between the evaluation score and the EEG signal quality. Based on the table provided, researchers can efficiently evaluate the current EEG signal quality, which can help guide the following experiments.
Table 1. Relationship between the evaluation score and the EEG signal quality
3. Experiment
To verify the effectiveness of the EEG signal quality evaluation model, experiment is implemented by setting up an EEG signal collecting and processing system (). Three rounds of experiments are conducted for a single subject: standard experiment (non-air dried electrode used to measure EEG signals when subject is in resting state), air-dried electrode experiment (electrode air dried for 30 min used for signal collection), and power frequency interfering experiment (conducted while applying power frequency electromagnetic field disturbance).
The main functions of EEG signal acquisition system include collection, transmission and storing of EEG signals, as well as interference processing and feature extraction of data. Specifically, the system uses biological electrode to conduct simultaneous sampling of EEG signals from multiple positions of the brain using A/D converter. After simple filtering and amplifying the acquired data, data is transmitted to a computer through WiFi for further filtration and management.
Since EEG signals are quite weak, and are easily disturbed when measured, skin pretreatment should be carried out while gathering the signal. The skin where the electrode will be placed need to be wiped with methanol, exfoliated, and dried with nonwovens; then place the patch electrode on the site, making sure that every part of the electrode is completely adhered. For non-stick electrodes, such as reference electrodes, the measured position should be treated in the same way, and conductive adhesive needs to be applied evenly on the electrode holder. To eliminate interference, electrode connecting wires cannot intertwine or be tied up. Subject should remain still with eyes closed to avoid affecting the accuracy of EEG signals.
In the power frequency experiment, the electromagnetic field generator is used to produce power frequency electromagnetic field interference, intensity of the electromagnetic field is measured using the electromagnetic field intensity admeasuring apparatus. Experimental results show that the interference from environmental electromagnetic field equals 85 A/m (around 0.1 T) with no power frequency disturbance, and the interference increases to 0.5 T (437 A/m) after power frequency electromagnetic field is applied.
Verification is carried out systematically according to the workflow shown in . The experiments (standard, air-dried electrode, and power frequency interfering) mentioned above are conducted with no shielding on 10 resting subjects (male and female aging from 20 to 55 years old), to collect and process EEG signals. Evaluation index for each set of experiments is calculated and listed in based on the proposed algorithm for evaluating the quality of EEG signals.
Figure 3. Experimental procedure of EEG signal quality evaluation
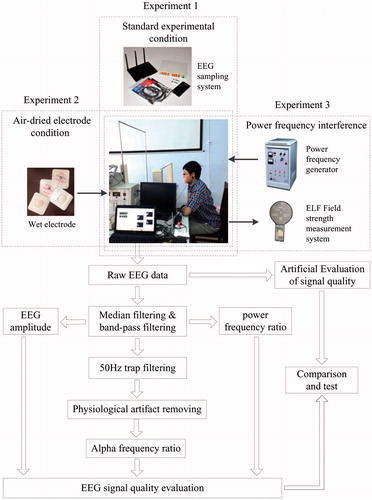
Table 2. Results of EEG signal quality evaluation.
It can be seen from that, in the standard experimental environment, i.e., when the standard electrodes are used without intense interference from power frequency electromagnetic field, evaluation index of the quality of EEG signals distributes at above 71.1%, and exhibits high quality signals; inter-individual differences of alpha band PSD ratio are the cause of fluctuation of evaluation index. The index is in between 41.4% and 60.6% when air-dried electrode is used and no strong electromagnetic field is applied, demonstrating that quality of the signals is relatively poor. While standard electrode is used and strong power frequency electromagnetic filed is interfering the system, the index lies between 58.3% and 73.3%, and it provides intermediate signal qualities. These results indicate that poor contact of electrode or decreased conductivity is the main reason leading to declined quality of the signals, rather than disturbance from electromagnetic field. Furthermore, subjective evaluation of all experimental data generates similar trend compared to results in , indicating the effectiveness of this method. Last but not the least, a standard dataset from Shanghai Jiaotong University Emotion EEG Dataset (SEED) was used to test the proposed evaluation method, and the result indicates that quality of the surface EEG signals in the dataset is high, and the data is valid, which reversely verifies the validity of the proposed model. Finally, an online EEG quality evaluation platform is developed using Labview software and some experiments are performed with the results show that the computational complexity of the model is quite low, and the real-time signal quality evaluation is achievable.
4. Discussion
This paper proposes an EEG signal quality assessment model, in which three scores are introduced and each score is based on a specific property of the signal as a whole or in the individual signal bands. Experimental results shows the consistency and objectivity of the method in estimating the quality of the recorded EEG signal.
In view of the simple model of current EEG evaluation method, the features of time frequency domain are usually not considered. The presented EEG evaluation model in this paper takes into account the amplitude of EEG, the alpha band power spectrum density ratio and the power frequency ratio. These three scores are introduced, each of which is based on a specific property in the whole or single band of the signal. The method generates an automated measure to detect the quality of the signal based on its biological and statistical properties, making the evaluation results consistent and objective. By overcoming the complex calculation and poor real-time performance of the current quality assessment methods of EEG, the presented model presented is simple in structure and low in computational load, and can give quantitative evaluation results of EEG quality in a timely manner.
It is our contention that in “real-world” applications, sensors must function effectively in maintaining EEG signal quality and removing various artifacts. Due to the high variance among the subjects, the electrodes may not make good contact with the skin. We assumed that in the case of loose electrode contact, the EEG recording device caused aliasing artifacts from the electrical mains. Although the artifacts, to some extent, can be removed through the filtering process shown in Figure 4, EEG signal quality assessment algorithm such as the proposed one is still necessary to determine whether it reflected the actual brain activity. To this end, we establish the EEG signal quality assessment model based on the assumption that if the device effectively records a brain signal, the Berger effect must be clearly noticeable, namely, the parietal alpha band power is supposed to be smaller with the eyes open than closed.
For the purpose of making EEG signal recording systems usable under real world conditions by non-professional (i.e., non-professional trained and qualified) personnel, we propose the algorithm for calculating the EEG signal quality by which the user can adjust the electrode connections or change the experimental environment when the evaluated score is unsatisfying. The signal quality assessment results identify with the user-centered evaluation, which indicates that the method functions well and meets the original intention of design. The proposed method could easily be used in continuous data without triggers, and the benchmark derived from our study would allow for the evaluation of further emerging EEG devices.
However, the proposed method still needs to be improved. For example, individual difference has a certain influence on the alpha band PSD ratio, which is not taken into account in the current algorithm. Additionally, non-resting EEG signals are not applicable with this algorithm so that he EEG signal used for quality assessment must be measured under resting conditions. To address these deficiencies and further improve the model are the focus of our current research.
5. Conclusion
With the increasing application of the EEG signal, it is of great significance to develop a mathematical model which can accurately evaluate the quality of the surface EEG in real time. To this end, this paper systematically analyzes the three representative features of the EEG signal including signal amplitude, power frequency ratio, alpha band PSD ratio, which are correlated with the quality of EEG signals and taken as parameters for quality evaluation of EEG signals. According to the statistical data and the experiment analysis, the evaluation formulas of amplitude, power frequency ratio, and alpha band PSD ratio are designed respectively. Integrating the assessment of these features, a fuzzy comprehensive evaluation-based EEG quality evaluation model is finally established. Experiments based on standard EEG signals (SEED) and actual measured resting state of brain electrical signal, prove that the model can distinguish the interference from the signal and evaluate the current EEG signal detection environment quantitatively, which can either provide guidance for the formal measurement of EEG signal or offer a usability determination of the collected ones.
Authors’ contributions
Dr. Dan Liu and Dr. Qisong Wang was responsible for the system construction. Dr. Xin Liu was in charge of the coding. Dr. Yan Zhang performed the experiments for the presented data. Dr. Dan Liu coordinated and drafted the manuscript. Dr. Jingyang Lu polished the English translation. All authors edited the manuscript and approved the final version.
Disclosure statement
No potential conflicts of interest were disclosed.
Additional information
Funding
References
- Minguillon J, Lopez-Gordo MA, Pelayo F. Trends in EEG-BCI for daily-life: requirements for artifact removal. Biomed Signal Process Control. 2017;31:407–418.
- Kim K, Lim S H, Lee J, et al. Joint maximum likelihood time delay estimation of unknown event-related potential signals for EEG sensor signal quality enhancement. Sensors 2016;16(6):891.
- Tautan AM, Serdijn W, Mihajlovic V, et al. Framework for evaluating EEG signal quality of dry electrode recordings. IEEE Biomedical Circuits and Systems Conference; Rotterdam: IEEE; 2013. p. 186–189.
- Hu B, Peng H, Zhao QL, et al. Signal quality assessment model for wearable EEG sensor on prediction of mental stress. IEEE Trans Nanobiosci. 2015;14(5):553–561.
- Viswam N, Roozbeh J. Characterizing contact impedance, signal quality and robustness as a function of the cardinality and arrangement of fingers on dry contact EEG electrodes. 36th Annual International Conference of the IEEE Engineering in Medicine and Biology Society; Chicago (IL): IEEE; 2014;3755–3758.
- Tautan AM, Mihajlovic V, Chen YH, et al. Signal quality in dry electrode EEG and the relation to skin-electrode contact impedance magnitude. Proceedings of the 7th International Conference on Biomedical Electronics and Devices; Angers (Loire Valley, France); 2014. p. 12–22.
- Fiedler P, Brodkorb S, Fonseca C, et al. Novel TiN-based dry EEG electrodes: influence of electrode shape and number on contact impedance and signal quality. In: Bamidis PD, Pallikarakis N, editors. XII Mediterranean Conference on Medical and Biological Engineering and Computing. Vol. 29. Berlin (Heidelberg): Springer; 2010; p. 418–421.
- Fiedler P, Fonseca C, Pedrosa P, et al. Novel flexible Dry multipin electrodes for EEG: signal quality and interfacial impedance of Ti and TiN coatings. Proc Annu Int Conf IEEE Eng Med Biol Soc. 2013;2013:547–550.
- Nakamura M, Chen Q, Sugi T, et al. Technical quality evaluation of EEG recording based on electroencephalographers’ knowledge. Med Eng Phys. 2005;27(1):93–100.
- Yang HJ, Guan CT, Ang KK, et al. Quality assessment of EEG Signals based on Statistics of Signal Fluctuations. IEEE International Conference on Systems, Man and Cybernetics; IEEE; 2014; p. 1853–1857.
- Shady M, Sherif H, Saeid N, et al. Towards automated quality assessment measure for EEG signals. Neurocomputing 2017;237:281–290.
- Gu WJ, Cao FL, Dong W. Analysis on the application of bio-nanotechnology in forests based on fuzzy comprehensive assessment. J Computat Theor Nanosci. 2016;13(7):4625–4628.