
Abstract
Three different types of synchronous control methods based on physiological parameters, electrocardiogram (ECG) and fixed systole, ECG and aortic pressure, and ECG and phonocardiogram (PCG) were used to trigger a proposed intra-ventricular assist device (iVAD). The ECG, aortic pressure, and PCG were processed, respectively, and featured characteristics were extracted to trigger the iVAD-experimented in vitro circulation system in the laboratory. The data showed that all three types of synchronous control methods produced trigger pulses synchronously and that the iVAD synchronously beat with the native heart. The multi-cycle data demonstrated that the synchronous delay time of the proposed iVAD during systole and diastole was separately stabilized at a certain time. This study showed that the combination of three synchronization methods can be applied to the iVAD to improve the reliability of synchronization.
Introduction
Ventricular assist devices (VADs) have been widely used as a bridge to transplantation and recovery and are currently being employed as a final therapy for heart failure patients who are not eligible for heart transplantation. Among the two types of VADs, the implantable non-pulsatile ventricular assist device (N-PVAD) grips more attention because it can be easily miniaturized and is easy to control. The damage to human blood is minimal and a normal blood flow state is achieved, therefore, the pulsatile ventricular assist device (PVAD) is more beneficial to blood perfusion and functional recovery of all body parts [Citation1,Citation2]. Although recent studies have shown that N-PVADs have similar short-term effects [Citation3–6], there are still some controversies about the long-term effect [Citation7]. Therefore, investigating the beneficial effects of PVADs in cardiac frequency homogeneity is of great importance.
Traditional PVADs are implanted between the left ventricular apex and the ascending aorta. Therefore, traditional PVADs will work against the left ventricle during aortic valve ejection. However, the proposed VAD (iVAD) [Citation8] is inserted in the ventricle and therefore physiological implications of VAD support will be different. During ejection, the proposed VAD will work together with the left ventricle. If the assist device does not synchronize with the heart, it will cause the overlap of systolic and diastolic cycles, resulting in additional burden to the affected heart. The synchronized trigger signals play an important role in the iVAD.
The start point for the iVAD diastole is provided by the R wave peak of the electrocardiogram (ECG) signal. In a previous study, the extraction and real-time processing of weak ECG signals have been described in detail [Citation8]. The endpoint of the iVAD diastole is the starting point of systole, which is provided by the down notch point of the pulse signal or the second heart sound’s wave peak. No reports are available on the combination of these three physiological signals to achieve synchronous control of PVAD.
This study aimed at full synchronization control of the iVAD and we achieved synchronization with the human heart by combining three physiological signals. Our findings suggest that this approach can be also adapted to different individuals and different physical environments. We are committed to improving the reliability of synchronous for the iVAD.
Methods
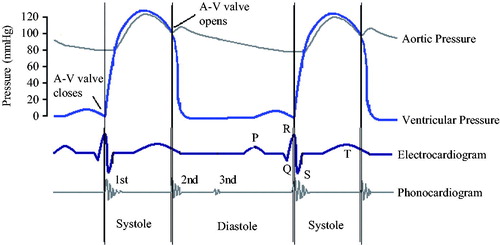
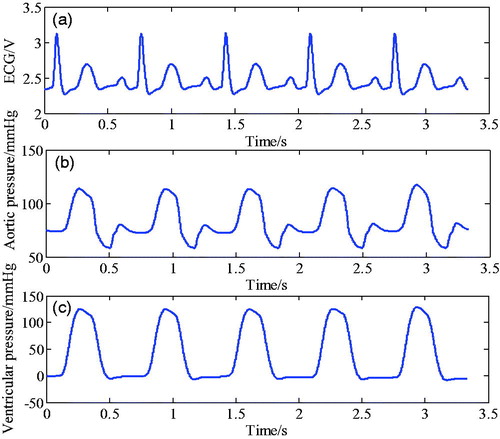
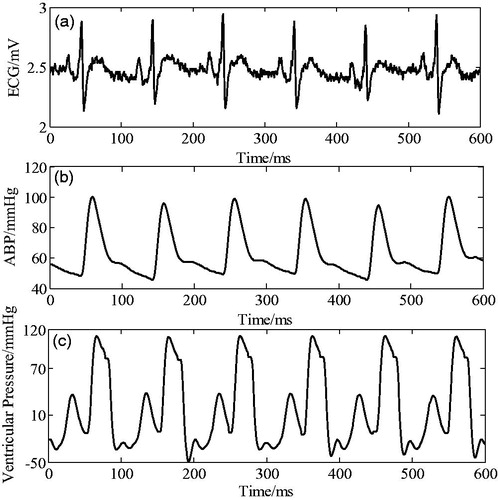
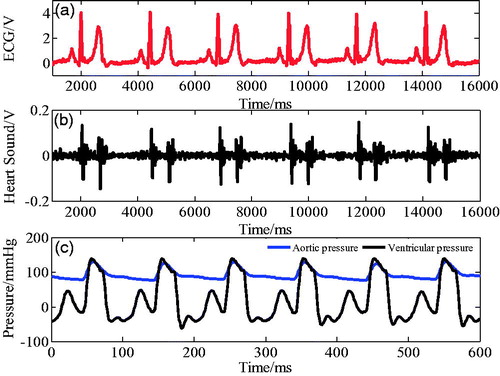
shows the relationship between ECG, aortic pressure, and the phonocardiogram (PCG) with ventricular pressure. As shown in the figure, at the beginning of ventricular systole, the mitral valve (M1) and the three tip valves (T1) are closed, then the ventricular pressure increases and ventricular contraction coincided with the R wave peak of ECG starts. At the end of ventricular systole, the semilunar valve closes, causing the ventricular pressure to decrease, and the ventricular diastolic mark corresponds to the aortic pressure notch point and the second heart sound wave peak. In the iVAD, the correspondence between physiological signals and ventricular pressure is used to determine the diastolic and systolic triggers of iVAD synchronism by determining the peak point of R wave, the notch of aortic pressure, and the peak of the second heart sound.
Figure 1. Relationship between ECG, aortic pressure, and heart sound signal at ventricular pressure.
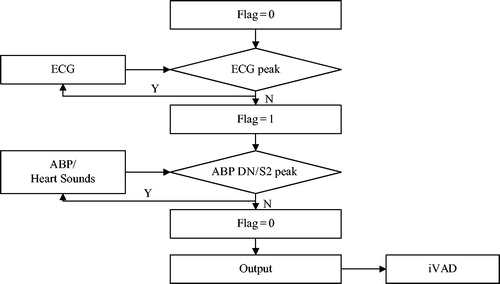
presents the principle of synchronous control of the iVAD using cardiac synchronized physiological signals. The three physiological signals that are used as an input signal include ECG signal, aorta pressure signal and heart sound signal. When the R wave peak is detected, true was set to the mark signal. When the aorta pressure down notch point or the second heart sound wave peak is detected, the mark signal is reset. Due to the mark signal, the output driving pulse is strictly synchronized with the heart. Under the control of the pulse, the PVAD simultaneously dilates and contracts with the heart.
Figure 2. The synchronous control flow chart (ABP is aortic blood pressure, DN is dicrotic notch, S2 is the second sound).
The key of this controlled method is based on the sufficient real-time performance of the software algorithm, and a real-time feature extraction method with strong stability is adopted [Citation9]. It can also detect the trigger ahead of time, leaving more time for subsequent operations. In addition to the real-time processing and early triggering of the software algorithm, the response and delay of the entire hardware system greatly influence synchronization of the control mode.
System and tests
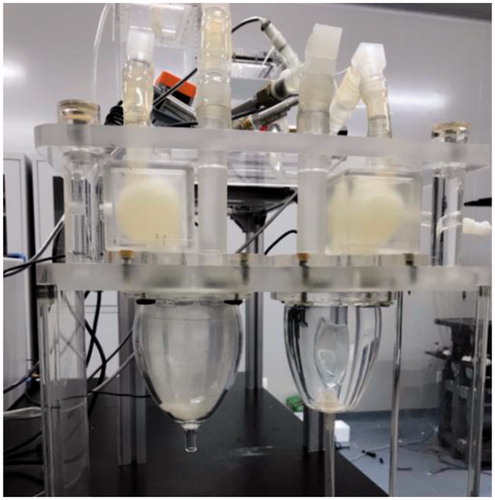
presents an extracorporeal circulation simulation system and a pulsating ventricular assist device that was established in our laboratory. To test the synchronization of the proposed control method, experimental tests were performed using the simulator.
Figure 3. The home-made extracorporeal circulation simulation system.
To verify synchronization of the control mode based on the physiological signal combination, a physiological signal acquisition and real-time processing system in LabVIEW environment was established. The control and acquisition of the flowmeter and pressure meter data signals were achieved at 1 kHz using a custom stem (National Instruments, Austin, TX, USA). All signals were filtered through a second-order Butterworth low-pass filter at a 20 Hz cutoff frequency.
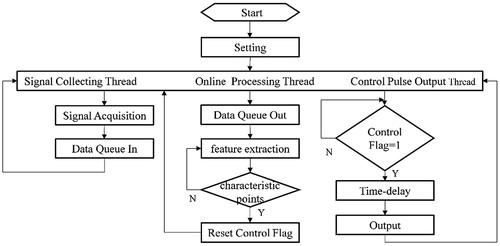
The system is divided into three parts: synchronous physiological signal acquisition, signal feature extraction, and control pulse output. The synchronization physiological signal acquisition part reads either the physiological database information file or the real-time data from the acquisition card, then presses the data into the queue. Next, the signal feature extraction part takes the data from the queue to carry out the real-time feature recognition, and when the ECG R wave peak/aortic pressure down notch point/second heart sound wave peak were detected, the control sign will be set. The control pulse output part judges the control mark, and if the sign is true, after the set delay time, output the drive control command.
When using the framework that is presented in , and using physiological signals [Citation9–12] of the PhysioNet database, several groups of physiological signal combinations were selected: ECG and fixed systolic ratio (35%), ECG and aorta pressure signal, ECG and PCG, synchronization of the control mode was verified.
Figure 4. The signal acquisition and processing system framework.
ECG and fixed systolic ratio (35%)
At present, three internationally recognized ECG databases exist that can be used as a standard: the MIT-BIH database provided by the Massachusetts Institute of Technology (MIT), the American Heart Association (AHA) database, and the European ST-T ECG database [Citation10–12]. Among them, the MIT-BIH arrhythmia database was the first available set of standard test materials for evaluation of arrhythmia detectors and has been used for that purpose as well as for basic research that focuses on cardiac dynamics at more than 500 sites worldwide. It has been valued by the medical engineering community worldwide.
This part selects the MIT-BIH arrhythmia database [Citation13,Citation14]. The library consists of 48 annotated records, of which 25 records can be downloaded from the Internet. Downloading a record takes about 30 minutes, and consists of two lead signals. The sampling rate of the signal is set to 360 Hz, and the resolution of the ADC is 11 bits.
The ECG from the MIT-BIH arrhythmia database is presented in , for which a fixed systolic ratio (35%), was used as a trigger. The pressure waveforms that were detected by the pressure sensor placed in the ventricle are presented in .
Figure 5. Synchronous ECG signal (a) and corresponding ventricular pressure (b).
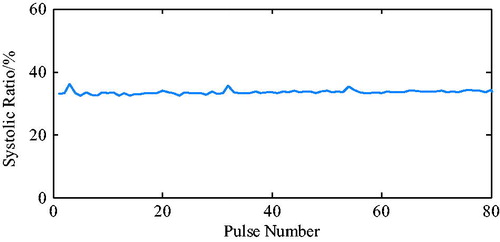
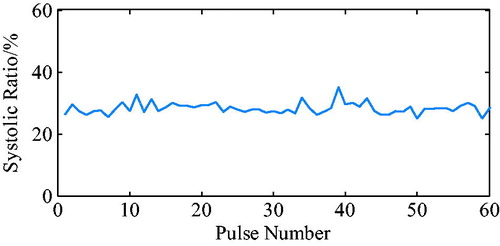
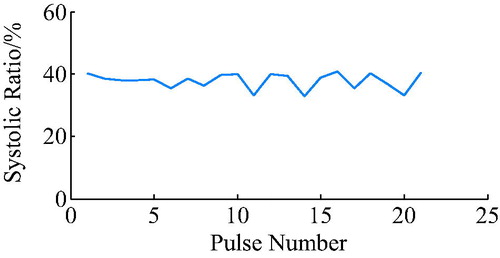
The ECG R wave peak was taken as the starting point of PVAD diastole, and the point of the steepest increase or decrease of the ventricular pressure was taken as an effective point for the ECG signal works on iVAD effectively. As shown in , the actual effect of the algorithm on the iVAD is that the opening and ending delay time did not change with the statistical period. The mean delay time of the ECG was 55ms, the pulse ending mean delay time was 70ms, and the systolic ratio was 35%. Therefore, the delay time of the iVAD drive synchronous control system was found stable.
Figure 6. Start delay time of the electrocardiogram.
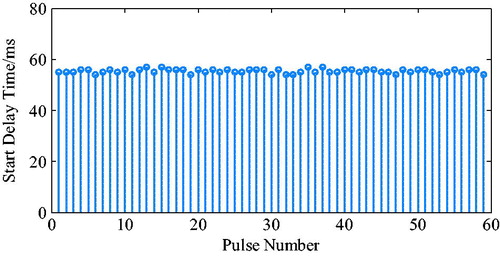
Figure 7. End delay time of pulse under different negative pressure conditions.
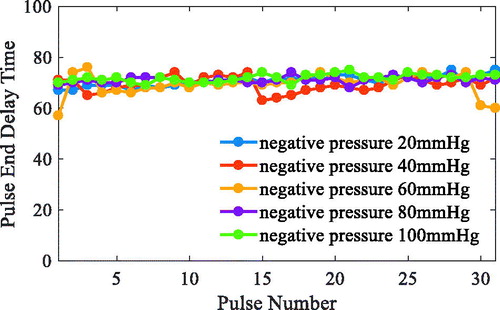
Figure 8. Heart systolic ratio using a combination of the ECG and fixed systolic ratio (35%).
ECG and aortic pressure signal
This part selects the MIMIC waveform database, in which recordings of multiple physiologic signals were collected from bedside patient monitors from adult and neonatal intensive care units (ICUs). Almost all record sets include a waveform record containing digitized signals (typically including ECG, ABP, and frequently other signals), each presenting a quasi-continuous recording of vital signs of a single patient throughout an ICU stay (typically a few days, but many will stay for several weeks) [Citation13,Citation15].
The ECG and arterial pressure data from the MIMIC database was used to trigger the iVAD synchronously in systole and diastole. The pressure waveforms detected by pressure sensors placed at the aorta are shown in .
Figure 9. Synchronous electrocardiogram signal, arterial pressure, and corresponding ventricular pressure.
The ECG R wave peak is taken as the start point of iVAD diastole, and the down notch of the aortic pressure is taken as the endpoint of PVAD diastole and the fastest rise or fall point of the ventricular pressure is taken as an effective point for the electrocardiogram signal works on iVAD effectively. As shown in , the actual effect of the algorithm on iVAD is as follows: the ECG opening mean delay time was 55ms, the aortic pressure ending mean delay time was 40ms, and the mean systolic ratio was 32%.
Figure 10. Start delay time of the electrocardiogram.
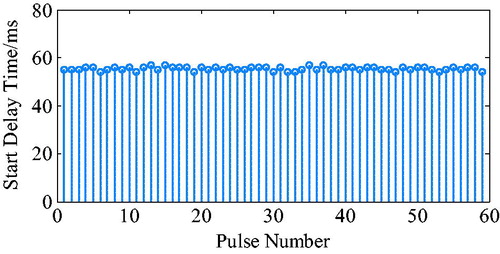
Figure 11. End delay time of the arterial pressure.
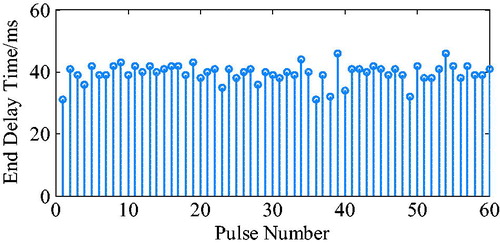
Figure 12. Heart systolic ratio by combining electrocardiogram and arterial pressure.
ECG and PCG
This part involves the PhysioNet/CinC Challenge 2016 Database, which represents a classification of normal/abnormal heart sound recordings. The heart sound recordings were collected from different locations in the body. The typical four locations included aortic area, pulmonic area, tricuspid area, and mitral area. Recordings were divided into two types: normal and abnormal heart sound recordings. The normal recordings were derived from healthy subjects, whereas abnormal recordings were from patients with a confirmed cardiac diagnosis that typically included heart valve defects and coronary artery disease patients. Recordings from those patients were generally indicated as abnormal. The database did not provide any specific classifications for these abnormal recordings. Both healthy subjects and pathological patients included children and adults. The recordings lasted from several seconds to up to more than one hundred seconds. All recordings were resampled to 2000 Hz and were provided as .wav format. Each recording contained only one PCG lead [Citation13,Citation16].
EGC and heart sound data that was derived from the Challenge database was used to synchronously trigger the iVAD systolic and diastolic, and pressure waveforms detected by pressure sensors placed at the site of the aorta are shown in .
Figure 13. Synchronized ECG signal, heart sound, and corresponding ventricular pressure.
The first and second sound S1, S2 mark the beginning of the ventricular systolic and diastolic phase, respectively. Pretreatment of cardiac sounds was realized by eliminating interference of the power frequency, high frequency noise, and baseline drift. Then, the pericardial envelope was extracted by the Hilbert space change. Moreover, data were smoothed by a local regression smoothing filter with a window width of 165, weighted least squares estimate and a first-order polynomial model. The Matlab script node of LabView was used to identify the feature.
As shown in , the actual effect of the algorithm on the iVAD was as follows: the ECG opening mean delay time was 52 ms, the aortic pressure ending mean ahead time was 15 ms, and the mean systolic ratio was 32%.
Figure 14. Start delay time of the electrocardiogram.
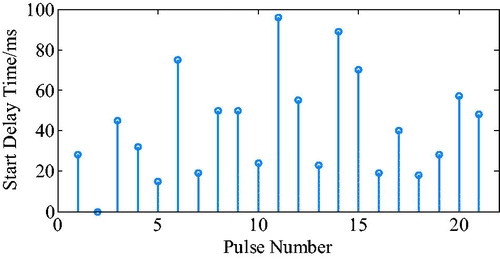
Figure 15. End delay time of heart sound.
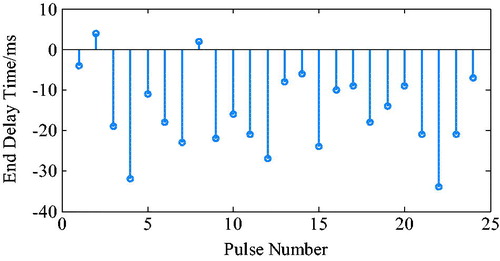
Figure 16. Heart systolic ratio when combining the electrocardiogram and heart sound.
Under the proposed control method, when taking the ECG and the fixed period contraction ratio method, the actual effect is as follows: start time delay was 55ms, end time delay was 70 ms, and systolic ratio was 35%. However, when using the ECG and aortic pressure signals method, the start time delay was 55 ms, the end time delay was 70 ms, and the systolic ratio was 32%. In addition, when using the ECG and second heart sound method, the start time delay was 52 ms, the end time ahead was 15 ms, and the systolic ratio was 38%. Taken together, it can be concluded that the auxiliary effect of the control methods was stable, the pulse opening delay time was 52–55 ms, the ending delay time was 40–70 ms, the ECG and heart sound combination method can trigger 20 ms ahead, and the systolic ratio was 32–38%.
Discussion
Three types of synchronous physiological signals can reflect the heartbeat, however, for selecting the most suitable synchronous signal in the actual situation, the strategy is important. In general, the ECG signal is stable, however, an abnormal ECG signal is not excluded, and may, therefore, be an invalid control mode. Currently, the fixed frequency control mode is the preferred selection mode. The notch points of some patients’ aortic pressure are not obvious. Therefore, the heart sound signals or fixed duty ratio control mode are a good alternative. In some situations, heart sound signals are easily affected by the environment, and in these circumstances, aortic pressure or fixed duty ratio control can be considered.
It is difficult to capture the start (end) points of rising (falling) ventricular pressure waves. The maximum rate of changes was used as a benchmark to calculate the system delay time. Therefore, the delay time is greater than the actual value. However, the data shows that the system delay time was stable. The pulse opening delay time was 52–55 ms, the ending delay time was 40–70 ms, the ECG and heart sound combination method can trigger 20 ms ahead, and the systolic ratio was 32–38%. It should be noted that in the case of non-thoracotomy the aortic signal was difficult to obtain, and that instead the pulse signal is often used. Because the aortic pressure signal needs to be transmitted from the heart to the wrist or finger to become the pulse signal, this substitution inevitably leads to the delay of the signal, and there may also be individual differences in this delay. Aortic pressure signal acquisition is easier to obtain from animal studies or open chest surgeries requiring pulsatile ventricular assist devices.
Under the condition that the input signal quality is sufficient, the accuracy of the algorithm meets the requirements. However, after adding hardware system the delay time was long. Therefore, we needed to correct and shorten the system delay time. When a patient's heart cycle is stable, the trigger time of the current cycle can be determined by the previous period, in which a delay time is less than one heart cycle. This allows for achieving limited/no delayed triggering of the current cycle, however, it provides a limited condition for the patient’s heart rate.
If the cardiac cycle is unstable, it is more common in patients with heart disease. When the amplitude of the signal changes slightly, it can reduce the percentile of the peak value when the single threshold is determined. The current threshold used was 80% of the peak value. If a threshold of 70%, 60% or even less is used, the lead time of the algorithm can be increased and the delay time of the system can be delayed. In addition, the current threshold used presents the mean of the 5 thresholds ahead. If the number of mean values is increased, the stability of the algorithm can be improved to a certain extent. When the change in amplitude is large, in addition to the fixed frequency duty ratio, the most stable physiological signal can be chosen to drive, and the optimization algorithm will automatically be realized by the algorithm.
Conclusions
In this study, we proposed a controlled method for iVAD, to synchronize systolic and diastolic with the native heart. Three types of physiological signals were pre-processed. The R wave peak of the ECG signal was identified and extracted by the threshold as a starting point of ventricular systole, which was used to trigger and synchronize the iVAD. Moreover, the fixed systole, the dicrotic notch of the aortic pressure, and the peak of the second heart sounds envelop represented the starting point of ventricular diastole. These features triggered contraction of the iVAD. In addition, three types of combined signals were tested synchronously, and the delay time of the system was stable. The pulse opening delay time was 52–55 ms, the ending delay time was 40–70 ms, the ECG and heart sound combination method triggers 20ms ahead, and the systolic ratio was 32–38%. Combined, the three synchronization methods are suitable in animal studies of the iVAD and may have beneficial effects in heart failure patients.
Disclosure statement
No potential conflict of interest was reported by the authors.
References
- Wangfu Z, Hong X. The prospect of application of mechanical-assistant circulatary devices[J]. Inter J Cardiovascular Disease. 2009;36(2):65–68.
- Ying L, Wanru D, Xianwu L, et al. Key technologies for developing artificial hearts. Beijing Bio Eng. 2008;27(1):100–104.
- Garatti A, Bruschi G, Colombo T, et al. Clinical outcome and bridge to transplant rate of left ventricular assist device recipient patients: comparison between continuous-flow and pulsatile-flow devices. Euro J Cardio-Thoracic Surg. 2008;34(2):275–280.
- Sandner SE, Zimpfer D, Zrunek P, et al. Renal function after implantation of continuous versus pulsatile flow left ventricular assist devices. J Heart and Lung Transplant. 2008;27(5):469–473.
- Radovancevic B, Vrtovec B, de Kort E, et al. End-organ function in patients on long-term circulatory support with continuous-or pulsatile-flow assist devices. J Heart and Lung Transplant. 2007;26(8): 815–818.
- Kamdar F, Boyle A, Liao K, et al. Effects of centrifugal, axial, and pulsatile left ventricular assist device support on end-organ function in heart failure patients, The J Heart and Lung Transplant. 2009;28(4):352–359.
- Nishimura T, Tatsumi E, Nishinaka T, et al. Diminished vasoconstrictive function caused by long-term nonpulsatile left heart bypass. Artific Org. 1999;23(8):722–726.
- Li X, Luo L, Zhu S, et al. Improved identification of the electrocardio-signal for pulsatile ventricular assist devices. Comput Assist Surg. 2017;22:278–285.
- Zhu S, Luo L, Yang B, et al. Improving hemodynamics of cardiovascular system under a novel intraventricular assist device support via modeling and simulations, Comput Assist Surg, 2017;22:221–231.
- Song X, Deng Q. On the format of MIT-BIH Arrhythmia Database. Ch J Med Phy. 2004;21(4):230–232.
- Zehuang Z, Guangshu H, Heng G, et al. Development of MIT-BIH ECG Database and its application as check standard. Ch J Bio Eng. 1993;4: 244–249.
- Tang W. MIT-BIH physiological signal management and playback system. Shandong: Shandong Normal University; 2009.
- Goldberger AL, Amaral LA, Glass L, et al. PhysioBank, physiotoolkit, and physionet components of a new research resource for complex physiologic signals. Circulation. 2000;101(23):E215.
- Moody GB, Mark RG. The impact of the MIT-BIH Arrhythmia Database. IEEE Eng in Med Biol Mag. 2002;20(3):45–50.
- Saeed M, Villarroel M, Reisner AT, et al. Multiparameter intelligent monitoring in intensive care II (MIMIC-II): a public-access intensive care unit database. Crit Care Med. 2011;39(5):952.
- Liu C, Springer D, Li Q, et al. An open access database for the evaluation of heart sound algorithms. Physiol Measure. 2016;37(12):2181–2213.