
 ?Mathematical formulae have been encoded as MathML and are displayed in this HTML version using MathJax in order to improve their display. Uncheck the box to turn MathJax off. This feature requires Javascript. Click on a formula to zoom.
Abstract
Fast 3D imaging and measurement of cells are of great importance in many fields associated with the life science. In this paper, only using two phase images in orthogonal directions, a geometric rotation method for 3D fast morphology reconstruction is proposed in view of more spheroid cells in blood cells. In this method, at first, the edges of a cell in two orthogonal projection directions are extracted from the corresponding phase images, and theirs centers and axes are determined. Then, with the geometric rotation method, the 3D surfaces of the cell membrane and its nuclei are reconstructed respectively. After all, the 3D complete morphology of the cell is reconstructed according to their space geometry relation. Simulation and experimental results demonstrate the validity and accuracy of this method for spheroid cells. Compared with other reconstruction methods, the image speed is improved since the multiple measurements or iterative procedures are not required. It provides a new approach to image the 3D morphological structure of spheroid blood cells.
1. Introduction
A cell is the basic unit of an organism structure. As for individual cell, the morphological characteristic as well as the internal composition, plays a crucial role in its health status, function and activity. Most of cells are colorless and transparent, the traditional optical microscope fails to image them because of the inadequate contrast. Quantitative phase microscopy (QPM) is a solution to this engineering roadblock. Since it used the cellular refractive index (RI) as an endogenous contrast, it is a noninvasive and nondestructive imaging tool. In recent years, various QPM [Citation1–6] techniques have been proposed with high accuracy and high speed. These techniques are mainly applied to the homogeneous cell, since there is a linear relationship between its phase and the axial thickness. However, for a heterogeneous cell, we cannot obtain its morphological information from the phase. Although we combine other technique, such as the confocal one, only the average RI or the physical thickness along the light transmission direction is obtained. Unfortunately, the axis physical thickness distribution of phase object cannot reveal the 3D structure information correctly.
Tomography phase microscopy (TPM) [Citation7–12] is an new and developing technological tool that quantitatively produces the distribution of RI and three-dimensional structure of phase object. TPM usually has two realization way such as rotating sample and multi-beam projection, images obtained can be applied to reconstruct the three-dimensional structure on the basis of parallelism method. For instance, Choi proposed one TPM technique based on alien Mach–Zehnder interference principle [Citation7]. In this method, a tilting galvanometer-mounted mirror is used to change the angle of the laser beam to obtain the phase information at multiple angles. Finally, with an improved reconstruction algorithm to these phases, the RI tomograms of an HT29 cell were obtained. In Ref. [Citation10], an advance TPM approach was proposed, which combines an external off-axis interferometer and a holographic optical tweezers. In this method, the interferometric projection set an angular range of 180° with 5° steps can be collected by using rotation of the cells. Then, with the classical filtered back-projection algorithm to these projection data, the 3D refractive index of a yeast cell in suspension was reconstructed.
In summary, this kind of method mentioned above, can obtain the 3D structure of a cell, and its accuracy is high. But, a large number of data calculations from multi-angle projections are necessary resulting in the low imaging rate. For the sake of reducing the times of measurement, our team presented a maximum entropy tomography method (MER) to reconstruct three-dimensional morphological and RI distribution only from two interferograms in orthogonal directions [Citation13]. However, the method is time-consuming since the iterative procedure is repeated many times to achieve acceptable accuracy.
In this paper, considering that most of typical blood cells are nearly spherical in shape, we propose a quick 3D imaging method for reconstructing the surface and substructure of a binucleated cellula. The algorithm is based on the idea of geometric rotation of curves and only needs two phase images in orthogonal directions. Primarily, the contour of the cell is extracted by detecting the edge intensity function of two phase images. In the next moment, Each substructure within the cell such as nucleus and cytomembrane are independently segmented and their 3D shape distribution can be recovered by rotating the phase contour in the orthogonal direction. The algorithm has a good prospect in the field of fast hemocyte classification and identification.
2. Orthogonal rotation reconstruction method
Some typical blood cells have common structures in human, whose 3D morphologies can be inferred from the projection profiles in different directions. Here, we propose a simple method to reconstruct 3D surface of a typical blood cell only by rotating the boundary curves of the phases in two orthogonal illumination directions. For the sake of verifying the feasibility of this algorithm, we take a binucleated cell with complex structure and multiple different mediums as an example in the following.
2.1. Orthogonal phase images of a binucleate cell
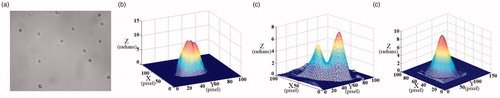
Binucleate cells are very common in human blood cells, such as binucleate eosinophils and binucleate neutrophils. is a diagram of binuclear cell captured by a conventional microscope. We establish its appropriate model, as shown . It is composed of a cell membrane, cytoplasm, and two nuclei. Among which, the membrane is a sphere with the radius of 8.0 μm, one nucleus is an ellipse and its semiaxis lengths along x, y and z axes are 4.0 μm, 2.7 μm and 2.5 μm, respectively. The other nucleus is a sphere, and its radius is 2.5 μm. The central coordinates of the membrane, ellipsoidal nucleus and spherical nucleus are (0, 0, 0) μm, (−3.0, 0, 0) μm and (4.5, 1.5, 0) μm, respectively. For the quantitative phase distribution, the RI of the cytoplasm, the ellipsoidal nucleus and the spherical nucleus are set to be 1.37, 1.40 and 1.45, respectively. In addition, similar to the real phase imaging, the cell is required to be immersed in the matched environmental medium. Here, the refractive index of the environmental medium is set to be 1.33 in simulation.
Figure 1. (a) Binucleate cell micrograph; (b) the approximate model; (c,d) the 2D and 3D phase distribution along y axis; (e,f) the 2D and 3D phase distribution along z axis.
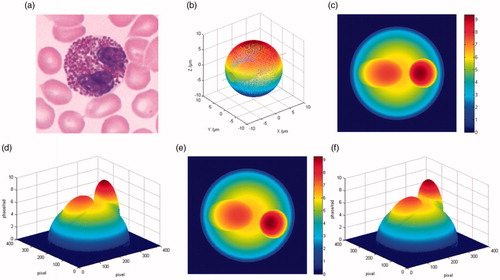
are the 2D and 3D unwrapped phases when the light travels along y axis. The image size is 400 × 400 pixels. It can be seen from that there are two embossments. However, we are not sure that they correspond to two nuclei. On account of the phase is equal to the integral of the RI and physical thickness along the optical axis, minor change in RI or morphology may introduce the embossment in the phase distribution. In order to obtain more details, we require to obtain more phase images from other illumination directions. are the 2D and 3D phases when the light propagates along z axis. It is not difficult to find that the phase distributions in the z-axis direction are highly similar to those in the y-axis direction. In fact, it is consistent with the theory according to the calculation principle of the phase. With these two orthogonal phases, we can estimate that two embossments result from the change of the refractive index.
2.2. Geometric rotation reconstruction method
In order to obtain more accurate information of cells with the natural state, their 3D morphology reconstructions are often required. Due to some blood cell morphology has typical structural features, we propose a geometric rotation method to complete the three-dimensional reconstruction. This algorithm needs to obtain the edge distribution of the phase object from the two phase images in the vertical direction at first, and then complete the reconstruction of the contour and substructure of the object by geometric rotation.
From the perspective of the phase gradient, there is a mutation in the boundary of the nucleus and cytoplasm. This mutation is caused by a change in the intracellular RI, which confirms the presence of the nucleus. The contour of the cell can be obtained by edge detection or phase gradient analysis [Citation14]. So for a cell with a typical structure, the three-dimensional structure of the cell can be reconstructed by the edge contour of the two phase images in the orthogonal direction. The internal morphology of the cell can be described by determining the central location, size, and other parameters of the nucleus.
In order to illustrate the reconstruction method only using two orthogonal phase images, we take an ellipsoid as an example to explain it. As shown in , the edge curves of AEBF and ACBD correspond to the orthogonal outlines of the ellipsoid. Then, the intersecting rotation axis AB between them can be determined, and is also the symmetry axis of them. In fact, a point on the axis AB can be regarded as the projection of the corresponding point on the curve AEBF or ACBD. And we can find that a point on the curve AEBF and a point on ABCD correspond to the same projection point. Then, the connection between a point on the curve AEBF and the corresponding projection point can form an axis. So is curve ABCD. So for each point on axis AB, two axes can be identified and can also be regarded as the long axis and short axis of the ellipse. They are defined as and
, as shown in . The elliptic parameter equation expression is as follows.
(1)
(1)
in which
. This theory can simultaneously obtain four quarters of the edge distribution and then combine them to form a complete three-dimensional surface of ellipsoid.
Figure 2. Schematic diagram of the reconstruction algorithm.
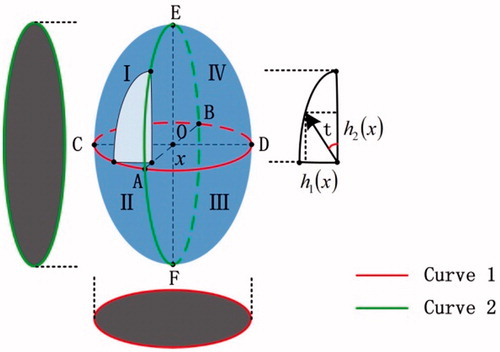
So by the aid of this idea, we can study more complex samples. We take the biological cell with multiple mediums as an example. At first, we can regard the membrane and each nucleus of a cell as some independent parts. Then, with the same rotation reconstruction way above, the 3D surfaces of the cell membrane and nucleus can be reconstructed respectively. At last, these surface images are integrated into a complete 3D surface of the cell according to their space geometry relation. For example, the cell membrane edge centers in the x-y plane and
in the x-z plane can be gotten by calculating the average value of the coordinates of each point on the edges. Then, the cell membrane center is approximately
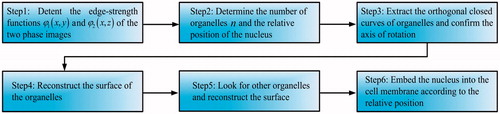
in the coordinate system. In this way, the center of the nucleus can also be determined. According to these coordinate positions, it is easily to get the complete 3D surface of the cell by embedding the nuclei into the cell membrane. The procedure of the whole 3D reconstruction is shown in .
Figure 3. Flowchart of geometric rotation reconstruction method.
3. Numerical simulations
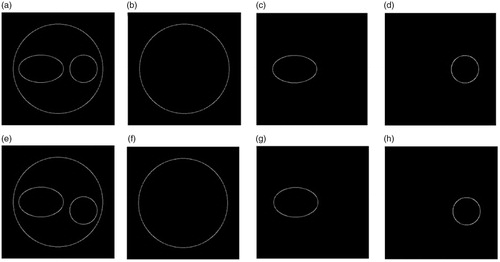
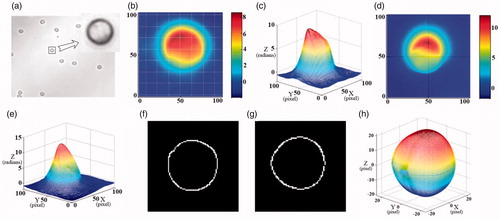
In order to prove the validity of the proposed method, we apply the numerical calculations to finish the 3D substructure reconstruction of the binucleate cell mentioned above. Firstly, Canny operator[Citation15] is applied to detect the edge-strength of the phase images. The edge contours of the cells in the two vertical directions are shown in . In addition, the junction points of the contour are marked and split for the sake of obtaining a separate contour of the cell membrane and each nucleus. are respectively the edge profiles of the cell membrane, the ellipsoidal nucleus and the spherical nucleus in the x-z plane. are the corresponding results in the x-y plane.
Figure 4. Binuclear cell contour images. (a) The edge-strength of the phase image in x-z plane, (b–d) the contours of the cell membrane, ellipsoidal nucleus and spherical nucleus, (e–h) the corresponding results in x-y plane.
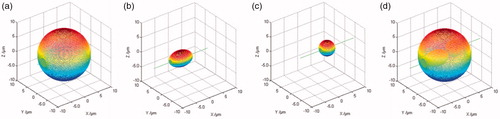
The position and size of each part of the cell can be calculated from the corresponding two orthogonal edges. Via the measurement, the edge centers of the ellipsoidal and spherical nuclei are (−3.0191, 0) μm and (4.4988, 1.4880) μm in the x-y plane, and those are (−3.0465, 0) μm and (4.4920, 0) μm in the x-z plane. Thus, the centers of the ellipsoidal and spherical nuclei are calculated as (−3.0328, 0, 0) μm and (4.4954, 1.4880, 0) μm, respectively. Then, for each part, we rotate an edge profile along the orthogonal one with the geometric rotation method mentioned in Section 2, its 3D contour can be obtained. are the reconstructed 3D surfaces of the cell membrane, ellipsoidal nucleus and spherical nucleus. Next, using the spatial coordinate relationships measured by these surfaces and the various parts, the complete three-dimensional morphology of the cell can be reconstructed, as shown in . The internal morphology of the binuclear cells can be clearly seen in the , especially the location and relative size of each nuclei. Moreover, there is a good agreement between the theoretical result () and reconstructed result (). It suggests that the method and the reconstruction process are correct and effective.
Figure 5. Dinuclear cell reconstruction results by geometric rotation algorithm. (a–c) The 3D surfaces of the cell membrane, ellipsoidal nucleus and spherical nucleus; (d) 3D complete surface of the cell.
In order to quantitatively discuss the reconstruction accuracy of our method, the associated deviations are calculated. Firstly, via the calculation, the center deviations of the cell membrane, ellipsoidal nucleus and spherical nucleus are (0, 0, 0) μm, (−0.0328, 0, 0) μm and (−0.0046, 0.0120, 0) μm comparing with their theoretical values. The errors of the radius and volume of each part are listed in . The radius of the cell membrane is 7.9220 μm with the relative error of 0.98%. The semiaxis lengths of the ellipsoidal nucleus are 3.9322 μm, 2.6364 μm and 2.4350 μm along x, y and z axes, the corresponding deviations are 0.0678 μm, 0.0636 μm and 0.0650 μm, and the corresponding relative error are 1.69%, 2.35% and 2.60%, respectively. The radius of the spherical nucleus is 2.4360 μm with the relative error of 2.56%. The errors of the cell membrane and two nuclei in volume are 62.2000 μm3, 7.4000 μm3 and 4.8000 μm3, and the corresponding relative error are 2.90%, 6.54% and 7.34%, respectively. Obviously, both the maximum errors of the radius and volume are less than 3.00% and 8.00%, respectively. As can be seen from these data, the reconstructed accuracy of this method is high.
Table 1. Reconstruction errors of each part of the cell.
4. Experimental results
In order to illustrate the reliability of our method in practice, we perform a comparative experiment. The experimental platform is made up of a metallographic inverted microscope (Olympus GX51), a flushbonading optical tweezers and the Biophase imaging system. Using the platform, we can obtain the phase image of the sample with the natural state directly.
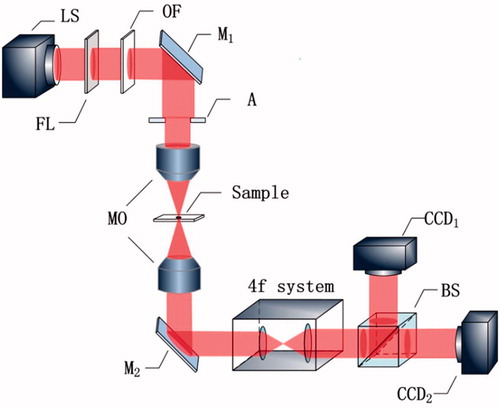
Its imaging principle is based on the transport of intensity equation (TIE), the light path diagram is as shown in . The device is illuminated with a 6 V, 30 W halogen lamp as a light source. Because of both the non-uniformity of the coherence and intensity distribution of the halogen light source, a frosted lens is used to distribute the intensity evenly, and the color filter is used to improve the coherence of the light source. First of all, the light through the Olympus GX51 metallographic inverted microscope infinity optical system focused on the sample irradiation, and then through the microscopy objective (MO) to achieve the microscopic imaging of the sample. The light through the mirror (M2) to change the direction of light to make it horizontal transmission, and then through the 4f system to ensure that the intensity of the image was equal magnification. Finally, the light passed through the beam splitter (BS), and the signals were received by the CCD on two different off-focus planes respectively. Unlike the traditional photomicrographic system based on the principle of TIE, the Biophase system used a semi-reflective mirror for recording the intensity of light on two different off-planes. The instrument used two CCDs to receive the intensity image in both directions, so that the axis of the light intensity was not obtained by moving the sample or the position of the receiver. The stage used an electric control platform to achieve accurate the positions of cells in order to achieve cells precision imaging.
Figure 6. Principle of experimental setup. LS: light source; FL: frosted lens; OF: optical filter; A: aperture; M: mirror; MO: microscopy objective; BS: beam splitter.
In our experiment, neutrophilis were selected as a sample. We conducted multiple experiments for comparative analysis. As shown in . is the bright field micrograph of some neutrophils. are the 3D unwrapped phase images. It could be seen that the phase distribution of different neutrophilis, especially the nuclear part, is different.
Figure 7. (a) The bright field micrograph of the neutrophil; (b–d) the 3D unwrapped phase images of different neutrophil.
In addition, we select a set of data for 3D reconstruction in order to verify the feasibility of this algorithm. is the bright field micrograph of the neutrophil. acquired with the system along x and y axes, respectively. are the 3D forms corresponding to . With the same reconstruction method and process in previous simulation, we finish the 3D morphology reconstruction of this neutrophil. are calculated outlines of the cell in these two orthogonal directions. is the reconstructed 3D surface of the neutrophil. It is easy to see that the projected contour of is similar to the boundary of . It indicates that our method is feasible in practical application.
Figure 8. (a) The bright field micrograph of the neutrophil; (b,d) the 2D unwrapped phase images along x and y axes; (c,e) the 3D unwrapped phase images corresponding to (b,d,f,g) the edge-strengths of the phase image in x-z and y-z planes, (h) 3D reconstruction result of the cell.
5. Conclusions
In conclusion, we present an efficient method for 3D substructure reconstruction with the curvilinear geometric rotation. In this algorithm, only two phase images in the orthogonal direction are used. By employing two edge profiles of the phases and rotating one profile along another profile, the 3D structure image of each medium can be reconstructed. Then, the whole 3D morphology spatial distribution can be obtained by embedding the nuclei into the cell membrane according to their spatial positions. The feasibility and accuracy of this algorithm are demonstrated by the simulated and experimental results. Comparing with other methods, the multiple measurements and the iterative procedures are avoided in this method, thus the 3D imaging speed is fast. This method provides a new idea for rapid batch identification of spheroid blood cells. More importantly, as long as we rotate smaller angles and more phase diagrams are used, the accuracy of the reconstruction method will be further improved. Unfortunately, this method has only been applied to several types of blood cells with typical structural features until now. In the next research work, we will extend the scope of this method to more complex biological cells.
Disclosure statement
No potential conflict of interest was reported by the authors.
Additional information
Funding
References
- Park Y, Yamauchi T, Choi W, et al. Spectroscopic phase microscopy for quantifying hemoglobin concentrations in intact red blood cells. Opt Lett. 2009;34:3668–3670.
- Wang Z, Millet L, Mir M, et al. Spatial light interference microscopy (SLIM). Opt Express. 2011;19:1016–1026.
- Samsheerali PT, Das B, Joseph J. Quantitative phase contrast imaging using common-path in-line digital holography. Opt Commun. 2012;285:1062–1065.
- Komuro K, Nomura T. Quantitative phase imaging using transport of intensity equation with multiple bandpass filters. Appl Opt. 2016;55:5180–5186.
- Rappaz B, Charrière F, Depeursinge C, et al. Simultaneous cell morphometry and refractive index measurement with dual-wavelength digital holographic microscopy and dye-enhanced dispersion of perfusion medium. Opt Lett. 2008;33:744–746.
- Lee KR, Kim K, Jung J, et al. Quantitative phase imaging techniques for the study of cell pathophysiology: from principles to applications. Sensors (Basel). 2013;13:4170–4191.
- Choi W, Fang Y, Badizadegan K, et al. Extended depth of focus in tomographic phase microscopy using a propagation algorithm. Opt Lett. 2008;33:171–173.
- Hsu WC, Su JW, Tseng TY, et al. Tomographic diffractive microscopy of living cells based on a common-path configuration. Opt Lett. 2014;39:2210–2213.
- Jung JH, Kim K, Yoon J, et al. Hyperspectral optical diffraction tomography. Opt Express. 2016;24:2006–2012.
- Habaza M, Gilboa B, Roichman Y, et al. Tomographic phase microscopy with 180° rotation of live cells in suspension by holographic optical tweezers. Opt Lett. 2015;40:1881–1884.
- Xiu P, Zhou X, Kuang C, et al. Controllable tomography phase microscopy. Opt Lasers Eng. 2015;66:301–306.
- Choi WT. phase microscopy and its biological applications. 3D Res. 2012;3:1–11.
- Xu YY, Xin ZD, Jin WF, et al. A method for determining both multiple refractive indices and 3D substructure of a binucleate cell. Opt Commun. 2016;365:113–119.
- Wang YW, Zhu Q, Xu YY, et al. Phase gradient algorithm based on co-axis two-step phase-shifting interferometry and its application. Opt Commun. 2017;405:211–215.
- Canny J. A computational approach to edge detection. IEEE Trans Pattern Anal Mach Intell. 1986;8:679–698.