
 ?Mathematical formulae have been encoded as MathML and are displayed in this HTML version using MathJax in order to improve their display. Uncheck the box to turn MathJax off. This feature requires Javascript. Click on a formula to zoom.
Abstract
The aim of this study was to analyze the characteristics of time-velocity curve acquired by phase-contrast magnetic resonance imaging (PC-MRI) using an in-vitro flow model as a reference for hemodynamic studies. The time- velocity curves of the PC-MRI were compared with Doppler ultrasonography (US) and also compared with those obtained in the electromagnetic flowmeter. The correlation between techniques was analyzed using an electromagnetic flowmeter as a reference standard; the maximum, minimum, and average velocities, full-width at half-maximum (FWHM), and ascending gradient (AG) were measured from time-velocity curves. The correlations between an electromagnetic flowmeter and the respective measurement technique for the PC-MRI and Doppler US were found to be high (mean R2 > 0.9, p < 0.05). These results indicate that these measurement techniques are useful for measuring blood flow information and reflect actual flow. The PC-MRI was the best fit for the minimum velocity and FWHM, and the maximum velocity and AG were the best fit for Doppler US. The PC-MRI showed lower maximum velocity value and higher minimum velocity value than Doppler US. Therefore, PC-MRI demonstrates more obtuse time-velocity curve than Doppler US. In addition, the time- velocity curve of PC-MRI could be calibrated by introducing formulae that can convert each measurement value to a reference standard value within a 10% error. The PC-MRI can be used to estimate the Doppler US using this formula.
Introduction
Investigating flow information in vessels is necessary to diagnosis and treatment of cardiovascular disease [Citation1–3]. The most popular non-invasive methods for measuring flow related parameters are Doppler ultrasonography (US) and phase-contrast magnetic resonance imaging (PC-MRI). Doppler US with better temporal resolution measures the blood flow in real-time [Citation4,Citation5]. However, Doppler US highly dependent on operator because it requires considerable technical ability like entry angle correction [Citation6]. PC-MRI can be used for measuring blood flow velocity non-invasively by using phase shifts in moving spins to quantify the velocity information in the flow of vessels [Citation7–10]. The PC-MRI is suitable in the various field because it is user-independent and offers the possibility of analyzing vascular hemodynamics without restrictions to anatomic coverage [Citation11].
The major use of the PC-MRI is to provide information on the hemodynamic characteristics of blood flow in vessels. Blood flow measurements to evaluate vessel stenosis are important for the diagnosis and management of patients with vessel-related disease [Citation12]. Wall shear stress is important to understand atherosclerotic plaque. WSS, friction exerted on the endothelium of vessel walls by the circulation, affects the function of endothelial cells and the development of atherosclerosis and aneurysm [Citation13–15]. Low wall shear stress is prone to developing endothelial dysfunction and vascular diseases, like atherosclerosis and intimal hyperplasia [Citation16]. PC-MRI is applied in many areas and blood flow information obtained by PC-MRI can be used to diagnose normal and pathological conditions [Citation17,Citation18]. Quantitative analysis of blood flow information of PC-MRI is therefore very important.
Many studies have quantified blood flow information using PC-MRI technique to predict disease, and there have also been attempts to verify blood flow information compared to Doppler US. Leys et al. [Citation19] measured blood flow of pig aorta to validate the precision of the PC-MRI in comparison to ultrasound. Flow measurements of ultrasound and the PC-MRI were 2.7 ± 0.6 L/min and 2.8 ± 0.6 L/min(not significantly different, p = 0.17), respectively. Yzet et al. [Citation20] measured the hepatic vascular flow of portal vein and proper hepatic artery. The maximum velocity and mean velocity of Doppler ultrasound was 49.0 ± 19.4 cm/s and 36.0 ± 13.8 cm/s in the portal vein, 134 ± 53 cm/s and 57 ± 25 cm/s in the proper hepatic artery. The maximum velocity and the mean velocity of PC-MRI for the same blood flows were 28.2 ± 8.8 cm/s and 22.9 ± 6.6 cm/s in the portal vein, 63 ± 25 cm/s and 43 ± 17 cm/s in the proper hepatic artery. Powell [Citation21] and Pant [Citation22] reported the result that the blood flow velocity measured by Doppler US were higher than there by the PC-MRI. However, the property for the detailed time-velocity curve of PC- MRI has not been described, and remain unclear. This may hamper accurate quantification of the hemodynamic characteristics of this technique, therefore it is desirable to quantify time-velocity curve for the PC-MRI.
The purpose of this study was to analyze the characteristics of modalities under a pre-determined in-vitro environment by minimizing the variables like the blood, the elastic vessel. In this study, we investigated the maximum, minimum, and average velocities, full-width at half-maximum (FWHM) and ascending gradient (AG) to quantify the time-velocity curve of the PC-MRI when measuring blood flow. Doppler ultrasound, commonly used for the quantification of PC-MRI, was considered insufficient [Citation23,Citation24] and was compared using an electromagnetic flowmeter as a reference standard [Citation25]. In- vitro experiment using the phantom model could overcome limitations in in-vivo measurements. Results from this study may help to predict the actual value of blood flow acquired from the PC-MRI.
Materials and methods
Pulsatile flow system
A pulsatile flow model was constructed and used for flow measurements. Two one-way check valves were used near the inlet and the outlet of the cylinder to control pulsatile flow output in . The rotational motion of the electric motor was transformed into a reciprocating motion using a crank and disk to allow the intake and the ejection of the fluid. The frequency of reciprocating motion is ranged from 30 rotation per minute (RPM) to 100 RPM which is corresponding to the human heart rate range. The duty ratio, the ratio between the intake and ejection time spans, in the pulsatile flow pump was set from 2:8 to 8:2 to simulate the changeable systole-diastole time ratio in the human body. The internal capacity of the cylinder, representing left ventricular volume, was adjustable between 40 cc and 90 cc [Citation26].
Figure 1. Pulsatile flow system. (a) Pulsatile flow model (front), (b) Pulsatile flow model (side), and (c) diagram of the experimental apparatus. Pulsatile flow model generating pulsatile flow was produced using a piston pump. The rotation per minute (RPM) corresponding to heart rate, and duty ratio corresponding to the ratio of systole and diastole was adjusted by DC motor and encoder. The pulsatile flow was measured using Phase-contrast magnetic resonance imaging, Doppler ultrasonography and electromagnetic flowmeter at the same location.
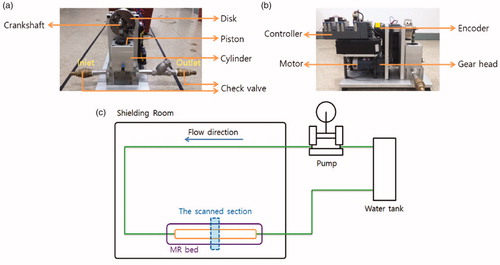
For the present study, the rotation speed was ranged from 40 RPM to 90 RPM and the duty ratio was from 3:7 to 6:4. Details about the eighteen flow patterns used for flow velocity measurement are summarized in . The pattern number indicates the type of flow pattern. Pattern 1 corresponds to 40 RPM and 3:7 of the duty ratio. Rotation per minute (RPM) and duty ratio are equivalent to heart rates and systole/diastole ratio in vivo. The internal capacity of the cylinder was set to 90 cc. The internal diameter of the flow-conducting tube was 19 mm, similar to that of an aorta. The Reynolds numbers for the maximum and mean velocities were ranged from 10,450 to 15,200 and from 4750 to 10,450 for the study, respectively. The Womersley number (α = R(ωρ/µ)1/2) that characterizes the pulsatile flow was ranged from 7.8 to 11.6 in RPM used. The pulsatile flow generated from the present flow system was evaluated using PC-MRI, Doppler ultrasonography, and the electromagnetic flowmeter in . To keep an experimental consistency, all experiments were performed at a pre-determined location in the flow system using a flat-height supporting device. During PC-MRI, an electromechanical part of the flow system was located outside MR gantry room.
Table 1. Eighteen flow patterns used for flow velocity measurement.
Measurement techniques
In the present study, we acquired time-velocity curves were acquired using PC-MRI and Doppler US. A 3.0-Tesla MRI scanner (EXCITE HD, GE Healthcare, Milwaukee, U.S.A) was used with scan parameter setting: repetition time (TR), 7.7 ms; echo time (TE), 3.3 ms; matrix size, 256 × 256; field of view, 20 cm; and slice thickness, 6 mm. 40 images per data acquisition series were obtained from PC MR scanning. For the measurement of the average flow velocity in each image, the acquired images were transferred to an independent blood flow measurement system (ReportCARD, GE Healthcare, Milwaukee, U.S.A) that is available in clinical practice.
Doppler US was performed by using a practical ultrasound scanner (HDI 5000 Sono CT, Philips, Eindhoven, Netherlands) with a linear probe at a 3–5 MHz range. We used 0.044-mm silver-coated hollow glass spheres (Potters Industries Inc., Malvern, U.S.A) to measure a velocity of fluid using the Doppler US. A silicon tube was located inside the Polyvinyl chloride (PVC) pipe to prevent the pulsation-related motion.
The device used as a reference standard for comparative analysis was an electromagnetic flow meter (VMZ204, SIKA, Kaufungen, Germany), which uses a direct measurement technique. The tolerance range of the electromagnetic flowmeter was 5–100 L/min with a measurement accuracy of 99%, the reproducibility error of 1%, and the resolution of 5 mL/pulse. Commercially available software (LabView, National Instruments, Austin, U.S.A) was used for data recording. To compare with PC-MRI data, 40 measurement values were obtained per flow cycle. Experiment condition was 40, 50, 60, 70, 80, and 90RPM. A period of each RPM was 1.5, 1.2, 1.0, 0.857, 0.75, and 0.67 s. Each of these readings had time intervals of 37, 30, 25, 21, 19, and 17 ms. For example, a period of 40RPM was 1.5 s and time intervals was 37 ms.
Data analysis
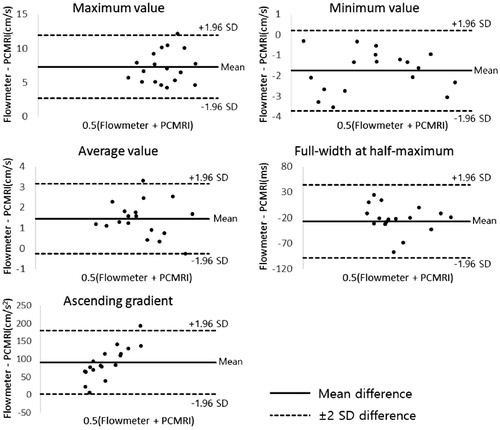
A Pearson’s correlation coefficient (R2) with SPSS 20 (SPSS Inc, Chicago, IL) was done between the reference standard data and the time-velocity plots obtained by PC-MRI and Doppler US. In addition, as flow velocity characteristics, the maximum, minimum, and average velocities, full-width at half-maximum (FWHM) and ascending gradient (AG) were measured and compared based on the reference standard data. Agreement was assessed by Bland– Altman analysis. We aligned the time-velocity curve based on the peak of a cycle and analyzed comparatively the difference of shapes in time-velocity curves ( and ).
Figure 2. Quantitative indices of blood flow pulsation. The time-velocity curve was obtained through experimental results. The time-velocity curve acquired 40 data points per period (If the period is the 1 s, the data interval is 25 ms.). y-axis is velocity and x-axis was the number of data point. a, b, c, d, and e represent the maximum value, the minimum value, the average value of 40 data points, the difference between the two independent variables to be half the maximum of the value of the time-velocity curve and the gradient between start point value and maximum value.
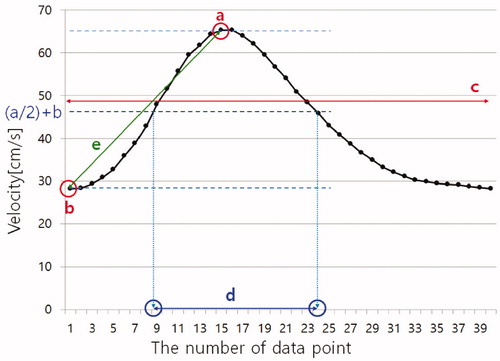
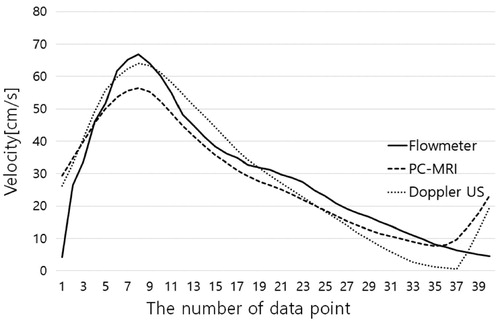
Figure 3. This time-velocity curves are acquired under conditions of 40 bpm and 4:6 duty ratio. PC-MRI has shown an obtuse pulsatility and Doppler ultrasonography showed the closest waveform to the standard waveform by the flowmeter.
The time-velocity curves of PC-MRI, Doppler US and the reference standard were obtained. By dividing the time- velocity plots at the time of the peak value into two segments, two quartic curve fitting equations were obtained. A quartic conversion equation was induced by subtracting coefficients of fitting equations from modality comparison. Firstly, we acquired a quartic curve fitting equation between electromagnetic flowmeter and each modality such as PC-MRI and Doppler US. Secondly, we subtracted quartic equations of electromagnetic flowmeter and each modality to induce conversion formulae. Thirdly, we applied conversion formula to fit each modality to electromagnetic flowmeter data. The accuracy of a conversion formula was validated by evaluating the error between reference time-velocity curve and the converted time-velocity curve.
Results
Agreement between reference standard and, PC-MRI and Doppler US was assessed by Pearson’s correlation coefficient (R2). As for PC-MRI, the R2 is about the time-velocity variables ranged from 0.929 to 0.993 (mean 0.965, p < 0.05), showing a statistically significant positive correlation. The R2 of Doppler US data ranged from 0.863 to 0.968 (mean 0.935, p < 0.05), showing a statistically significant positive correlation in . The mean correlation about the time-velocity curves was higher for PC-MRI. Measurements of the maximum, minimum, and average velocities, FWHM and AG values measured in PC-MRI data presented as Bland-Altman plots demonstrated good agreement with the reference standard electromagnetic flowmeter in .
Figure 4. The correlation coefficients of the time-velocity curve between flowmeter and PC-MRI and Doppler US. (*p < 0.05).
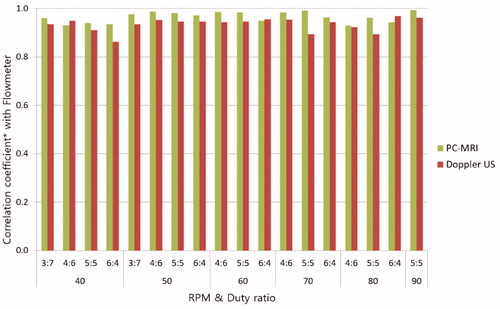
Figure 5. Bland-Altman plots for maximum, minimum, and average velocities, full-width at half-maximum (FWHM) and ascending gradient (AG) values measured in PC-MRI data of eighteen patterns compared to the reference standard electromagnetic flowmeter.
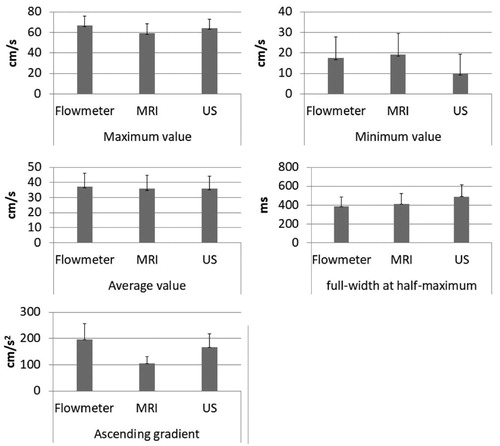
The maximum, minimum, and average velocities, FWHM and AG from the PC-MRI, Doppler US and electromagnetic flowmeter were measured. The maximum velocity of flowmeter was mean 66.51 cm/s. Doppler US had higher maximum velocity (mean 63.97 cm/s) than PC-MRI (mean 59.21 cm/s). PC-MRI showed higher minimum velocity (mean 19.33 cm/s) than electromagnetic flowmeter (mean 17.59 cm/s), while those of Doppler US was relatively low (mean 10.11 cm/s). The average velocity for PC-MRI, Doppler US and electromagnetic flowmeter were mean 35.83 cm/s, 35.97 cm/s and 37.3 cm/s, respectively. The PC-MRI and Doppler US showed lower the average velocity than the reference standard, while those of a paired t-test between PC-MRI and Doppler US were not significant difference (p = 0.82). Doppler US had higher AG value (mean 166.29 cm/s2) than PC-MRI (mean 104.98 cm/s2). The mean AG values for the electromagnetic flowmeter was 196.09 cm/s2. FWHM did not show a consistent pattern. FWHM values were larger in PC-MRI and Doppler US (mean 411.47 ms and 488.68 ms, respectively) than for the electromagnetic flowmeter (mean 384.88 ms) with an exception of few data set in and .
Figure 6. Measured values from the three modalities including ㅡ Flowmeter, PC-MRI and Doppler ultrasonography. (a) Flow pattern versus maximum velocity, (b) minimum velocity, (c) average velocity, (d) full-width at half-maximum and (e) ascending gradient. The experimental condition was the rotation speed ranged from 40 RPM to 90 RPM and the duty ratio ranged from 3:7 to 6:4 on the x-axis. Each graph showing the relationship between reference standard (Flowmeter), PC-MRI and Doppler ultrasonography. The respective time-velocity curve measurements for the electromagnetic flowmeter, PC-MRI and Doppler ultrasonography obtained under conditions of 40 bpm and 4:6 duty ratio were 66.9 cm/s, 56.8 cm/s and 64.1 cm/s, and for the maximum velocity values; 4.3 cm/s, 7.5 cm/s, and 0.5 cm/s for the minimum velocity values; 29.5 cm/s, 28.2 cm/s, and 29.3 cm/s for the average velocity values.
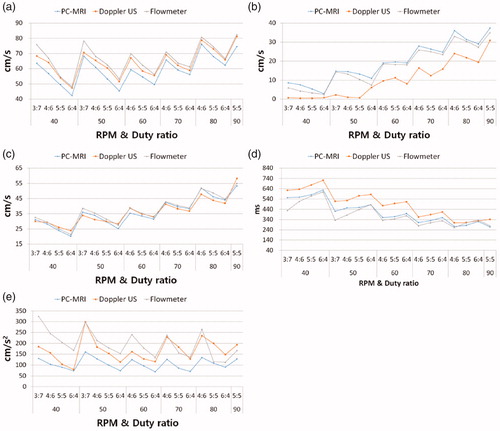
Figure 7. Average maximum, minimum, and average velocities, full-width at half-maximum (FWHM) and ascending gradient (AG) values by the three modalities. Each graph showing the relationship between reference standard (Flowmeter) and, PC-MRI and Doppler ultrasonography. Doppler ultrasonography had higher maximum velocity (mean 63.97 cm/s) more PC-MRI (mean 59.21 cm/s). PC-MRI had high minimum velocity (mean 19.33 cm/s). The minimum values of Doppler ultrasonography was mean 10.11 cm/s. The average velocity for PC-MRI, Doppler US and electromagnetic flowmeter were mean 35.83 cm/s, 35.97 cm/s and 37.3 cm/s, respectively. Doppler ultrasonography had higher gradient value (mean 166.29 cm/s2) more PC-MRI (mean 104.98 cm/s2). FWHM values of PC-MRI and Doppler ultrasonography were mean 411.47 ms and 488.68 ms, respectively.
A quartic conversion equation that can approximate the reference standard was derived. The converted time-velocity curve is presented overall error rate of less than 10% based on the reference time-velocity curve in . y1 was a quartic fitting equation of electromagnetic flowmeter. y2 was a quartic fitting equation of other techniques. A quartic equation yt the conversion formula was derived by subtracting y2 from y1 (i.e. yt = y1−y2). We could convert the time- velocity curve of other techniques into electromagnetic flowmeter time-velocity curve by substituting the data acquired through the experiment of other technique to x of a quartic equation yt in .
(1)
(1)
(2)
(2)
(3)
(3)
Figure 8. ① First segment was the start point to peak point. ② Second segment was the peak point to end point. A conversion graph (YFlowmeter1(MRI-t)) was derived to sum quartic fitting equation (YMRI1) of PC-MRI and conversion formula (Yt1) that can conversion to electromagnetic flowmeter value. The second segment was same. A conversion graph of first segment was derived by the following equations:
A conversion graph of second segment was derived by the following equations:
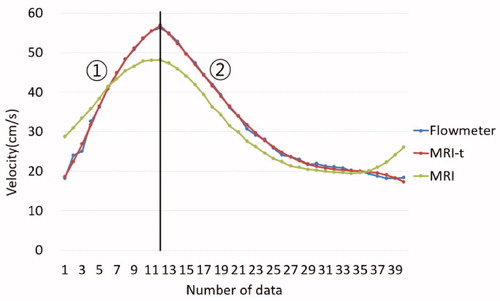
Table 2. Average percent error of 40 points between reference time-velocity curve and converted time-velocity curve.
Discussion
Hemodynamics has been reported to be closely related to the occurrence of vascular disease. Understanding hemodynamics is an important part of predicting vascular disease. While Doppler ultrasonography has been used as the standard method for measuring blood flow velocity in clinical trials, this technique has limitations such as errors due to ultrasonic entry angle correction or the inability to penetrate bone and air [Citation23,Citation24]. To compensate for these limitations, blood flow was measured using PC-MRI. PC-MRI has proved useful compared to Doppler US and already used in many fields [Citation27,Citation28]. However, characterization of pulsatile waveforms is rare. The pulsatile waveform is a very important factor in the hemodynamic analysis [Citation29,Citation30]. In this study, the characteristics of the time-velocity curve obtained by PC-MRI were investigated along with Doppler US. We investigated the time-velocity curve using the maximum, minimum, and average velocities, full-width at half-maximum (FWHM), and ascending gradient (AG). We first showed that time-velocity curves of PC-MRI and Doppler US are useful through the agreement with the reference standard. On the other hand, we have confirmed that the measured the maximum, minimum, and average velocities, FWHM and AG differ from the reference standard. We also found that there were differences according to the 18 pulsatile patterns. We proposed a calibrated value of PC-MRI through the conversion formula. The study of the characteristics of the time-velocity curve of PC-MRI is intended to provide quantitative data for hemodynamic analysis.
The reason that electromagnetic flowmeter was selected as a reference standard was accuracy and reproducibility. The electromagnetic flowmeter had high accuracy and reproducibility (accuracy 99%, reproducibility error 1%, respectively). Also, the electromagnetic flowmeter has a high resolution to acquire a data every 25 nano-seconds. Kieran et al. showed excellent agreement between PC flow rate and the gold standard Flowmeter in steady flow of straight pipe [Citation25].
The pulsatile flow pump has one ventricular structure and this is designed considering the human body’s stroke volume, heart rate, and systole-diastole time ratio. The motor to adjust RPM and duty ratio was controlled by pulse width modulation (PWM) signal with Labview. We measured the signal of the encoder to see if the motor was properly controlled. The PWM signal and encoder signal were matched well. Prior to the experiment, we validated pulsatile pump. The performance of the pulsatile pump was validated by measuring a cycle time and flow of outlet according to experimental variables. To validate the RPM corresponding to the human heart rate, the duty ratio was fixed, and experiments were conducted at 30, 60 and 90 PRM. Twenty cycles were obtained in each experiment using the flowmeter. The theoretical periods according to RPMs of 40, 50, 60, 70, 80, and 90 are 1.5, 1.2, 1, 0.86, 0.75 and 0.67 s. The result of the experimental data was mean 1.55, 1.21, 1.08, 0.88, 0.76 and 0.67 s and was consistent with theoretical values with a probability of more than 90%. To verify the stroke volume, the volume of the cylinder was fixed at 90 cc, and the actual flow rate at the outlet was measured for 30 s, also the flow rate was measured from the time-velocity curve of the flowmeter. The outlet flow rate according to RPMs of 40, 50, 60, 70, 80, and 90 were mean 88.5, 89.2, 88.3, 89.1, 88.8, and 89.3 cc, respectively. The flow rates of flowmeter are mean 88.9, 89.7, 88.9, 90.1, 90, and 91.2 cc, respectively. The error rate was less than 2%.
When we realigned time-velocity curve based on a mounting point, the difference of the peak-time for each measurement has appeared. But, we could not know whether the difference of peak-time was characteristic of each technique or not because we could not maintain the start point in a cycle when we get a data per apparatus. Thus, when we compared time-velocity curve obtained in each modality, we realigned time-velocity curve based on the peak of each cycle and analyzed the difference of shapes in time-velocity curves.
In the time-velocity curves compared with reference measurements of the electromagnetic flowmeter results, PC- MRI presents decreased AG value, which implies that PC-MRI demonstrates more obtuse time-velocity curve than electromagnetic flowmeter. Also, PC-MRI shows lower maximum velocity value and higher minimum velocity value than electromagnetic flowmeter. The PC-MRI presents the closest minimum velocity and the FWHM to the electromagnetic flowmeter. Whereas, Doppler ultrasonography shows the best fit regarding the maximum velocity and the AG with the reference standard in . Also, PC-MRI shows more obtuse time-velocity curves than those of Doppler ultrasonography. Yzet et al. [Citation20] showed that the maximum flow velocity measured by the Doppler ultrasonography was higher than the PC-MRI values in both the portal vein and the proper hepatic artery. The velocity values presented by PC-MRI are averaged value of all the pixels in a cross sectional area of the flow, which may explain why PC-MRI velocity is underestimated than Doppler spectrum showing all the velocities of reflectors within the sampling volume.
Table 3. Percent error between the reference standard and, PC MRI and Doppler ultrasonography.
In this study, no human subjects or animal parts were used, since the aim of study was focused on the difference in measured devices among blood flow measurement techniques. Using the in vitro model, common confounding factors in live subject such as vascular wall elasticity, turbulence, irregular pulsatility, and structural complexity, could be minimized in this study. In addition, inherent limitations of Doppler US and PC-MRI were minimized, which are known to be influenced by the posture of the subjects and irregular in-vivo pulsatile flow [Citation31,Citation32]. The working fluid was water at 25°C and the flow tubes were considered as rigid instead of non-Newtonian viscous fluid (blood) and elastic vascular walls. The Reynolds number of this study was calculated using the maximum velocity of each pattern, water density and viscosity. Therefore, the Reynolds number in this study was higher than the ascending aorta. Reynolds number was not considered because this study was focused on the difference between modalities. A limitation of our study is not considered for viscosity and density like blood. We created a limited environment because we focused on the characteristics analysis of each technique, but in experiments investigating the blood flow patterns, working fluid is very important factor. The results and conclusion may differ depending on the working fluid. Therefore, in future study, if we use a working fluid such as blood, we will get more meaningful results.
In conclusion, non-invasive blood flow measurement techniques (PC-MRI and Doppler US) were compared by using the electromagnetic flowmeter as a reference standard. The difference in pulsatile flow characteristics pattern was confirmed. The result of this study was showed the similar trend found in the literature [Citation33,Citation34]. This study has analyzed characteristics of time-velocity curves by measuring the maximum, minimum, and average velocities, the full-width at half-maximum (FWHM) and the ascending gradient (AG). PC-MRI has shown more obtuse pulsation characteristics and Doppler US showed the closest waveforms to the reference patterns. Moreover, we found conversion equations which allow the measured data to be compatible with those of a reference electromagnetic flowmeter. The conversion equations can help that the PC-MRI method can achieve better results.
Disclosure statement
No potential conflict of interest was reported by the authors.
Correction Statement
This article has been republished with minor changes. These changes do not impact the academic content of the article
Additional information
Funding
References
- Wang Y, West JD, Bailey JN, et al. Decreased cerebral blood flow in chronic pediatric mild TBI: an MRI perfusion study. Dev Neuropsychol. 2015;40:40–44.
- Hsieh KWV, Stein K, Mono ML, et al. In-vivo phase contrast magnetic resonance angiography of the cerebrovascular system: a comparative study with duplex sonography. Swiss Med Wkly. 2015;145:w14155.
- van der Veen PH, Muller M, Vincken KL, et al. Longitudinal relationship between cerebral small-vessel disease and cerebral blood flow: the second manifestations of arterial disease-magnetic resonance study. Stroke. 2015;46:1233–1238.
- Marrotte EJ, Mitsias P, Melvin L, et al. Real-time detection of cerebral artery rebleeding by transcranial doppler ultrasound: hemodynamic changes and response to treatment. J Clin Neurol. 2017;13:109–111.
- Radermacher J, Chavan A, Bleck J, et al. Use of Doppler ultrasonography to predict the outcome of therapy for renal-artery stenosis. N Engl J Med. 2001;344:410–417.
- Pinto A, Pinto F, Faggian A, et al. Sources of error in emergency ultrasonography. Crit Ultrasound J. 2013;5:S1.
- Persson M, Solem JE, Markenroth K, et al. Phase contrast MRI segmentation using velocity and intensity. International Conference on Scale-Space Theories in Computer Vision. Berlin, Heidelberg: Springer; 2005. p. 119–130.
- Yamada S, Watanabe Y, Oshima M, et al. Perioperative evaluation of blood volume flow in high-flow cerebral arteriovenous malformation using phase-contrast magnetic resonance angiography. Interdisc Neurosurg. 2015;2:72–75.
- Hashemi RH, Bradley WG, Lisanti CJ. MRI: the basics. Philadelphia (PA): Lippincott Williams & Wilkins; 2012. p. 310–326.
- Lee DH, Hong CP, Lee MW, et al. Reproducibility and feasibility study for Phase Contrast MR Angiography at low tesla Open-MRI system. Nuclear Science Symposium Conference Record (NSS/MIC). Piscataway (NJ): IEEE; 2010. p. 3429–3432.
- Stalder AF, Russe MF, Frydrychowicz A, et al. Quantitative 2D and 3D phase contrast MRI: optimized analysis of blood flow and vessel wall parameters. Magn Reson Med. 2008;60:1218–1231.
- Clarke GD, Eckels R, Chaney C, et al. Measurement of absolute epicardial coronary artery flow and flow reserve with breath-hold cine phase-contrast magnetic resonance imaging. Circulation. 1995;91:2627–2634.
- Chien S, Li S, Shyy JY. Effects of mechanical forces on signal transduction and gene expression in endothelial cells. Hypertension. 1998;31:162–169.
- Cheng C, Tempel D, van Haperen R, et al. Atherosclerotic lesion size and vulnerability are determined by patterns of fluid shear stress. Circulation. 2006;113:2744–2753.
- Shojima M, Oshima M, Takagi K, et al. Magnitude and role of wall shear stress on cerebral aneurysm: computational fluid dynamic study of 20 middle cerebral artery aneurysms. Stroke. 2004;35:2500–2505.
- Nordgaard H, Swillens A, Nordhaug D, et al. Impact of competitive flow on wall shear stress in coronary surgery: computational fluid dynamics of a LIMA–LAD model. Cardiovasc Res. 2010;88:512–519.
- Beerbaum P, Körperich H, Barth P, et al. Noninvasive quantification of left-to-right shunt in pediatric patients: phase-contrast cine magnetic resonance imaging compared with invasive oximetry. Circulation. 2001;103:2476–2482.
- Luetmer PH, Huston J, Friedman JA, et al. Measurement of cerebrospinal fluid flow at the cerebral aqueduct by use of phase-contrast magnetic resonance imaging: technique validation and utility in diagnosing idiopathic normal pressure hydrocephalus. Neurosurgery. 2002;50:534–543.
- Ley S, Unterhinninghofen R, Ley-Zaporozhan J, et al. Validation of magnetic resonance phase-contrast flow measurements in the main pulmonary artery and aorta using perivascular ultrasound in a large animal model. Invest Radiol. 2008;43:421–426.
- Yzet T, Bouzerar R, Allart JD, et al. Hepatic vascular flow measurements by phase contrast MRI and doppler echography: a comparative and reproducibility study. J Magn Reson Imaging. 2010;31:579–588.
- Powell AJ, Maier SE, Chung T, et al. Phase-velocity cine magnetic resonance imaging measurement of pulsatile blood flow in children and young adults: in vitro and in vivo validation. Pediatr Cardiol. 2000;21:104–110.
- Pant B, Sumida M, Arita K, et al. Usefulness of three-dimensional phase contrast MR angiography on arteriovenous malformations. Neurosurg Rev. 1997;20:171–176.
- Pugash D, Brugger PC, Bettelheim D, et al. Prenatal ultrasound and fetal MRI: the comparative value of each modality in prenatal diagnosis. Eur J Radiol. 2008;68:214–226.
- Balédent O, Fin L, Khuoy L, et al. Brain hydrodynamics study by phase‐contrast magnetic resonance imaging and transcranial color doppler. J Magn Reson Imaging. 2006;24:995–1004.
- O’brien KR, Cowan BR, Jain M, et al. MRI phase contrast velocity and flow errors in turbulent stenotic jets. J Magn Reson Imaging. 2008;28:210–218.
- Joo YH, Kwak MK, Lee CY, et al. Design of pulsatile pump and performance test for pulsatile flow generation. J Korean Soc Mar Eng. 2013;37:149–155.
- Nakamura M, Wada S, Yokosawa S, et al. Measurement of blood flow in the left ventricle and aorta using clinical 2D cine phase-contrast magnetic resonance imaging. JBSE. 2007;2:46–57.
- Boussel L, Rayz V, Martin A, et al. Phase‐contrast magnetic resonance imaging measurements in intracranial aneurysms in vivo of flow patterns, velocity fields, and wall shear stress: comparison with computational fluid dynamics. Magn Reson Med. 2009;61:409–417.
- Holdsworth DW, Norley CJD, Frayne R, et al. Characterization of common carotid artery blood-flow waveforms in normal human subjects. Physiol Meas. 1999;20:219.
- Jiang Y, Zhang J, Zhao W. Effects of the inlet conditions and blood models on accurate prediction of hemodynamics in the stented coronary arteries. AIP Adv. 2015;5:057109.
- Meyer JI, Khalil RM, Obuchowski NA, et al. Common carotid artery: variability of Doppler US velocity measurements. Radiology. 1997; 204:339–341.
- Westra SJ, Levy DJ, Chaloupka JC, et al. Carotid artery volume flow: in vivo measurement with time-domain-processing US. Radiology. 1997; 202:725–729.
- Seitz J, Strotzer M, Schlaier J, et al. Comparison between magnetic resonance phase contrast imaging and transcranial Doppler ultrasound with regard to blood flow velocity in intracranial arteries: work in progress. J Neuroimaging. 2001;11:121–128.
- Oktar SO, Yücel C, Karaosmanoglu D, et al. Blood-flow volume quantification in internal carotid and vertebral arteries: comparison of 3 different ultrasound techniques with phase-contrast MR imaging. Am J Neuroradiol. 2006;27:363–369.