
 ?Mathematical formulae have been encoded as MathML and are displayed in this HTML version using MathJax in order to improve their display. Uncheck the box to turn MathJax off. This feature requires Javascript. Click on a formula to zoom.
Abstract
A metal implant was placed in an acrylic phantom to enable quantitative analysis of the metal artifact reduction techniques used in computed tomography (CT) scanners from three manufacturers. Two titanium rods were placed in a groove in a cylindrical phantom made by acrylic, after which the groove was filled with water. The phantom was scanned using three CT scanners (Toshiba, GE, Siemens) under the abdomen CT setting. CT number accuracy, contrast-to-noise ratio, area of the metal rods in the images, and fraction of affected pixel area of water were measured using ImageJ. Different iterative reconstruction, dual energy, and metal artifact reduction techniques were compared within three vendors. The highest contrast-to-noise ratio of three scanners were 85.7 ± 8.4 (Toshiba), 85.9 ± 11.7 (GE), and 55.0 ± 14.8 (Siemens); and the most correct results of metal area were 157.1 ± 1.4 mm2 (Toshiba), 155.0 ± 1.0 (GE), and 170.6 ± 5.3 (Siemens). The fraction of affected pixel area obtained using single-energy metal artifact reduction of Toshiba scanner was 2.2% ± 0.7%, which is more favorable than 4.1% ± 0.7% obtained using metal artifact reduction software of GE scanner (p = 0.002). Among all quantitative results, the estimations with fraction of affected pixel areas matched the effect of metal artifact reduction in the actual images. Therefore, the single-energy metal artifact reduction technique of Toshiba scanner had a desirable effect. The metal artifact reduction software of GE scanner effectively reduced the effect of metal artifacts; however, it underestimated the size of the metal rods. The monoenergetic and dual energy composition techniques of Siemens scanner could not effectively reduce metal artifacts.
1. Introduction
Image artifacts caused by the presence of metals sometimes affect the interpretation of computed tomography (CT) images [Citation1,Citation2] and the planning of radiation therapy [Citation3]. Several metal artifact reduction (MAR) techniques have been developed to minimize metal artifacts in CT [Citation4–8]. Four commercially available MAR techniques are single-energy MAR (SEMAR); gemstone spectral imaging (GSI) dual-energy CT (DECT) with MAR software (MARS); iterative MAR (IMAR); and orthopedic MAR (OMAR).
SEMAR has been proven effective at improving the quality of an image in near-metal areas and providing correct CT numbers in abdominal CT [Citation9]. The image quality of scans of hip prostheses and metal embolization coils [Citation10], in addition to scans of the neck [Citation11], was also significantly improved using SEMAR. DECT with GSI-MARS resulted in less severe metal artifacts and improved the delineation of the prosthesis and periprosthetic region [Citation12]; increased diagnostic confidence in pelvic cavity assessment [Citation13]; and reduced the severity metal artifacts on cerebral CT angiography after intracranial aneurysm clipping regardless of the location and number of clips [Citation14]. The IMAR algorithm, used for CT in patients after deep brain stimulation (DBS) implantation, efficiently reduced the number of metal artifacts near DBS electrodes [Citation15] and led to artifact reduction, image quality improvement, and increased diagnostic utility in the imaging of patients with maxillofacial metal implants [Citation16]. OMAR greatly improved ability to delineate tumors and surrounding organs during the planning of radiation therapy [Citation17] and resulted in use of a lower radiation dose in the CT imaging of a total hip arthroplasty phantom [Citation18].
Several studies have compared the different MAR techniques. Kidoh et al. compared signal-to-noise ratio and visual grading analysis (VGA) between DECT based monochromatic and SEMAR CT images [Citation19], and the SEMAR technique obtained superior results. Huang et al. evaluated CT number accuracy, metal size accuracy, and streak artifact severity reduction by using several phantoms with OMAR and DECT GSI-based monochromatic CT (with and without MARS) [Citation20]; the three artifact mitigation methods obtained favorable but all different results for patients with metal implants. Andersson et al. performed VGA for images altered using the four MAR techniques, and OMAR was discovered to obtain the highest quality result [Citation21].
Of these studies, only Andersson et al. has compared more than three commercial MAR techniques regarding the results of VGA [Citation21] and CT number accuracy and noise [Citation22]. Studies comparing detailed quantitative measures for more than three MAR techniques have not been conducted. Therefore, the aim of this study was to compare quantitative measures of three manufacturer’s MAR techniques. CT number accuracy, contrast-to-noise ratio (CNR), and metal size area were measured for a self-made acrylic phantom, as was done in a previous study [Citation20]. Evaluating the area of pixels influenced by a metal artifact is crucial because the objective of MAR is to reduce the effect of metal artifacts upon the imaging of normal tissue. Therefore, the area of pixels affected by metal artifacts was also measured. Comparisons of the different iterative algorithms, DECT modalities, and MAR techniques are presented.
2. Materials and method
2.1. Phantom and metal implant
A cylindrical phantom with a diameter of 20 cm and length of 24 cm was fabricated using acrylic. A deep rectangular groove was made in the side of the cylindrical phantom that had dimensions 20 × 10 × 16 cm3. Four holes were drilled around the groove, and 2-cm-diameter hollow acrylic cylinders were inserted (). Four hollow cylinders were filled with water, air, fat, and a mixture of water and contrast medium (to simulate the CT number of bone).
Figure 1. Customized acrylic phantom. (a) A cylindrical phantom with a diameter of 20 cm and length of 24 cm and a rectangular groove was made in the side of the phantom. (b) Four hollow acrylic cylinders were inserted around the groove with water, a mixture of water and contrast medium, air, and oil (from left to right).
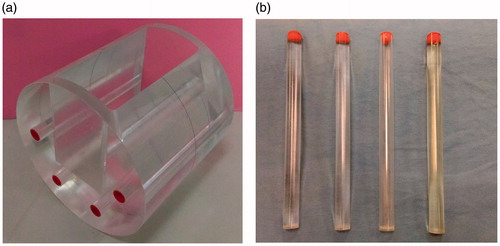
Into the groove, various metal implants could be inserted, such as bone screws, metal dentures, or artificial joints. In this study, two titanium rods (4.9 mm in radius and 8 cm in length) were fixed on the bottom of the groove of the phantom, and the remaining space of the groove is filled with water. The water in the groove was used to assess the effect of the titanium rods on the CT number of water. Changes in the CT numbers and CNRs of the four substances inside four hollow cylinders around the groove for the presence and absence of titanium rods were analyzed in all CT images.
2.2. Image acquisition
The indigenous acrylic phantom was scanned using three CT scanners: the Toshiba Aquilion ONE™ ViSION Edition (SE) (Toshiba Medical Systems, Otawara, Japan); GE Discovery™ 750HD with dual-energy (GE Healthcare, Milwaukee, WI, USA); and SOMATOM® Definition Flash with dual sources (Siemens Healthcare, Forchheim, Germany). Both the GE and Siemens scanners were used twice; once each for the single- and dual-energy protocols. The Toshiba scanner can only perform single-energy scans; therefore, it was employed only once under a setting of 120 kVp. lists the scan parameters used. All images were processed using the soft tissue kernel.
Table 1. CT scan parameters for the three CT scanners.
2.3. Metal artifact reduction techniques
In this work, we evaluated the effects of various MAR techniques of three venders, including iterative algorithm, dual-energy techniques, and MAR software.
3. Evaluated algorithm
3.1. Iterative algorithm techniques
We compared the effects of MAR implemented using three iterative algorithms: adaptive iterative dose reduction (AIDR) of Toshiba scanner, adaptive iterative reconstruction (ASIR) of GE scanner, and sinogram affirmed iterative reconstruction (SAFIRE) of Siemens scanner. The iterative proportional fitting was set to be 50% when AIDR and ASIR were employed to reconstruct images. For SAFIRE, the iterative level was set as 3 (SAFIRE provides 1–5 iterative levels), and the iteration proportional fitting was also approximately 50%.
3.2. Dual-energy techniques
We also compared the effects of using the dual-energy technique of CT scanners from GE and Siemens; the Toshiba CT scanner does not provide the dual-energy technique. The dual-energy technique of the GE scanner was performed under a tube voltage of 80/140 kVp; the dual energy was generated by rapidly switching the tube voltage of a single X-ray tube, and resulted in 110 kVp GSI reconstruction images for evaluation. The dual-energy technique of the Siemens scanner was performed under a tube voltage of 100/140 kVp; its dual energy was generated by two X-ray tubes, and resulted in 110 kVp monoenergetic reconstruction images and also dual-energy composition images.
3.3. Metal artifact reduction algorithm
Two MAR algorithm were compared—the SEMAR technique from Toshiba and MARS technique from GE. The SEMAR technique is applied to single-energy CT and only available with volume scan mode, not able to use with helical scan mode. Technicians can decide whether to use SEMAR after a scan. By contrast, MARS can only be used in dual-energy scan mode. The two MAR techniques can be adopted simultaneously with the IR technique, and the results of simultaneously using the IR technique and an individual MAR technique were compared.
4. Data analysis
4.1. CT number accuracy and CNR
Variation in CT number is caused by the presence of a metal substance affecting the CT image. The CT number of water, air, fat, and a mixture of water and contrast medium inside four hollow cylinders were measured in a circular region of interest with 100 mm2 area (). The HU of the four substances were measured from ten CT images; five captured when no metal substance was present () and five when two titanium rods were present (
). CT number accuracy (
) was calculated as EquationEquation (1)
(1)
(1) .
(1)
(1)
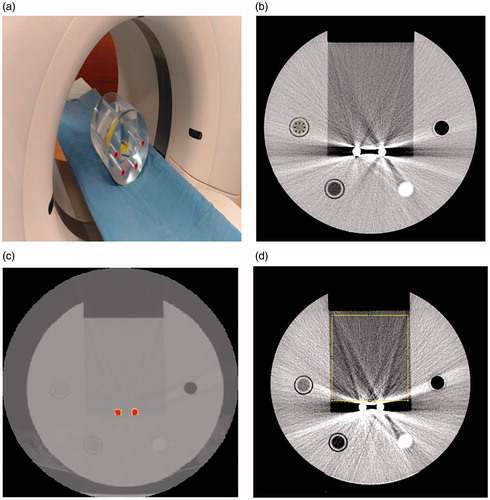
Figure 2. Experiment set up. (a) The phantom was placed on the platform of a CT scanner. Titanium rods were placed in the center of the groove, and the groove was filled with water. CT scanners from three manufacturers were used to perform CT scans. (b) Cross-section of the phantom. The acrylic tube to the upper right of the titanium rods is filled with air; the other materials, in clockwise order, are a mixture of water and contrast medium, fat, and water. (c) CT image of the titanium rods, which are indicated in red. The threshold value was set to be half the maximum HU for two titanium rods. (d) Fraction of affected pixel area (FAPA) in the CT image. The measured area was the rectangle area of water (10,000 mm2) above titanium rods. FAPA was defined as the percentage of pixels with CT number higher than 20 HU or lower than −20 HU inside the rectangle area.
The average CT number accuracy () was calculated from ten selected CT images.
CNR in EquationEquation (2)(2)
(2) was calculated from the average CT number of water (
), air (
), and also the noise of air (
). The average CNR was calculated with five CT images captured when titanium rods were present.
(2)
(2)
Images with more favorable MAR technique were associated with a smaller CT number difference () and higher CNR.
4.2. Metal area
The average area of two titanium rods from five images of each CT image group was measured. The threshold value was half the maximum CT number of titanium rods (). The measured and actual areas of the rods were compared; the area of the two actual titanium rods was calculated from the rods’ radius (4.95 mm) and was thus 153.9 mm2. With better MAR technique, the measured metal area was closer to actual area of titanium rods.
4.3. Fraction of affected pixel area (FAPA)
For each MAR technique, WE defined a 10,000 mm2 rectangle area above two titanium rods in the groove of the phantom (). Inside the rectangle area, those pixels with CT number between +20 and −20 HU were defined as the water area (). Pixels with CT number outside ±20 HU were noise and artifacts from titanium rods. The fraction of affected pixel area (FAPA) was calculated as EquationEquation (3)
(3)
(3) .
(3)
(3)
FAPA was expected to be less when advanced MAR technique was applied to CT images. All CT images were measured using ImageJ (Java 1.8).
4.4. Statistical method
One-way analysis of variance and the Bonferroni post hoc test were used to examine the differences between data groups. Regarding the CT number accuracy (), the MAR technique developed by each manufacturer was evaluated by comparing images before and after each technique’s application. The CNR, metal area, and FAPA of CT images from different manufacturers were also compared.
5. Results
5.1. CT number accuracy ( )
)
The CT number accuracy of each group of images is presented in . In the images obtained using the Toshiba scanner, the smallest for water, fat, and air (1.9 ± 1.8, 13.5 ± 4.2, and 6.8 ± 3.4, respectively)were obtained when SEMAR and AIDR were used, but only the CT number of air was significantly different compared with the uncorrected images (p < 0.001); in contrast, the
of the water–contrast medium mixture was even worse in the SEMAR images compared to uncorrected images (p < 0.001). With AIDR technique,
did not improve in four measured substances.
Table 2. CT number accuracy results.
Regarding the group of GE scanner images, the smallest for water was obtained using MARS (4.3 ± 2.5, p = 1.0); for water–contrast medium mixture, MARS + ASIR (5.1 ± 4.2, p < 0.001); but
were worse with fat and air in MARS groups. With GSI technique,
were better in fat, air, and water–contrast medium mixture, but did not show better result in water. With ASIR technique,
also did not improve in four measured substances.
In the group of images obtained using the Siemens scanner, no technique effectively improved
5.2. CNR
The CNR results for each group of images are shown in . In the comparison of IR techniques, AIDR exhibited the highest CNR value (81.0 ± 8.8), which was significantly different from those of ASIR and SAFIRE (p < 0.001). For dual-energy techniques, GSI and ASIR exhibited higher CNR than DE-composition and SAFIRE (85.9 ± 11.7 and 55.0 ± 14.8, p = 0.001). In the group of MAR techniques, SEMAR exhibited higher CNR than MARS (85.7 ± 8.4 and 72.8 ± 8.0, p = 0.038).
Table 3. Measurement results of CNR, metal area, and fraction of affected pixel area (FAPA).
5.3. Metal area
The metal area measurements are listed in . In the IR group, AIDR resulted in the most accurate metal area (165.9 ± 3.5 mm2); however, this result was not significantly different from that obtained using ASIR (174.4 ± 9.9 mm2, p = 0.269). In the dual-energy group, GSI with ASIR technique led to the lowest metal area compared to DE-composition with SAFIRE technique (155.0 ± 1.0 mm2and 170.6 ± 5.3 mm2, p < 0.001). In the MAR group, MARS with ASIR technique resulted in the smallest metal area compared to SEMAR with AIDR technique (95.6 ± 2.0 mm2 and 157.1 ± 1.0 mm2, p < 0.001); however, the calculated area with MARS technique was much smaller than the actual area of the rods (153.9 mm2).
5.4. Fraction of affected pixel area (FAPA)
The results of FAPA caused by metal rods in the water area of the phantom are also presented in . In the IR group, AIDR resulted in the lowest FAPA (19.4 ± 3.0%), which was significantly different from ASIR and SAFIRE (29.5 ± 1.8% and 30.4 ± 1.4%, p < 0.001). In the dual-energy group, GSI with ASIR obtained a relatively small FAPA compared to DE-composition with SAFIRE (9.9 ± 0.9% and 28.6 ± 1.4%, p < 0.001). In the MAR group, SEMAR with AIDR had the lowest FAPA, 2.2 ± 0.7%, which was significantly different from that obtained using MARS with ASIR (4.1 ± 0.7%, p = 0.002) and also the best FAPA in all images.
6. Discussion
6.1. Quantitative assessment
The results of this study demonstrated that in most cases, SEMAR and MARS effectively reduced the error in CT numbers due to metal rods. However, the improvements did not represent significant differences from the uncorrected images; this was because of the considerably large variation of the uncorrected image. Streak artifacts caused by metal may not necessarily have been present over the areas corresponding to the four substances in each image, resulting in some images having large and some having small CT number errors. Therefore, when comparing the effect of MAR using CT number errors, the direction of streak artifacts in each image for different scan series should be carefully considered. SEMAR effectively reduced the CT number errors of water, fat, and air; however, it could not reduce the error of the water and contrast medium mixture; in fact, it substantially increased the error. MARS considerably reduced the CT number errors of water and the mixture of water and contrast medium; however, it increased the errors of fat and air. For the IR technique, none of AIDR, ASIR, and SAFIRE could effectively reduce the CT number errors of the four substances.
Regarding the CNR results, the IR, dual-energy, and MAR techniques effectively improved the CNR because the amount of noise was reduced. However, no difference was discovered between the CNR value for the SEMAR with AIDR method and the AIDR only method (85.7 ± 8.4 and 81.0 ± 8.8, respectively). Even the CNR obtained using GSI with ASIR was higher than that obtained using MARS with ASIR (85.9 ± 11.7 and 72.8 ± 8.0, respectively). show that the IR and dual-energy techniques did not significantly reduce the effect of metal artifacts on images. Therefore, using the CNR or noise to evaluate MAR technique was not the ideal approach. The results of metal area measurement showed that the rod area measured using MARS was much smaller than the actual metal rod area. This was also mentioned in another study [Citation20]. The metal area measured from SEMAR images approximated the actual metal area (153.9 mm2), as was that obtained using GSI with ASIR.
Figure 3. Application of MAR techniques to the phantom images obtained using the three CT scanners with FAPA (fraction of affected pixel area) results. (a) Uncorrected Toshiba CT image; (b) after using AIDR; (c) after using SEMAR; and (d) after using AIDR with SEMAR. (e) Uncorrected GE CT image; (f) after using ASIR; (g) after using GSI with ASIR; and (h) after using MARS with ASIR. (i) Uncorrected Siemens CT image; (j) after using SAFIRE; (k) after using monoenergetic reconstruction with SAFIRE; and (l) after using DE-composition with SAFIRE. FAPA: fraction of affected pixel area.
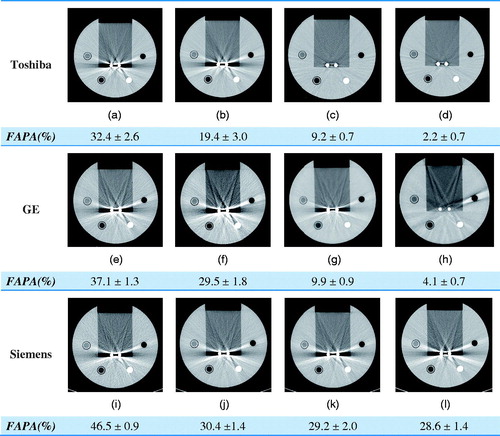
Among all the results, the best were consistently obtained for FAPA. As shown in , both SEMAR and MARS substantially reduced the effect of metal artifacts and FAPA. MAR software was discovered to be substantially superior to the various IR algorithms and dual-energy techniques. Therefore, measuring the area in which the CT numbers of homogeneous materials change due to metal artifacts demonstrates the beneficial effect of MAR technique.
6.2. Comparison between vendors
In the comparison of MAR techniques, the CNRs obtained using SEMAR were higher than those obtained using MARS, and comparison of these methods obtained the same finding regarding FAPA. The metal area obtained using MARS was much smaller than that obtained using SEMAR and was smaller than that of the actual rods. As indicated in , the effect of SEMAR was stronger than that of MARS. This study did not analyze images by using the orthopedic metal artifact reduction algorithm (OMAR); however, a previous study discovered that MARS obtains superior results to OMAR regarding streak artifact area for two types of metal implants, namely artificial teeth and hip joints [Citation20]. In another study, the results of VGA indicated that OMAR obtained more favorable image interpretation results than SEMAR and MARS [Citation21].
In the comparison of IR techniques, AIDR showed the optimal performance for CNR, metal area, and FAPA. AIDR was followed by ASIR, and finally SAFIRE. Although the three techniques increased CNRs and reduced FAPA, they did not considerably reduce the severity of metal artifacts ().
A comparison of the dual-energy techniques shows that the CNR obtained using GSI was higher than that obtained using DE-composition, and FAPA obtained using GSI was much lower than that obtained using DE-composition; both differences were statistically significant. GSI had a slight MAR effect (). The monoenergetic and DE-composition techniques of Siemens failed to effectively reduce metal artifacts, although in the DE-composition imaging measurement, the CNR, metal area, and FAPA all had superior values to those of the uncorrected images.
6.3. Limitation of the preliminary study
This study analyzed the SEMAR and MARS techniques rather than the OMAR or IMAR techniques because they are not yet available in the nearby region. Huang analyzed the MARS and OMAR techniques [Citation20]; however, no study has compared IMAR with the other three techniques. Including the analysis of IMAR will render the comparison of MAR technique more complete. This study analyzed only the effect of titanium rods on the imaging of surrounding tissue in a customized phantom and did not evaluate the effect of other common metal implants (e.g., hip joints and dentures). Hip joints, dentures, or other metal items can also be placed in the groove of the phantom before the space is filled with water; the phantom can be used repeatedly, and only the metal substance should be replaced.
The scan conditions used in the study were all common conditions used clinically and were not optimally adjusted for the MAR technique of each machine. Therefore, the performance was not necessarily optimal. The best MAR conditions for each CT should be determined in further research and analysis.
7. Conclusion
This study successfully used a customized acrylic phantom containing metal rods to analyze the MAR effects of three CT scanners from different manufacturers. SEMAR resulted in the optimal estimation of affected pixel area and had the strongest MAR effect. MARS also significantly reduced the effect of metal artifacts; however, it underestimated the size of the metal objects. Although the quantitative analysis results were improved for all the IR techniques, no significant improvement in images was observed. Of the dual-energy techniques, only GSI could slightly reduce the effect of metal artifacts. The monoenergetic techniques and DE-composition did not achieve significant results.
Acknowledgement
Thanks to colleagues in the radiology department of Yuan’s General Hospital, Kaohsiung Chang Gung Memorial Hospital, and E-Da Cancer Hospital for their assistance in this study. Sincere thanks to Yuan’s General Hospital for meeting all the related costs of this study. Research No. YGH-IUCRP-17-11.
Disclosure statement
No potential conflict of interest was reported by the authors.
References
- Omar G, Abdelsalam Z, Hamed W. Quantitative analysis of metallic artifacts caused by dental metallic restorations: comparison between four CBCT scanners. Future Dent J. 2016;2:15–21.
- Liu P, Pavlicek W, Peter M, et al. Metal artifact reduction image reconstruction algorithm for CT of implanted metal orthopedic devices: a work in progress. Skeletal Radiol. 2009;38:797–802.
- Paudel M, Mackenzie M, Fallone B, et al. Clinical evaluation of normalized metal artifact reduction in kVCT using MVCT prior images (MVCT-NMAR) for radiation therapy treatment planning. Int J Radiat Oncol Biol Phys. 2014;89:682–689.
- Zhang Y, Yan H, Jia X, et al. A hybrid metal artifact reduction algorithm for x-ray CT. Med Phys. 2013;40:041910.
- Mehranian A, Ay M, Rahmim A, et al. 3D prior image constrained projection completion for X-ray CT metal artifact reduction. IEEE Trans Nucl Sci. 2013;60:3318–3332.
- Nam H, Baek J. A metal artifact reduction algorithm in CT using multiple prior images by recursive active contour segmentation. PLoS One. 2017;12:e0179022.
- Peng C, Qiu B, Li M, et al. Gaussian diffusion sinograminpainting for X-ray CT metal artifact reduction. BioMed Eng OnLine. 2017;16:1.
- Joemai R, de Bruin P, Veldkamp W, et al. Metal artifact reduction for CT: development, implementation, and clinical comparison of a generic and a scanner-specific technique. Med Phys. 2012;39:1125–1132.
- Sofue1 K. 2018. ECR 2014/C-0674/Abdominal CT with Single-Energy Metal Artifact Reduction (SEMAR): Initial Experiences - EPOS™. [online] Posterng.netkey.at. Available at: http://posterng.netkey.at/esr/viewing/index.php?module=viewing_poster&pi=121748 [Accessed 5 Jun. 2018].
- Sonoda A, Nitta N, Ushio N, et al. Evaluation of the quality of CT images acquired with the single energy metal artifact reduction (SEMAR) algorithm in patients with hip and dental prostheses and aneurysm embolization coils. Jpn J Radiol. 2015;33:710–716.
- Yasaka K, Kamiya K, Irie R, et al. Metal artefact reduction for patients with metallic dental fillings in helical neck computed tomography: comparison of adaptive iterative dose reduction 3D (AIDR 3D), forward-projected model-based iterative reconstruction solution (FIRST) and AIDR 3D with single-energy metal artefact reduction (SEMAR). Dentomaxillofac Radiol. 2016;45:20160114.
- Lee Y, Park K, Song H, et al. Metal artefact reduction in gemstone spectral imaging dual-energy CT with and without metal artefact reduction software. Eur Radiol. 2012;22:1331–1340.
- Han S, Chung Y, Lee Y, et al. Metal artifact reduction software used with abdominopelvic dual-energy CT of patients with metal hip prostheses: assessment of image quality and clinical feasibility. Am J Roentgenol. 2014;203:788–795.
- Dunet V, Bernasconi M, Hajdu S, et al. Impact of metal artifact reduction software on image quality of gemstone spectral imaging dual-energy cerebral CT angiography after intracranial aneurysm clipping. Neuroradiology. 2017;59:845–852.
- Aissa J, Boos J, Schleich C, et al. Metal artifact reduction in computed tomography after deep brain stimulation electrode placement using iterative reconstructions. Invest Radiol. 2017;52:18–22.
- Hakim A, Slotboom J, Lieger O, et al. Clinical evaluation of the iterative metal artefact reduction algorithm for post-operative CT examination after maxillofacial surgery. Dentomaxillofac Radiol. 2017;46:20160355.
- Jani S. SU-E-I-63: quantitative evaluation of the effects of Orthopedic Metal Artifact Reduction (OMAR) software on CT images for radiotherapy simulation. Med Phys. 2014;41:144–144.
- Wellenberg R, Boomsma M, van Osch J, et al. Low-dose CT imaging of a total hip arthroplasty phantom using model-based iterative reconstruction and orthopedic metal artifact reduction. Skeletal Radiol. 2017;46:623–632.
- Kidoh M, Utsunomiya D, Oda S, et al. CT venography after knee replacement surgery: comparison of dual-energy CT-based monochromatic imaging and single-energy metal artifact reduction techniques on a 320-row CT scanner. ActaRadiologica Open. 2017;6:205846011769346.
- Huang J, Kerns J, Nute J, et al. An evaluation of three commercially available metal artifact reduction methods for CT imaging. Phys Med Biol. 2015;60:1047–1067.
- Andersson K, Norrman E, Geijer H, et al. Visual grading evaluation of commercially available metal artefact reduction techniques in hip prosthesis computed tomography. BJR. 2016;89:20150993.
- Andersson K, Nowik P, Persliden J, et al. Metal artefact reduction in CT imaging of hip prostheses—an evaluation of commercial techniques provided by four vendors. BJR. 2015;88:20140473.