
 ?Mathematical formulae have been encoded as MathML and are displayed in this HTML version using MathJax in order to improve their display. Uncheck the box to turn MathJax off. This feature requires Javascript. Click on a formula to zoom.
Abstract
In coastal environments, strong feedback can exist between benthic fauna and sediment dynamics. Benthic populations can modify sediment dynamics through biofiltration and bioturbation, while hydro- and sediment dynamics directly determine local environmental conditions for benthic organisms. However, these complex feedbacks are difficult to study in situ. Here, we carried out mesocosm experiments to characterize the effects of a benthic species (the gastropod Crepidula fornicata) on mud dynamics under hydrodynamic conditions representative of their natural habitat. Different experimental tests related to the inclusion (or not) of dead or live crepidula reveal that biofiltration can increase particle settling up to 40%. Flocculation, which is strengthened by organic matter enrichment in shell beds, also substantially increases particle settling. Thus, both processes enhance sedimentation above live crepidula habitats. Furthermore, these experiments highlight serious technical, physical and biological challenges that have to be tackled for properly investigating bio-physical interactions.
1. Introduction
In coastal and estuarine areas, benthic-pelagic coupling largely contributes to dissolved and particulate matter fluxes (e.g. sediments, nutrients, pollutants), primary production dynamics as well as energy transfers within food webs. The relative importance of benthic and pelagic primary productions for sustaining benthic invertebrate communities depends on many factors, such as water depth, hydrodynamics, bed coverage, nutrient availability and benthic biodiversity.
Physical (i.e. biotope) and biological (i.e. biota: flora and fauna) compartments are often studied independently. However, recent studies highlight nonlinearities in hydro-bio-geochemical processes due to strong interactions between physical and biological processes (e.g. Graf and Rosenberg Citation1997; Murray et al. Citation2002; Rice et al. Citation2016). Benthic species can modify their habitat either via their physical disturbance (e.g. bed roughness, sediment trapping) or their biological activities (e.g. bioturbation, biofiltration and biodeposition) (Orvain et al. Citation2004). These hydro-bio-sediment interactions directly impact particulate fluxes at the water-sediment interface (e.g. Orvain and Sauriau Citation2002; Reise Citation2002; Widdows et al. Citation2002; Le Hir et al. Citation2007; Ganthy et al. Citation2013; Kombiadou et al. Citation2014).
Coastal benthic habitats are by definition variable, for instance in terms of hydrodynamics (e.g. wind-, tide- and wave-induced currents), bed substrate (e.g. mud-sand bed coverage) and biogeochemical conditions (e.g. season-changing organic matter (OM) contents). Moreover, complex feedback between biological and physical processes remains difficult to study in situ and small-scale (i.e. at the scale of ∼0.1–1 m2) laboratory experiments are by definition limited in their simplified representation of marine environments. Hence, mesocosm experiments constitute a valuable option to perform controlled studies on these complex feedbacks. However, physically simulating bio-sediment interactions under realistic conditions remains challenging at any scale, as it requires the generation of tide- and wave-induced current while maintaining live benthic organisms in a cohesive sediment (i.e. mud) bed. The presence of mud induces additional complexity over non-cohesive sediments, which remains difficult to characterize in mesocosm experiments. Among the most relevant mechanisms: (i) flocculation processes increase the mud settling velocity, increasing suspended sediment deposition (e.g. Gibbs Citation1985; van Leussen Citation1994; Manning and Dyer Citation1999; Winterwerp et al. Citation2006; Verney et al. Citation2009); and (ii) bed consolidation processes reduce the sediment erodibility, reducing sediment resuspension (e.g. Gibson et al. Citation1967; Toorman and Berlamont Citation1993; Merckelbach and Kranenburg Citation2004; Grasso et al. Citation2015).
The slipper limpet Crepidula fornicata (crepidula) is a gregarious invasive gastropod originating from the Northeastern American coastline that gradually invaded the Atlantic European coastline and became dominant around the English Channel and Bay of Biscay since 1980s (Blanchard Citation1995, Citation1997). It has large impacts on colonized ecosystems (Kostecki et al. Citation2011) for instance by consolidating hard substrate shell beds on soft sediment (Ehrhold et al. Citation1998), especially in the Bay of Brest in NW France (referred to as “BoB” hereafter). Following its 40-year expansion within the BoB, this “engineer” species has significantly modified benthic habitats. For instance, dead and live crepidula beds are now commonly found in most tidal channels of the BoB. Studies investigating crepidula-biotope interactions identified that three processes primarily drive bio-sediment dynamics within such habitats: (i) hydrodynamics at the bed level (Moulin et al. Citation2007), (ii) sediment erodibility (Beudin et al. Citation2013), and (iii) biodeposition induced by biological activity of organisms, especially the filtration process (Androuin et al. Citation2018). Biofiltration is related to organisms’ filter-feeding activity, which help them capture particles (mineral and organic) from the water column. In addition to feces excreted as digestion by-products, pseudo-feces are ejected by the organisms (i.e. agglomerates enriched with mucus that result from a pre-ingestive phase) and constitute a significant part of the non-food particles (especially mineral particles). Both these biological excreta enrich sediment with fine cohesive particles and organic matter. Biodeposition associated with filtering activity increases with particle matter concentration in the water column (Barillé et al. Citation2006). In addition, such environments represent productive areas for biofilm development, impacting sediment erodibility (Tolhurst et al. Citation2002; Orvain et al. Citation2004). Nonetheless, little is known about the relative contribution of these processes to suspended sediment dynamics.
Here, we set up mesocosm experiments using an annular flume that can generate wave and current conditions to investigate the relative contribution of physical and biological processes to suspended sediment dynamics on crepidula beds. We performed comparative series, (i) with and without shells of (ii) dead or alive crepidula. Under each setting, we specifically registered both sediment resuspension dynamics (i.e. “erosion phase” with increasing current conditions) and sediment settling dynamics (i.e. “settling phase” without current). Due to technical difficulties related to sediment bed erodibility changing over the course of the experiment due to consolidation processes and/or biofilm development, we could not properly analyse the erosion phase. Consequently, we solely focused on the sediment settling phase. This study specifically aims at investigating the relative contribution of biological (i.e. biofiltration) and physical (i.e. flocculation) processes on particle settling velocity. Firstly, we describe the methodology and experimental set-up (Section 2) and then we present suspended particulate matter (SPM) dynamic results (Section 3). Section 4 is dedicated to the discussion on the influence of physical and biological processes on particle settling, and on the limitations of our mesocosm experiments.
2. Material and methods
2.1. Experimental set-up
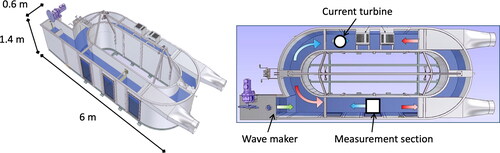
We used an annular flume facility in which current and waves can be generated over a mimicked crepidula bed (see details below). Experiments were carried out during four weeks within the “Polludrome” flume tank at the CEDRE, i.e. the Centre of Expertise in Accidental Water Pollution (Brest, France) (Grasso et al. Citation2018). The flume tank is 1.4-m high, 0.6-m wide and 13-m long, covering an area of 8 m2 (). Throughout the experiment, we fixed water depth to 0.8 m. Currents, which were generated by a turbine located 0.3 m above the bottom, reached up to ∼0.25 m/s. Artificial waves reached significant height of ∼0.17 m and periods lower than 3 s, which induced orbital wave velocities up to ∼0.25 m/s. The experimental conditions, in terms of currents and waves, were representative of wave- and tidal-driven environmental conditions in the BoB, where crepidula beds are typically found at depth of ∼10–15 m. Thus, water depth in the flume was not representative of natural conditions, but sufficient not to affect bottom boundary layer dynamics, which was ∼15 cm thick. In addition, we reasonably assumed that reduced water depth (pressure) did not significantly affect crepidula behaviour.
Figure 1. Schematic of the annular flume “Polludrome” used in these mesocosm experiments to generate current and waves over a muddy bed with seawater.
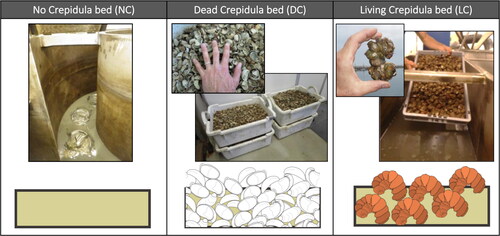
We created crepidula beds that covered the whole bottom of the flume. The 10-cm thick bed was composed of a natural mud collected in the BoB at the location where crepidula shells were collected (d10 = 2 µm, d50 = 10 µm, d90 = 60 µm, representing the 10th, 50th and 90th percentiles of the sediment grain size distribution, respectively). Dead and live crepidula were dredged from natural dead and live shell banks, respectively, and distributed over the entire surface of the flume bottom to ensure a homogeneous shell bed cover. In the experiments, shell densities corresponded to the highest densities observed in the BoB, reaching 12 kg/m3 and 16 kg/m3 for dead and live crepidula banks, respectively. The number of shells was approximately the same for dead and live crepidula conditions, but the biomass was higher for live animals (due to flesh wet weight). Nonetheless, the bed roughness was slightly different, as live crepidula form chains of stacked shells, whereas dead crepidula are individual empty shells ().
. Schematics of the three experimental series conducted in the flume: (left panel) with no crepidula (NC), (centre panel) with dead crepidula shells (DC) and (right panel) with stacks of live crepidula (LC).
Once collected, live crepidula were firstly acclimated during one-day in an oxygenated tank, and then another day in the flume after having been distributed over the sediment bed. We used sea water containing enough food resources for crepidula to survive during the experiments. In addition, air bubbling systems ensured oxygenation of the water column.
2.2. Experimental conditions
To investigate the physical and biological processes driving sediment dynamics, alternative series of tests were conducted by combining absence and presence of crepidula (dead and alive) under different hydrodynamic conditions. A first series was conducted with a bare sediment bed without crepidula (NC); another series of tests was conducted with the same sediment bed as NC, but with dead crepidula (DC); then dead shells were removed from the flume to conduct a series with the same sediment covered with stacks of live crepidula (LC) ( and ).
Table 1. Timetable of the experiments: series and associated tests with no crepidula (NC), dead crepidula (DC) and live crepidula (LC); for current only (C) and wave + current (C + W) forcing conditions.
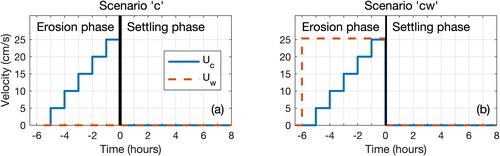
For each series, different tests were carried out with variable hydrodynamic conditions (). Alternative scenarios mimicked an erosion phase due to tidal current (Uc), where current velocity was gradually increased from 0 to 0.25 m/s following an hourly stepwise increase of 0.05 m/s. Following this 6-hour erosion phase, a settling phase with no current and no waves was monitored for 8 hours. Scenarios denoted as “c” only included unidirectional current (), while scenarios denoted as “cw” also included wave-generated orbital current ().
Figure 3. Schematics of hydrodynamic conditions generated for scenarios: (a) with only current “c” and (b) with current and waves “cw.” Uc and Uw are the current and wave orbital velocities, respectively.
As stated in the introduction, we only focused on results obtained during the 8-hour settling phase, where initial conditions at time t = 0 depend on sediment resuspension generated during the 6-hour erosion phase. We compared the results from nine tests that correspond to different bottom layer and environmental conditions, namely: with no crepidula (NC1c), with dead crepidula (DC1c, DC2cw and DC3c) and with live crepidula (LC1c, LC2c, LC3c, LC4cw and LC5c), as presented in . These experiments were carried out sequentially over 27 days.
2.3. Instrumentation and measurements
Both sediment and shells were homogeneously distributed along the flume, but the measurement section was located in front of the centre window at the opposite end from the current generator (). Hydrodynamics was monitored continuously at 10 Hz using two velocimeters (Acoustic Doppler Velocimeter, ADV) deployed in the middle of the flume section at 13 and 38 cm above the bottom. Sediment dynamics was monitored continuously at 2 Hz using two turbidimeters (Optical Backscatter Sensors, OBS), which were located near the flume wall at the same elevation as the ADVs, and directed toward the middle of the section. We also relied on the ADVs to estimate a backscatter index (BI), i.e. the signal/noise ratio (SNR) that quantifies turbidity levels.
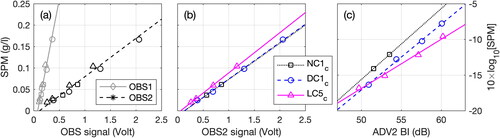
In addition to these continuous measurements, water samples were collected in the vicinity of the instruments under three tests and different current velocities: with no crepidula (NC1c, day 1) at the beginning of the experiments, with dead crepidula (DC1c, day 6) and with live crepidula (LC5c, day 27) at the end of the experiments. Water samples were used to quantify the SPM concentration expressed in g/l, so as to calibrate the optical turbidity measurements (OBS). A unique calibration coefficient was used per OBS sensor all along the experiments, associated with uncertainties of ±5% (). However, these time-averaged uncertainties reflect an actual increase (+10%) in optical calibration coefficients (SPM vs OBS signal) throughout the 27-day experimental period (e.g. OBS sensor at mid-water column, ). Changes in acoustic measurements (SPM vs BI) were also observed (). Such behaviours are discussed in Section 4.2.
Figure 4. Relation between SPM concentration measured from water samples versus: (a) optical signal measured from OBS1 (gray) and OBS2 (black), and corresponding OBS calibration coefficients (lines); (b) optical signal measured from OBS2; and (c) backscatter index BI measured from ADV2. In (a–c), symbols represent tests with no crepidula (square: NC1c), dead crepidula (circle: DC1c) and live crepidula (triangle: LC5c).
Based on the collected water samples, OM content was measured by loss of ignition, and the deflocculated SPM size distribution was measured by a LISST (Laser In-Situ Scattering and Transmissometery) after 2 minutes of ultra-sonication. Bed sediment samples were collected at the ADV and OBS measurement location for grain size analysis, using a MALVERN laser granulometer, during the experimental period (tests NC1c, DC1c and LC5c). Unfortunately, the high-level of turbidity did not allow imagery systems to register biofiltration activity. In addition, before and after each test with live crepidula (LC), we measured water temperature at mid-water column and oxygen content (O2) both at the bottom and at the surface. Note that the air bubbling system was switched off during the experiments not to disturb OBS and ADV measurements.
3. Results
We first present our experimental results in terms of (i) sediment grain size distribution within the bed, and SPM size and OM content into the water column, and (ii) changes in water temperature and O2 for tests with live crepidula. Secondly, we present SPM dynamics and associated settling velocities and compare these results across the nine tests.
3.1. Sediment grain size and organic matter content
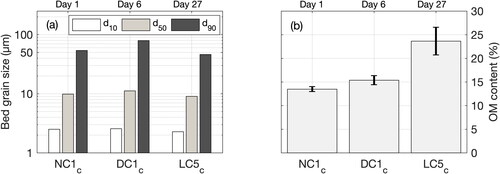
Sediment grain size distribution within the bed was estimated for tests NC1c (day 1), DC1c (day 6) and LC5c (day 27) (). The 10th, 50th, and 90th percentiles of the sediment grain size distribution did not significantly change during the experiments with d10 = 2 ± 1 µm, d50 = 10 ± 1 µm and d90 = 60 ± 17 µm (values are averages and standard deviations, respectively). It confirms that the sediment grain size within the bed was similar throughout the different tests.
Figure 5. (a) Sediment grain size distribution of the bed at the measurement location and (b) organic matter content in the water column for tests with no crepidula (NC1c), dead crepidula (DC1c) and live crepidula (LC5c). In panel (a), d10, d50 and d90 are the percentiles 10, 50, and 90, respectively. In panel (b), bars and brackets represent averages and standard deviations, respectively, of 10 samples collected at the two OBS elevations for the five current velocity steps.
Deflocculated SPM size distributions, measured with the LISST from water samples, corroborate that no substantial changes were observed in suspended particle grain size throughout the different tests with or without crepidula (not shown). Particle size was bi-modal: a first mode around 2 µm, corresponding to the lowest detection limit of the LISST, and a second mode around 8–15 µm.
OM content estimated from water samples is here expressed in relative value (%) as normalized by the total SPM mass (). The relative OM content did not change significantly between the tests with no crepidula (14 ± 1%, NC1c) and with dead crepidula (15 ± 2%, DC1c). However, OM content increased substantially (by 1.7 times) at the end of the experiments with live crepidula (24 ± 3%, LC5c).
3.2. Temperature and oxygen content
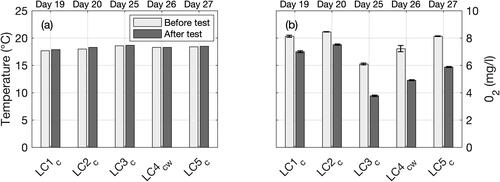
Crepidula are sensitive to environmental conditions, and especially to temperature and oxygen content. No measurements were carried out in the sediment bed, but water column measurements monitored how conditions evolved during experiments with live crepidula (). Water temperature was stable during the experiments at around 18 °C (). Contrastingly, oxygen content within the water changed significantly (between 3.8 and 8.5 mg/l) at the scale of both: (i) daily tests (i.e. before and after experiments) and (ii) 8-day series (i.e. LC1-5) (). The decrease in oxygen during the live crepidula tests (from −12% to −38% between the beginning and the end of the tests) are likely due to respiration activity while water oxygenation was paused not to disturb OBS and ADV measurements. O2 measurements at the bottom and the surface of the water column were very similar (see brackets in ), characterizing a well-mixed water column. In addition to the daily changes, O2 steadily decreased (more than −20%) between days 20 and 25 (tests LC2c and LC3c) and then increased back to its initial levels around 8 mg/l at the end of the experiments (day 27, LC5c). The reasons potentially explaining these changes are discussed in Section 4.3.3.
Figure 6. Measurements of (a) temperature and (b) oxygen content O2 before and after each test with live crepidula (LC1-5). In (b), bars and brackets represent averages and standard deviations, respectively, of bottom and surface measurements. Note that 5 days elapsed between tests LC2c and LC3c.
3.3. SPM dynamics
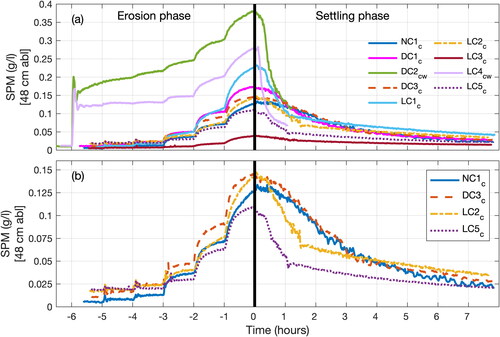
We compared SPM dynamics during the settling phase across the nine experimental tests (). The tests differed in: (i) initial SPM concentration SPM0, due to different levels of resuspension resulting from the erosion phases; (ii) bed substrate, i.e. without and with dead/live crepidula; and (iii) time during the four-week period, as experiments were carried out sequentially (). focuses on four tests with comparable initial SPM concentrations, but different bed substrates: NC1c (no crepidula), DC3c (dead crepidula), LC2c and LC5c (live crepidula). Settling dynamics can be described according to three different phases: the SPM concentration slowly decreased during the first phase (e.g. in DC3c, t ∼ 0–0.5 h, ); then, it decreased faster during the second phase (DC3c, t ∼ 0.5–3.5 h), before decreasing at a slower rate in the last phase (DC3c, t ∼ 3.5–7.5 h). Such a behaviour is driven by variable particle velocities during the settling phase. Interestingly, SPM dynamics of tests NC1c and DC3c, with no crepidula and dead crepidula, respectively, were very similar. As expected, the dead shell bed cover did not affect the sediment settling. In contrast, settling under the live crepidula tests (LC2c and LC5c) was significantly faster, especially in the second phase. These results point out that bed covers with live crepidula substantially enhances the SPM settling.
Figure 7. SPM concentration measurements from OBS2 at mid-water column for erosion and settling phases: (a) all the series, and (b) a focus on series with no crepidula (NC1c), dead crepidula (DC3c) and live crepidula (LC2c and LC5c) (see ).
The analysis of SPM dynamics qualitatively highlighted contrasted behaviours between the tests with dead or live crepidula beds. It is then intended to quantify the particle settling velocity associated with every test to estimate potential sedimentation rates above dead and live crepidula habitats.
3.4. SPM settling velocity
3.4.1. Estimation of particle settling velocity
To estimate settling velocity of suspended particles during the different tests, we propose a novel and simple approach based on SPM concentration measurements. The concept adopted for this method is similar as the settling column experiment proposed by Owen (Citation1976); however, instead of measuring the settling velocity distribution from the cumulated mass weighted at the bottom of the column, it is proposed to quantify the sediment amount from the measured SPM concentration (OBS). Nevertheless, this approach only works for sediment sizes where a homogenous SPM concentration is present through the water column when settling starts (e.g. fine sediments as mud), and can hardly be applied for quick settling sediment (e.g. sand).
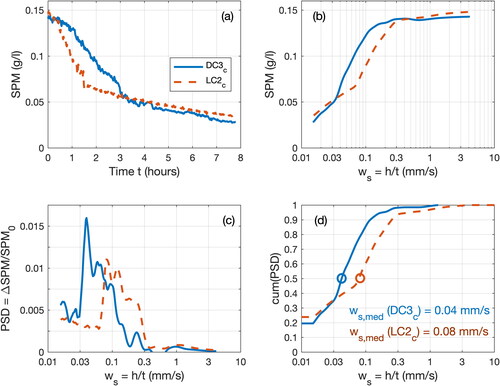
During a sedimentation test (e.g. DC3c and LC2c, ), the settling velocity of a given population can be expressed as the time (t) required for this population to settle down from the water surface to the OBS elevation (h) (). For example, if the SPM is composed of monodispersed particles, all particles settle down at the same settling velocity. SPM concentration remains constant until the last particles located initially at the surface pass through the OBS control volume, and hence SPM concentration drops down. For natural dispersed suspensions a decrease of SPM concentration ΔSPMi during a time step Δti can be associated with a quantity of particles that settled with a velocity class ws,i = h/ti. The mass Power Spectral Density (PSD) of the settling velocity distribution is then derived from the ΔSPMi distribution normalized by the initial concentration SPM0 (). As the final SPM concentration (SPMf) did not decrease to zero at the end of the experiments (e.g. in DC3c, SPMf = 0.03 g/l at tf = 7h45, ws,f = 0.015 mm/s, ), a low settling velocity class characterizing very fine particles is added to the measured distribution. Finally, the cumulative PSD distribution provides statistics on settling velocity, as the median settling velocity ws,med. For instance, the SPM settling velocity was twice as large for experiments with live crepidula (ws,med (LC2c) = 0.08 mm/s) than with dead crepidula (ws,med (DC3c) = 0.04 mm/s). Note that this method is not sensitive to the optical calibration coefficient, as we use the normalized SPM difference (ΔSPM/SPM0) to estimate the velocity.
Figure 8. Method to estimate a settling velocity distribution from SPM concentration measurements, illustrated with results of tests DC3c (solid blue line) and LC2c (dashed orange line) with OBS2 at mid-water column. (a) Time evolution of SPM concentration; (b) time evolution of SPM concentration, with time expressed as a settling velocity ws (see Section 3.4.1); (c) Power Spectral Density PSD of settling velocity, derived from the graph in panel (b); and (d) cumulative PSD of settling velocity, with the median value ws,med illustrated by the circles.
3.4.2. Changes in SPM settling velocity
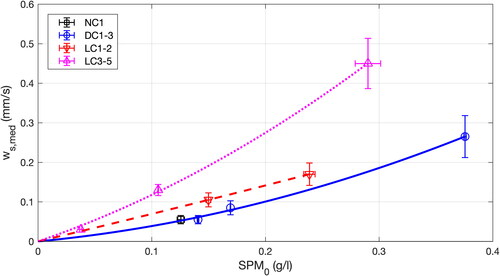
Across the nine experimental tests, we estimated median settling velocities using the method described above, as synthesized in . Mean velocities were averaged over the near-bed OBS1 and mid-water column OBS2 measurements. Note that series with live crepidula (LC) are split in two (i.e. LC1-2 and LC3-5) to illustrate temporal changes in settling processes (5-day long between LC2c and LC3c, see ). For each series, settling velocity increases with initial SPM concentration. This is typical of flocculation processes where higher concentrations in suspended particles increase their likelihood to collide and aggregate (e.g. Thorn and Parsons Citation1980). Nonetheless, settling velocities are significantly larger for the live crepidula (LC) tests relative to these with no crepidula (NC) or with dead crepidula (DC). This is particularly obvious for tests LC3-5. For instance, given an initial SPM concentration SPM0 = 0.2 g/l, median settling velocity is 0.1 mm/s for DC, 0.14 mm/s for LC1-2 and 0.28 mm/s for LC3-5.
Figure 9. Synthesis of median settling velocities ws,med versus initial SPM concentration SPM0 for series with no crepidula (NC), dead crepidula (DC) and live crepidula (LC). Symbols and brackets represent the averages and standard deviations, respectively, of settling velocities derived from OBS1 and OBS2. Lines represent polynomial regressions for series DC (solid blue), LC1-2 (dashed red) and LC3-5 (dotted magenta). Note that 5 days elapsed between tests LC2c and LC3c.
4. Discussion
The higher SPM settling velocity in the live crepidula tests () can result from two main processes: (i) crepidula biofiltration and (ii) greater flocculation due to the live crepidula bed cover.
4.1. Biofiltration
According to Barillé et al. (Citation2006), filtration by crepidula can reach up to 0.76 ± 0.05 l/h/gdry (i.e. 2.11 × 10⁻⁴ ± 0.14 × 10⁻⁴ m3/s/kgdry based on crepidula dry weight). Dry crepidula weight represents approximately 5% of total individual weight (flesh and shell). Assuming a crepidula density of 16 kg/m2 within the flume, and that all individuals were filtering, it leads to a biofiltration-induced settling velocity ws,filt = 0.17 ± 0.01 mm/s (i.e. 0.05 × 16×(2.11 × 10−4 ± 0.14 × 10⁻⁴)). Thus, this estimate of total filtration due to live crepidula individuals partially explains observed changes in particle settling velocity during the experiments (e.g. from series DC to LC1-2, ).
During series with live crepidula (LC), video recording of the bed revealed the development of black and white patches characteristic of sediment anoxia and microbial biofilm development, respectively, which could be lethal to crepidula individuals. In addition, at the end of the experiments (day 27, ), in spite of the maintenance of the oxygenation system, a significant part of the crepidula were recovered as broken chains, which is typical of physiologically weak or dead individuals. Therefore, it is unlikely that crepidula individuals increased their biofiltration activity between the beginning (tests LC1-2) and the end (tests LC3-5) of the live crepidula experiments. However, settling velocity is greater in LC3-5 than in LC1-2 (). As it could not be attributed to increased biofiltration activity, it suggests that increase in settling velocity for the last live crepidula tests (LC3-5) could be due to additional mechanisms, which we infer to be related to flocculation processes (see next section).
4.2. Flocculation
Cohesive sediment particles are known to flocculate, increasing their size and their settling velocity. Flocculation is affected by SPM concentration – as observed in for a given series – turbulence, salinity and OM content (Manning and Dyer Citation1999; Mietta et al. Citation2009; Verney et al. Citation2009; Lee et al. Citation2017). The turbulence and salinity conditions were similar for the different tests; however, the relative OM content was observed to be larger (by 1.7 times) at the end of the experiments for test LC5c (). This likely corresponds to enrichment due to detrital OM secreted by the crepidula during series LC and/or by the biofilm that developed at the surface of the sediment (e.g. microphytobenthos and microbial microfilms). Therefore, it is possible that flocculation processes were enhanced during live crepidula tests. Unfortunately, we did not directly measure the particle size during the experiments (e.g. with a LISST), because we wanted to avoid a potential flow disturbance by the large instrument. However, we used indirect methods to characterize particle features, as detailed below.
Following the sonar formulation, the backscatter index from the acoustic measurement is related to the SPM concentration through the relation: (e.g. Fugate and Friedrichs Citation2002). Such trends are observed in tests NC1c, DC1c and LC5c, based on SPM concentration measured from water samples and BI from ADV measurements at mid-water column (). However, for a given SPM concentration, the BI tends to increase from tests NC1c to LC5c. As the acoustic backscattered intensity is substantially influenced by particle features, an increase in BI may be associated with larger and/or denser particles (MacDonald et al. Citation2013; Thorne et al. Citation2014). Given we kept the same muddy sediment throughout the experimental period (d50 = 10 ± 1 µm, ), the increase in BI for an SPM concentration cannot be associated with denser particles (e.g. sand). In addition, Rouhnia et al. (Citation2014) clearly illustrated how changes in the size of mud flocs can affect BI. Therefore, flocculation was likely enhanced at the end of the experiments, which is known to increase the mud settling velocity by 0.01 mm/s to 1 mm/s (Manning and Dyer Citation1999). Moreover, optical measurements corroborate this hypothesis, as the calibration coefficient between the SPM concentration and OBS signal increased by 10% from tests DC1c to LC5c (). Contrarily to the acoustics, the optical signal is reduced when the particle size increases for a given SPM concentration, as it is more sensitive to the number of particle rather than the size (Ha et al. Citation2009). Hence, the increase in calibration coefficient is probably associated with the increase in particle sizes resulting from flocculation processes.
These results imply that biofiltration can enhance the particle settling velocity (e.g. up to 40% for SPM0 = 0.2 g/l, from DC to LC1-2; ); however, flocculation mechanisms associated with an increase in OM content may have a greater impact on particle settling (e.g. from series LC1-2 to LC3-5; ). Nonetheless, both processes contribute towards an increase in sedimentation rate above live crepidula bed covers.
4.3. Limitations and recommendations on mesocosm experiments
This experiment on sediment-fauna interactions was faced with serious technical, physical and biological challenges: (i) the presence of cohesive sediment (i.e. mud) induces consolidation and flocculation processes that further complicate the analysis of SPM dynamics; (ii) the changes in organic matter content associated with microphytobenthos and microbial biofilm development can affect the sediment erodibility (Orvain et al. Citation2004) and impact the SPM dynamics through the modulation of flocculation processes; (iii) maintaining a live population throughout an experiment is challenging as it requires good environmental conditions (e.g. water quality, oxygen, food supply); and (iv) the stress experienced by the biota in the experiments can affect their biological activity (Vettori et al. Citation2019). Based on the knowledge gained during this study, we make recommendations on the experimental protocols below.
4.3.1. Sediment bed conditions
To compare the influence of biological processes on sediment erosion, it is necessary to have similar sediment bed conditions. As a muddy bed consolidates with time, comparable tests would require to be carried out after a similar delay following initial sediment bed mixing or reworking. Running experiments in parallel instead of sequentially could unravel this problem, but it would require several mesocosm facilities, which is not feasible due to high costs and high space requirements. Nevertheless, sediment core samples could be collected to measure water content as a proxy for sediment bed consolidation. Moreover, measurement of OM content within the bed can provide insight into biofilm development that may change sediment erodibility.
4.3.2. SPM size distribution
Deflocculated SPM size distribution was measured from water samples, providing the primary particle size distribution. However, changes in SPM size distribution, which can help characterize flocculation processes, was not directly measured throughout the experiments. Deployment of a LISST into the flume could help directly evaluate SPM size, and thus, flocculation. Nonetheless, the substantial size of the instrument is likely to disturb the current flow.
4.3.3. Environmental conditions
Part of the crepidula population had died by the end of the experimental period, which can be due to different causes: anoxia near the bed, lack of food supply (nutrients, OM), excessive stress, etc. Water was oxygenated through eight air sources deployed into the flume between experimental tests. Nevertheless, water oxygen content presented substantial changes (between 3.8 and 8.5 mg/l) during tests with live Crepidula (). The sharp decrease in O2 between days 20 and 25 may be explained by OM degradation, which consumes oxygen. No experiments were carried out during these five days; therefore, the complete SPM settling and water clearing likely resulted in a thin layer (∼2–3 cm) of anoxic sediment, as OM degradation is more intense at the bed surface where crepidula, microphytobenthos and microbial microfilms take place. Anoxic sediment layers behave as an O2 sink pumping the water oxygen content. Resuming experiments from days 25 to 27 enabled the anoxic sediment layer to be resuspended and thus reoxygenated, especially with the energetic hydrodynamic conditions generated during LC4cw (current + waves). The sediment bed oxygenation would therefore limit the O2 pumping within the water column, leading to the increase of water oxygen content. Nonetheless, the decrease in O2 between days 20 and 25 may have resulted in the crepidula decay.
OM water content was theoretically providing enough food resources for crepidula to survive during the 8-day experiment. In spite of these precautions, experimental conditions were obviously unsuitable for crepidula. Providing suitable conditions for survival is a typical challenge of experiments involving live marine organisms. But this was even more of a challenge in our experimental set-up where we purposely generated current and wave conditions to increase resuspension of particles. To improve organism survival and to reduce fauna stress in future similar mesocosm experiments, it seems critical to plan for a longer (i.e. few days) acclimation period of the organisms in a well-controlled environment in terms of oxygen and food supply prior to performing potentially stressful mesocosm experiments. In addition, it would be interesting to conduct experiments where biological activity is continuously monitored, for instance in terms of behaviour, physiological activity as estimated via heartbeat (Burnett et al. Citation2013) and/or valvometry measurements.
Such problems (i.e. stressful conditions and dying crepidula) likely impacted crepidula biofiltration capacity during the experiments. As a consequence, our results might underestimate the SPM settling velocity associated with crepidula biofiltration, especially during the final tests (LC3-5). Nonetheless, this work reveals that combined biotic and abiotic processes enhance SPM settling with live crepidula, leading to habitat siltation. Analysis of SPM dynamics within coastal ecosystems was usually investigated with discipline-specific approaches focused either on fauna behaviours (e.g. Barillé et al. Citation2006) or on physical processes (e.g. Moulin et al. Citation2007). Thus, this study is original in capturing both biotic and abiotic processes. Hence, although crepidula health status was potentially affected by the mesocosm conditions, assessing the relative contribution of biofiltration and flocculation to SPM settling in coastal ecosystems represents a substantial step forward.
5. Conclusions
Here we studied the influence of live crepidula shell on SPM dynamics through a mesocosm experimental study considering current and wave forcing over a cohesive sediment bed. We compared alternative tests with no crepidula, dead crepidula and live crepidula bed covers to investigate the influence of physical and biological processes on sediment settling.
We also propose a simple method to estimate particle settling velocity based on turbidity measurements (e.g. from optical backscatter sensors). Median SPM settling velocities were similar in the no crepidula and dead crepidula bed tests. However, velocities were noticeably faster in the live crepidula tests. This increase in settling velocity (by up to 40%) can be explained by the increased biodeposition due to biofiltration. However, combination of optical and acoustic measurements suggests an intensification of flocculation in the live crepidula tests, probably due to organic matter enrichment. Such enhanced flocculation is likely to significantly impact particle settling. Both mechanisms tend to increase sedimentation rate above live crepidula bed covers, which corroborates field observations that typically associate crepidula habitats with muddy sediment.
These mesocosm experiments provide some insights on sediment-fauna interactions and especially on their role in terms of particle settling behaviour. Based on the several technical, physical and biological issues that we faced, we also provide a list of recommendations for future experimental research at the interface between physical and biological processes affecting cohesive sediment dynamics.
Acknowledgements
The CEDRE is warmly thanked for providing access and technical support to the Polludrome facility. We particularly thank Matthias Jacquet, Jean-Dominique Gaffet, Thibault Androuin, Erwan Le Gall and Xavier Caisey for their technical support.
Disclosure statement
No potential conflict of interest was reported by the authors.
Additional information
Funding
Related Research Data
References
- Androuin T, Polerecky L, Decottignies P, Dubois SF, Dupuy C, Hubas C, Jesus B, Le Gall E, Marzloff MP, Carlier A, et al. 2018. Subtidal microphytobenthos: a secret garden stimulated by the engineer species Crepidula fornicata. Front Mar Sci. 5:475.
- Barillé L, Cognie B, Beninger P, Decottignies P, Rincé Y. 2006. Feeding responses of the gastropod Crepidula fornicata to changes in seston concentration. Mar Ecol Prog Ser. 322:169–178.
- Beudin A, Chapalain G, Guillou N. 2013. Suspended sediment modelling in the Bay of Brest impacted by the slipper limpet Crepidula fornicata. Paper presented at the Coastal Dynamics 2013 - International Conference on Coastal Dynamics; June 24–28; Bordeaux.
- Blanchard M. 1995. Origine et état de la population de crépidules (Crepidula fornicata) sur le Littoral français. Haliotis. 24:75–86.
- Blanchard M. 1997. Spread of the slipper limpet (Crepidula fornicata) in Europe. Current state and consequences. Scientia Marina. 61(2):109–118.
- Burnett NP, Seabra R, de Pirro M, Wethey DS, Woodin SA, Helmuth B, Zippay ML, Sarà G, Monaco C, Lima FP. 2013. An improved noninvasive method for measuring heartbeat of intertidal animals. Limnol Oceanogr Methods. 11(2):91–100.
- Ehrhold A, Blanchard M, Auffret J-P, Garlan T. 1998. Conséquences de la prolifération de la crépidule (Crepidula fornicata) sur l’évolution sédimentaire de la baie du Mont-Saint-Michel (Manche, France). C R Acad Sci Ser IIA-Earth Planetary Sci. 327(9):583–588.
- Fugate DC, Friedrichs CT. 2002. Determining concentration and fall velocity of estuarine particle populations using ADV, OBS and LISST. Cont Shelf Res. 22(11–13):1867–1886.
- Ganthy F, Sottolichio A, Verney R. 2013. Seasonal modification of tidal flat sediment dynamics by seagrass meadows of Zostera noltii (Bassin d’Arcachon, France). J Mar Syst. 109:S233–S240.
- Gibbs RJ. 1985. Estuarine flocs: their size, settling velocity and density. J Geophys Res. 90(C2):3249–3251.
- Gibson R, England G, Hussey M. 1967. The theory of one-dimensional consolidation of saturated clays: 1. Finite non-linear consildation of thin homogeneous layers. Geotechnique. 17(3):261–273.
- Graf G, Rosenberg R. 1997. Bioresuspension and biodeposition: a review. J Mar Syst. 11(3–4):269–278.
- Grasso F, Jacquet M, Cugier P, Carlier A, Gaffet J-D, Androuin T. 2018. Experimental study of sediment-biota interactions under wave-current conditions: application to the ecosystem engineer species Crepidula fornicata. SEANOE dataset. https://doi.org/10.17882/54774.
- Grasso F, Le Hir P, Bassoullet P. 2015. Numerical modelling of mixed-sediment consolidation. Ocean Dyn. 65(4):607–616.
- Ha H, Hsu W-Y, Maa J-Y, Shao Y, Holland C. 2009. Using ADV backscatter strength for measuring suspended cohesive sediment concentration. Cont Shelf Res. 29(10):1310–1316.
- Kombiadou K, Ganthy F, Verney R, Plus M, Sottolichio A. 2014. Modelling the effects of Zostera noltei meadows on sediment dynamics: application to the Arcachon lagoon. Ocean Dyn. 64(10):1499–1516.
- Kostecki C, Rochette S, Girardin R, Blanchard M, Desroy N, Le Pape O. 2011. Reduction of flatfish habitat as a consequence of the proliferation of an invasive mollusc. Estuarine Coast Shelf Sci. 92(1):154–160.
- Le Hir P, Monbet Y, Orvain F. 2007. Sediment erodability in sediment transport modelling: can we account for biota effects? Cont Shelf Res. 27(8):1116–1142.
- Lee B, Hur J, Toorman E. 2017. Seasonal variation in flocculation potential of river water: roles of the organic matter pool. Water. 9(5):335.
- MacDonald IT, Vincent CE, Thorne PD, Moate BD. 2013. Acoustic scattering from a suspension of flocculated sediments. J Geophys Res Oceans. 118(5):2581–2594.
- Manning A, Dyer K. 1999. A laboratory examination of floc characteristics with regard to turbulent shearing. Mar Geol. 160(1–2):147–170.
- Merckelbach L, Kranenburg C. 2004. Equations for effective stress and permeability of soft mud–sand mixtures. Geotechnique. 54(4):235–243.
- Mietta F, Chassagne C, Manning AJ, Winterwerp JC. 2009. Influence of shear rate, organic matter content, pH and salinity on mud flocculation. Ocean Dyn. 59(5):751–763.
- Moulin FY, Guizien K, Thouzeau G, Chapalain G, Mülleners K, Bourg C. 2007. Impact of an invasive species, Crepidula fornicata, on the hydrodynamics and transport properties of the benthic boundary layer. Aquat Living Resour. 20(1):15–31.
- Murray JM, Meadows A, Meadows PS. 2002. Biogeomorphological implications of microscale interactions between sediment geotechnics and marine benthos: a review. Geomorphology. 47(1):15–30.
- Orvain F, Sauriau P-G. 2002. Environmental and behavioural factors affecting activity in the intertidal gastropod Hydrobia ulvae. J Exp Mar Biol Ecol. 272(2):191–216.
- Orvain F, Sauriau P-G, Sygut A, Joassard L, Le Hir P. 2004. Interacting effects of Hydrobia ulvae bioturbation and microphytobenthos on the erodibility of mudflat sediments. Mar Ecol Prog Ser. 278:205–223.
- Owen MW. 1976. Determination of the settling velocities of cohesive muds. Report from HR Wallingford, No IT 161.
- Reise K. 2002. Sediment mediated species interactions in coastal waters. J Sea Res. 48(2):127–141.
- Rice SP, Johnson MF, Mathers K, Reeds J, Extence C. 2016. The importance of biotic entrainment for base flow fluvial sediment transport. J Geophys Res Earth Surf. 121(5):890–906.
- Rouhnia M, Keyvani A, Strom K. 2014. Do changes in the size of mud flocs affect the acoustic backscatter values recorded by a vector ADV? Cont Shelf Res. 84:84–92.
- Thorn M, Parsons J. 1980. Erosion of cohesive sediments in estuaries: an engineering guide. Paper presented at the Proceedings of the International Symposium on Dredging Technol. March 5–7, 1980, Bordeaux, France.
- Thorne PD, MacDonald IT, Vincent CE. 2014. Modelling acoustic scattering by suspended flocculating sediments. Cont Shelf Res. 88:81–91.
- Tolhurst T, Gust G, Paterson D. 2002. The influence of an extracellular polymeric substance (EPS) on cohesive sediment stability. In Proceedings in Marine Science, from Fine Sediment Dynamics in the Marine Environment. Vol. 5. Elsevier. p. 409–425
- Toorman E, Berlamont J. 1993. Settling and consolidation of mixtures of cohesive and non-cohesive sediments. Adv Hydro-Sci Eng. 1:606–612.
- van Leussen W. 1994. Estuarine macroflocs and their role in fine-grained sediment transport [PhD thesis]. Utrecht: University of Utrecht, 488.
- Verney R, Lafite R, Brun-Cottan J-C. 2009. Flocculation potential of estuarine particles: the importance of environmental factors and of the spatial and seasonal variability of suspended particulate matter. Estuaries Coasts. 32(4):678–693.
- Vettori D, Rice S, Aberle J, Bodewes B, Dijkstra JT, Fernandez R, Henry PY, McLelland S, Middelboe AL, Thom M. 2019. Innovative approaches for measuring organism stress and behavioural integrity in flume facilities: Deliverable D8-IV. HYDRALAB+. Loughborough University.
- Widdows J, Lucas JS, Brinsley MD, Salkeld PN, Staff FJ. 2002. Investigation of the effects of current velocity on mussel feeding and mussel bed stability using an annular flume. Helgol Mar Res. 56(1):3–12.
- Winterwerp J, Manning A, Martens C, De Mulder T, Vanlede J. 2006. A heuristic formula for turbulence-induced flocculation of cohesive sediment. Estuarine Coast Shelf Sci. 68(1–2):195–207.