
 ?Mathematical formulae have been encoded as MathML and are displayed in this HTML version using MathJax in order to improve their display. Uncheck the box to turn MathJax off. This feature requires Javascript. Click on a formula to zoom.
Abstract
This article analyses several promising policies in the electronic parts industry for disrupting the flow of counterfeit electronic parts. A socio-technical electronic part supply-chain network model has been developed to facilitate policy analysis. The model is used to understand the technical and social dynamics associated with the insertion of counterfeit electronic components into critical systems (e.g., aerospace, transportation, defense, and infrastructure) and to analyze the impact of various anti-counterfeiting policies and practices. This network model is used to assess the effectiveness of mandatory original component manufacturer buyback programs and the debarment of distributors found to provide counterfeit components. In this agent-based model, each participant in the supply chain is modeled as an independent entity governed by its own motivations and constraints. The entities in the model include the original component manufacturers, distributors, system integrators, operators, and counterfeiters. Each of these entities has dynamic behaviors and connections to the other agents. Since time is an integral factor (lead times and inventory levels can be drivers behind the appearance of counterfeits), the simulation is dynamic. The model allows the prediction of the risk of counterfeits making it into an operator’s system and the length of time between relevant supply-chain events/disruptions and the appearance of counterfeits.
1. Introduction
Supply-chain disruptions and compromise risks are significant problems for all types of products and systems. However, critical systems, including medical, aerospace, transportation, energy generation, other infrastructure (including food and water delivery, sanitation, energy grid), and defense, are particularly vulnerable (Schipp, Citation2018). These systems are expensive to procure, must be supported for long periods of time, and the consequences, if compromised by counterfeit electronic parts, can be catastrophic, often directly or indirectly resulting in a risk to human life or national security and causing significant economic peril. In this article, a part (also called a component or piece part) is assumed to be an electronic part (e.g., an integrated circuit), a discrete electronic part (e.g., a transistor), or a passive electronic part (e.g., a resistor).
Because critical systems are not the supply-chain drivers for many of the parts they use, they suffer from supply-chain aging, i.e., the supply chains on which they depend grow old or evolve away from them. Generally, supply chains cater to the needs of the highest volume (and profit margin) market, often leaving lower-volume critical systems markets behind. If the lower-volume markets cannot adapt to the supply-chain’s direction, they will encounter obsolescence problems (also known as diminishing manufacturing sources and materials shortages in the critical systems community), i.e., an inability to source the items that they need from the item’s original manufacturer (Sandborn, Citation2008). Specifically, for electronic parts, the supply chain is driven by applications that have short periods of production and support (e.g., cell phones); therefore, the parts evolve quickly, i.e., the period of time over which the part can be sourced from its original manufacturer (the “procurement life”) of many electronic parts is measured in months. Critical systems can also face “obsolescence” when they cannot accept process, material, or supply-chain changes imposed on a part. The inability of systems to adapt to supply-chain changes creates an opportunity for illicit entities to introduce counterfeit parts into the supply chain.
A counterfeit electronic part is a part that is misrepresented to a buyer as original and unused (a more detailed definition is provided in Section 2). In the electronic parts marketplace, it is often assumed that if a component is purchased from an authorized source, it will be an original part (Livingston, Citation2010). Most counterfeit electronic parts find their way to customers through unauthorized sources, e.g., brokers and independent distributors (U.S. Department of Commerce, Citation2010).
Ideally, critical system providers would only source the parts they require through authorized channels that are largely safeguarded from the risk of counterfeit parts (U.S. Senate Armed Services Committee, Citation2011). Rigorous controls over the source and condition of the parts, mainly through contractual tools, prevent counterfeit parts from easily infiltrating authorized channels. However, once parts are discontinued by their original manufacturers (i.e., become obsolete), the supply of parts from authorized channels dries up. As a result, critical system providers eventually must seek parts from non-authorized channels, thereby increasing the risk of getting counterfeit parts. Because critical system developers obtain parts from non-authorized sources, technologies and processes to detect counterfeits have become commonplace. However, detecting counterfeit components is a challenge, because of the test time, cost, and lack of metrics to evaluate the test confidence due to the rapidly changing threat environment (Guin et al., Citation2014).
In this article, we analyze the impact of several policies in the electronics industry that may impact the illicit supply chain of counterfeit electronics. When applied to complex systems, such as supply chains, policies may fail to achieve the results envisioned and, worse, cause unintended consequences. Thus, there is a need to evaluate the impacts of policies and modify and tune them, if necessary, before their widespread application. In this article, we introduce a socio-technical network modeling approach for understanding and evaluating policies that may affect the counterfeit electronic part supply chain. Using this approach, we explore the dynamics and trends in the supply chain, especially the social, technical, and adaptive behavior of all the involved parties as they apply to counterfeit parts. The structure of the marketplace defined in this article is specific to the electronic piece parts, and the proposed model may not adequately represent the supply chain for other items, including those for other electronic items such as circuit cards.
This article is organized as follows: Section 2 discusses the previous work relevant to modeling counterfeit supply chains, and Section 3 introduces the network model developed for this analysis. In Section 4, the results from two policy studies using the model are reported. The implication of the widescale application of these two policies and suggestions for their implementation are described in Section 5. We present the conclusions along with continued work in Section 6.
2. Background and previous work
Although many types of components and subsystems (both hardware and software) in critical systems are potentially at risk of being counterfeited, we are focusing on electronic parts in this article. SAE AS5553 (SAE, Citation2022) defines counterfeit electrical, electronic, and electromechanical parts as:
“An unauthorized (a) copy, (b) imitation, (c) substitute, or (d) modified Electronic and Electrical Equipment (EEE) part, which is knowingly, recklessly, or negligently misrepresented as a specified genuine item from an original component manufacturer or authorized aftermarket manufacturer; or a previously used EEE part which has been modified and is knowingly, recklessly, or negligently misrepresented as new without disclosure to the customer that it has been previously used.”
Despite a substantial body of work that is focused on developing counterfeit electronic part detection methodologies (e.g., Fernandez et al., Citation2008; Santhanam et al., Citation2013; Kanovsky et al., Citation2015; Asadizanjani et al., Citation2017), and authentication-enabling technologies through tracking and traceability (Cui et al., Citation2019; Islam and Kundu, Citation2019), relatively little attention has been paid to modeling the networks responsible for creating and distributing counterfeit electronic parts.
Illicit supply networks, similar to lawful supply networks, are complex socioeconomical systems and, therefore, share common economic, social, and technical dynamics. There have been several modeling attempts to represent specific economic, social, and technical dynamics specific to industries such as pharmaceutical and luxury goods (Anzoom et al., Citation2021). Illicit supply networks contain some agents that behave in an illegal manner, but the networks maintain the basic principles of supply chains, such as economic dynamics. Such dynamics have been extensively modeled with various attributes associated with supply chains, such as reputation (e.g., Busby, Citation2019), bidding dynamics (e.g., Yin et al., Citation2004), and order selection (e.g., Zhao and Qiu, Citation2014), and the network models reported in the literature. In addition, the social and cognitive dynamics present in an illicit network have also been modeled, such as the motivation of individual supply-chain participants (e.g., Axtell, Citation2000) and collective decision making (e.g., Chen et al., Citation2020) apply to illicit supply networks. Various technical aspects of supply networks, such as product diffusion (e.g., Rahmandad and Sterman, Citation2008) and the adoption of new technologies (Chen et al., Citation2020), have also been reproduced in network models.
The aforementioned economic, social, and technical supply network models have been utilized to model specific illicit networks. Counterfeit pharmaceuticals (e.g., Bhushan et al., Citation2013; Choi et al., Citation2015), drug trafficking (e.g., Bright et al., Citation2019; Magliocca et al., Citation2019), and others have studied illicit supply networks. Although network modeling of the electronic parts supply chain is relatively common (e.g., Berry et al., Citation1994), models focused on the network modeling of counterfeit electronic parts in the supply chain are scarce. The only known network modeling attempts that address counterfeit electronic parts are from Rouse and Bodner (Citation2013), who created a prototype socio-technical network for the flow of counterfeit parts for U.S. Department of Defense applications. Subsequently, Bodner implemented a simplified version of the network (Bodner, Citation2014, Citation2015). The implemented network was constructed as an agent-based model to analyze the complex implication of implementing large-scale policies. Pennock et al. (Citation2016) extended Bodner’s model and analyzed multiple part procurement scenarios using simplified networks lacking many critical supply-chain parameters and activities such as lead time, price, negotiation, and post-obsolescence procurement. The work of Bodner and his co-workers is exclusively focused on the U.S. Department of Defense (DoD) procurement process. The questions addressed in Bodner and Pennock’s work are: (i) what are the efficacy and costs associated with the Responsible Electronics Recycling Act (RERA), (ii) U.S. Department of Justice (DoJ) IP infringement and fraud enforcement, (iii) DoD acquisition policies, and (iv) U.S. Customs and Border Protection inspection regarding specific DoD programs.
3. Network modeling
The electronics supply chain is a complex socio-technical system by nature. It is composed of specialized stakeholders, often with objectives that may not align with each other. Moreover, as a complex system, supply-chain networks are vulnerable to disruptions, and failure at any point in the supply chain has the potential to cause the entire network to fail (Rice and Caniato, Citation2003), due to interdependencies in the supply chain. Understanding the micro and macro behavior of this type of complex network is necessary to identify the opportunities for failure in a supply chain in order to detect and prevent counterfeit part proliferation. Different modeling methodologies have been used to understand the electronics supply chain and predict the availability and distribution of components to improve business planning.
In this analysis, we use Agent-Based Modeling (ABM), which provides a flexible platform ideal for quantifying the effectiveness of various proposed policies. ABM has been shown to be an effective tool for policy analysis (Blume, Citation2015). Implementing anti-counterfeiting policies can be costly (U.S. Government Accountability Office, Citation2016), and the policies can have unintended consequences. Thus, policies should be carefully analyzed for efficacy in achieving the desired goal and identifying potential unintended consequences. The flexibility of ABM allows the exploration of emergent patterns and behaviors, allowing users to forecast policy outcomes. Unlike other modeling methodologies, ABM does not require known system dynamics, discrete supply-chain events, or a complete representation of agents’ behavior and decision-making through mathematical models as required in game-theory models. The strength of ABM lies in not being fully constrained, resulting in fixed output. The characteristics of ABM can produce non-intuitive outputs reflective of real business scenarios. Without analytical supply-chain models, attempts to disrupt counterfeit part networks may be haphazard and inadequately targeted. Network modeling can be an effective tool in identifying policy consequences.
3.1. The electronic parts supply chain
The electronic part supply chain is a complex socio-technical network that requires the identification of nodes (participating entities) and edges (the nature of participant’s connections). Based on subject matter expert inputs (University of Maryland, Citation2021) as well as government reports (U.S. Department of Commerce, Citation2010; U.S. Senate Armed Services Committee, Citation2011) highlighting malicious supply-chain actors and the paths they use to insert counterfeits, a general supply-chain network was created (). The policy environment for each entity and the nature of the exchanged commodity, payment, information, and parts were also identified (University of Maryland, Citation2021).
Figure 1. A general supply-chain network model for electronic parts. The symbol ⊕ represents an “or” operator. The direction of the arrows represents the flow of payments, information, or parts. The blue dashed lines define policy environments where specific policies are in effect. Red dashed boxes denote parts exiting the supply chain and not expected to reenter, and rectangles represent agent populations.
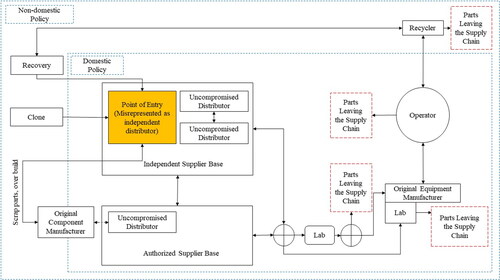
shows that entities such as the Original Component Manufacturer (OCM) produce parts that flow through part distributors. The original equipment manufacturer procures parts from the distributors for use in equipment to be delivered to the operator. Meanwhile, illicit processes such as recycled part recovery, cloning, and inserting defective OCM parts can enable illicit parts to enter the supply chain through distributors. This list of counterfeit part sources is not exhaustive, and includes only examples.
To simplify the network, the entities responsible for manufacturing, procuring counterfeit parts, and knowingly selling them as authentic parts are aggregated into one entity called Point-of-Entry (POE); these entities pose as independent distributors. POEs represent the primary conduit for counterfeit parts to enter any supply chain, including the electronic parts supply chain. For this modeling effort, direct Operator-OCM, Operator-Distributor Base, and Original Equipment Manufacturer-OCM connections have been omitted to better represent the dynamics faced by critical-system manufacturers and sustainers. Unlike consumer electronics products, the critical-systems electronics supply chain is constrained to the connections shown in .
The electronics supply chain is similar to other supply chains in which buyers consider trade-offs between price and lead time, and the counterfeit electronics supply chain resembles these supply chains with the introduction and circulation of counterfeit parts. Although there are overlaps between the counterfeit electronics supply chain and other counterfeit supply chains (e.g., luxury goods), in the electronics supply chain, buyers have access to multiple authentication mechanisms with varying probabilities of correct counterfeit detection and cost (described in Section 3.2). Buyers must often balance the cost of authentication with their other profit maximization parameters that include risk. Similarly, the motivation for testing authenticity differs in the electronics supply chain compared with other supply chains. Most electronics buyers and sellers associated with parts for critical systems perform some level of testing, due to the safety critical nature of their systems rather than a simple cost–benefit analysis that might be performed for consumer or luxury items (e.g., authentication only performed for high-priced items, not all items). As seen in (and subsequently ), all buyers in the supply chain perform testing on incoming part shipments as the last stage of interaction with sellers. Finally, unlike counterfeit consumer or luxury products, no participant in the critical-systems supply chain knowingly purchases a counterfeit part, i.e., there is no demand for counterfeit parts (unlike consumer and luxury goods); this forces the POE agents to represent their counterfeit parts as authentic. Participants in critical system supply chains are only forced to procure from unauthorized sources when part availability dictates. However, procurement from unauthorized sources in other counterfeit supply chains, such as luxury goods, is not motivated by just original part availability.
Far and away, the most effective approach to avoiding counterfeit electronic components is to always purchase electronic parts directly from the OCM or a distributor, reseller, or aftermarket supplier authorized by the OCM. However, following this policy becomes increasingly difficult the further in time from the part’s discontinuance (obsolescence) one goes, i.e., this is a practical policy to adopt only while the parts can still be obtained from authorized sources. However, the authorized sources are often depleted long (decades) before the part is retired from service in critical systems (which may still be actively manufactured or need spare parts for support). Even for non-obsolete parts, authorized sources can impose restrictions on buyers, such as a minimum order quantity or an end-user certificate disclosing how the parts will be used, forcing buyers to procure parts through unauthorized channels. Supply-chain disruptions can also limit the inventory of authorized distributors even before its obsolescence, forcing buyers to look elsewhere for parts.
3.2. Agent-based counterfeit network modeling
The supply chain shown in was simplified to create a practical network model by removing the physical location of parts and entities from the modeling process. There are no inherent parameters or actions based on the geographical location of an entity or any logistical entity responsible for the physical transportation of parts. Independent part testing labs are modeled as a testing function within distributors and original equipment manufacturers.
After identifying and simplifying the electronics supply chain, active and passive agents were identified based on the defined entities. Each active agent is an independent autonomous participant in the supply chain interacting with other agents within the network environment to achieve a specific goal, while passive agents follow a simple predefined behavior (Macal and North, Citation2010). In the model, one passive agent (the operator) and five types of active agents are defined: customer, POE, OCM, independent distributor, and authorized distributor. Each agent type is initialized as a population of agents called the “agent base,” described by static and stochastic parameter values. Each active agent base dynamically interacts with external bases or the agent within its internal base to achieve its agent-type objective. The operator (a passive agent) represents a single supply-chain entity that introduces a stochastic demand into the network to which all the other agent bases react. The operator agent is modeled as a passive agent without the ability to make autonomous decisions based on a predefined objective for the functions modeled in this network. We developed a network with agents maximizing their profit while the network is perturbed by introducing various policies. This system of interacting agent bases is shown in .
Figure 2. The system of interacting agents and their allowable actions. The arrows represent the direction of the flow of parts, circles are individual supply-chain actors, and rectangles represent the type of supply-chain actors, and circles represent individual agents.
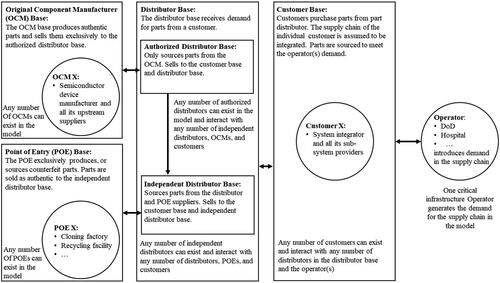
The customer base receives the demand generated by the operator. The customer base responds to the demand by competing for a potential purchase order by choosing the cost and lead times for the demand and submitting a bid. If the customer needs to procure parts, it communicates its demand to the distributor base. Similarly, the distributors compete for a possible selling opportunity by adjusting their cost and lead time. In turn, if the distributors require additional inventory, they send their demand to either OCMs or POEs. In the electronics part supply chain, only the authorized distributors can purchase parts from the OCM. Independent distributors can procure parts from authorized distributors, other independent distributors, or POEs representing themselves as independent distributors while only providing counterfeit parts. In this simplified model, OCMs and POEs can manufacture parts without dependence on respective suppliers.
We assume that every active agent makes decisions based on maximizing their “profit.” The profit function parameters are dynamic and influenced by internal and external events. Zhang and Zhang (Citation2015) make a similar assumption in supply chains with deceptive counterfeits for modeling commercial counterfeit products (as opposed to modeling critical systems). Unlike Zhang and Zhang (Citation2015), “profit” in the context of our model could be short-term (single transaction) profit for some agents and long-term (decades or longer) profit for others, denoted by (profit horizon). For example, an internet part broker acting as an independent distributor may only be interested in closing the current part sale for as much money as it can get now. Alternatively, a system integrator’s (i.e., customer’s) objective is to maximize profit over the system’s entire life cycle and potentially a longer business cycle, e.g., taking actions that maximize their probability of retaining their current contract(s) with an operator and winning future contracts. Such a modeling approach allows us to capture the realistic behavior of electronics supply chain participants, which differs based on their operational timeframe. Such an approach can also be applied to other supply chains where the agents’ decisions are based on their time horizon.
Profit maximization is represented by maximizing the internal rate of return (IRR). The objective of each agent base is to maximize their at time step
over their profit horizon (
) by maximizing total revenue (
) and minimizing total cost (
) of carrying
of parts with unique stock keeping unit (SKU) numbers at time step
while being bounded by certain regulations, external market dynamics, and business practices. The degree to which an agent avoids purchasing and selling counterfeit parts is captured through the agent’s
maximization goal. Selling counterfeit parts may lead to financial penalties and tangible business consequences, such as loss of future sell opportunities or intangible consequences such as loss of reputation that leads to loss of future business transactions. These consequences translate into revenues and costs incorporated into an agent’s
maximization objective. The current model does not address other intangible and abstract objectives such as mission success, the risk of criminal prosecution, or business ethics.Footnote1
is defined as:
(1)
(1)
is the profit horizon in time steps.
determines the
time duration for the agents at time step
The total revenue and total cost for part SKU = i are functions of the sell quantity measured in parts at time step
(
), sell price per part at time step t (
), buy quantity measured in parts at time step
(
), buy cost per part at time step t (
), inventory level at time step
(
), a constant holding cost per part (
), a constant order execution cost (
), and unitless
representing the accuracy of testing that the agents perform on incoming component shipments.
is the part-specific cost of obtaining a 100% accurate test result (measured in units of the part’s buy cost,
During policy analysis, x(i) is assumed to be 1, Ts describes the duration of the time-step and other parameters stay constant during the time-step. The revenue and cost functions are given in Equationequations (2a)
(2a)
(2a) and Equation(2b)
(2b)
(2b) :
(2a)
(2a)
(2b)
(2b)
The parameters that define and
(except for
and
) dynamically change based on internal decisions and external factors. Particularly,
at time step
is linearly correlated with
and can be indirectly correlated with
through interacting agent behaviors. Agents can choose to perform less expensive and less accurate (or no testing where
) testing on purchased incoming parts, thus reducing
Agents can also autonomously choose to increase
which can result in additional business (through an improved reputation for avoiding counterfeit parts), thus increasing
All the agent inventories are governed by static parameters expressing the maximum inventory level () and minimum inventory level (
). When the expected inventory (
) level at time step
for part SKU = i, i.e., the current inventory plus the scheduled incoming (
) minus the outgoing (
), falls below (
), a purchasing or manufacturing mechanism is automatically initiated to achieve an inventory level of (
) governed by Equationequations (3a)
(3a)
(3a) and Equation(3b)
(3b)
(3b) Footnote2:
(3a)
(3a)
(3b)
(3b)
The POE. and OCM, respectively, have the capability of producing counterfeit and authentic parts governed by the constant manufacturing lead time in time steps (LTM), which is unique to each manufacturing-capable agent (i.e., POE. and OCM). Independent distributors and customers can negotiate and purchase parts from the agent bases they are in contact with, as seen in . Each purchase-capable agent (i.e., customer and independent distributor) has two sets of distributors are subsets of the Authorized Distributor (AD) base and Independent Distributor (ID) base, respectively. These subsets function as the approved distributor list for business purposes. The
sets are dynamically and autonomously updated by the purchase-capable agents. Purchase-capable agents can only contact, negotiate, and purchase from agents in the
sets. The model is initiated assuming a purchase-capable agent’s
sets contain every agent in the connected agent bases. Agents can independently suspend agents from these sets for a DT period, representing debarment duration. DT can range from zero to very large (effectively representing permanent removal from the
sets).
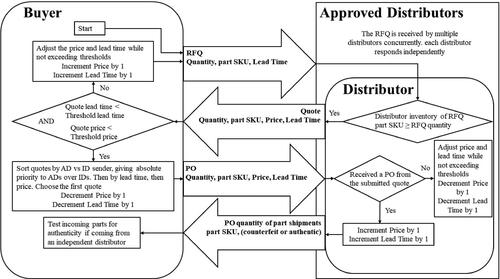
Figure 3. The interaction of the purchasing and selling mechanisms. RFQ = request for quote, PO = purchase order. The threshold parameters are not visible to other agents. The counterfeit or authentic nature of parts within the shipment is not visible to the buyer. Through testing, the true nature of parts can be determined with a probability of
If in Equationequation (3b)
(3b)
(3b) for a purchasing agent, the agent (Buyer) initiates the purchasing mechanism shown in for a part SKU = i at time step
The purchasing agent sends a Request For a Quote (RFQ) to the
sets (approved distributors list). The model is initialized with every distributor assumed to be approved and on the list. In the transient phase of the model, some distributors are removed from the approved distributor list if they are identified to have sold counterfeit parts. As the model approaches the steady state, a specific group of distributors remains on the approved list of each customer. However, some of the distributors removed from an approved list might rejoin their respective approved lists under some policy scenarios discussed in Section 4.2. In response to the RFQ, distributors send the purchasing agent a quote. During the cycle of RFQ and quote exchange (i.e., negotiation), both the purchasing and the selling agents adjust their
and
dynamically by increments of one to maximize their
objective.
and
representing the buyer lead time and seller lead time in time steps, are also adjusted dynamically in increments of one until the condition
is reached. The dynamic price and lead time adjustment among the agents defines the current market value of electronic parts, which is critical for agents in their decision-making process seen in Equationequation (1)
(1)
(1) . In some cases, a large increase in the procurement cost of obsolete parts emerges as a result of the continuous increase of
by selling agents due to part scarcity. Part price increase (post-part discontinuance) is one of the drivers of an increased prevalence of counterfeit parts in the model. During negotiation, each sell-capable agent is bound by a constant threshold selling price PS-Min and constant threshold selling lead time LTS-Min. Conversely, purchase-capable agents are bound by constant thresholds buying cost CB-Max and lead time LTB-Max in time step. These thresholds represent the inherent characteristics of agents concerning their business and operational scope. For example, some agents inherently require short lead times based on the contracts executed compared to others, which can tolerate longer lead times. Once the lead time condition and
condition is satisfied, the purchasing agent then chooses one selling agent (e.g., AD, ID, or POE) to send a Purchase Order (PO). Customers in the critical systems supply chain procure a small enough number of parts so that a single-sourcing assumption is adequate. Moreover, customers in the critical systems assign absolute priority to authorized distributors over non-authorized distributors (i.e., POEs and IDs). These customers follow the common business practices stated in the SAE AS5553 standard (SAE, Citation2022), which states parts should be procured from ADs, and robust evaluation and risk mitigation steps need to be taken when purchases are made from independent distributors. These steps include audits and testing. Lastly, the distributor ships the part in
time steps, and the shipment is instantaneously received by the buyer. The buyer then performs testing on the shipment with a true positive (counterfeit) detection probability of
After a successful transaction, the buyer decrements the price and lead time
with the objective of increasing its
in the next purchasing cycle. In contrast, the distributor incerments the price
and lead time
with the same objective of
maximization, as shown in .
4. Policy impact evaluation
Network models are valuable tools for evaluating policies that are otherwise expensive or impossible to assess or would take a very long time to test for effectiveness in practice. Two studies were chosen for analysis using the model, demonstrating the ability of the model to capture real-life scenarios in the electronic parts supply chain, produce data for policymakers, and validate the model structure. The two cases are representative of legal and contractual actions that are considered and, in some cases, implemented by the agents that may impact the prevalence of counterfeit parts. Due to a lack of public knowledge of static parameters, such as agent base populations and POE’s counterfeit manufacturing or procuring capabilities and capacities, subject matter experts were consulted to estimate static parameters and set boundaries for stochastic parameters (University of Maryland, Citation2021). The fraction of counterfeit parts in the customer base indicates the prevalence of counterfeit parts accessible to the operator and represents the measurement of policy impact in both case studies.
4.1. Discontinuation-driven buyback contracts
Supply-chain buyback programs are contractual agreements between different supply-chain entities (i.e., OCMs and ADs). Conventionally, a buyback policy specifies the conditions under which a retailer can return unsold merchandise for a full or partial refund, or the supplier buys back retailer inventories. In some instances, buyback contracts are in place in the supply chain to reduce the retailers’ inventory cost burden, thus promoting higher purchase volumes (Wang et al., Citation2021). Buyback contracts are often employed in supply chains characterized by uncertain demand, long production lead times, and short selling seasons (Wang, Citation2010). In the electronics market, buyback programs are in place to encourage the users to transition to the next generation of the component (e.g., Brondoni, Citation2018) or as an electronic-waste management tool (e.g., Atasu and Van Wassenhove, Citation2011). Brondoni (Citation2012) hypothesized (but does not present any supporting data) that, although largely beneficial, buyback programs as a planned obsolescence strategy can cause an increase in the presence of counterfeit parts. In this experiment, the developed network model tests the effects of the buyback contract parameters on the prevalence of counterfeit components in the electronics supply chain to test the hypothesis proposed by Brondoni (Citation2012).
4.1.1. Experiment design
In this experiment, the OCM is able to exercise a component buyback clause in a contract with its authorized distributors at any time. Unlike conventional consumer product buyback contracts, we assume that participation in this policy by authorized distributors is mandatory and applies to all agents within the AD agent base. Once a buyback is initiated, the OCM no longer accepts new component orders, effectively initiating the component’s end-of-life phase. Simultaneously, the unobligated components in the inventory of the authorized distributors are transferred back to the OCM. The OCM is able to dictate the buyback rate of components per time step. An infinite buyback rate requires the authorized distributor base to transfer all of their unobligated inventory back to the OCM immediately upon buyback initiation. Alternatively, a zero-buyback rate equates to no existing component inventory transfer back to the OCM regardless of the buyback rate, the OCM does not supply any new components to the ADs post-buyback initiation. If the customer base is carrying an inventory with a high fraction of counterfeit parts after a buyback policy is implemented, it indicates the adverse effects of the buyback policy and vice versa. Before part manufacturing discontinuation (at time step ), the OCM broadcasts how long the part will be available before discontinuation (
to all customers. At time step
the part production is stopped, and buyback is initiated according to a policy parameter, “buyback rate.” After receiving the broadcast announcement at a time step
customers may execute a last time buy. Last time buys mean that a customer estimates how many components they will need to support their systems until the next design refresh replaces the impacted part with a non-obsolete part (or until the end-of-support of their systems if there are no more design refreshes) and then buys and stores that number of parts. The customers attempt to minimize the
cost for part SKU = i associated with last time buy and design refresh by finding the optimal design refresh date
representing the last time step, the customer will consume part SKU = i in fulfilling the operator’s demand as given in Equationequation (4)
(4)
(4) :
(4)
(4)
The customer purchases an adequate quantity of parts on the discontinuation date. It is assumed that OCMs are capable of fulfilling the demand until through the ADs.
In Equationequation (4)(4)
(4) , for part SKU = i,
is the price per part at the discontinuation announcement time step
and r are model constants representing holding cost per part, constant design refresh cost, and the discount rate, respectively.
is the average demand per time step, and
is the time until discontinuation is announced by the OCM (
time steps after
). At time step
customer optimized the
function with
as the variable. On the discontinuation date, the customer orders
parts with SKU = i. After the discontinuation date, the customer no longer adheres to the aforementioned inventory policy described by equation (3) and only procures parts after the inventory reaches zero if there is still a demand. At this stage, no design refresh occurs for the system, and previously procured parts must continue to support the system. After discontinuation and depletion of the customer inventory, if there is a demand, the customer executes the purchasing mechanism shown in . Since no new authentic parts are being produced, only POE-provided parts will enter the supply chain at this point.
4.1.2. Results
The experiment was conducted with three different buyback rates, zero, 50 parts/time step, and virtually infinite (999 parts/time step) over 3000 time steps, and the results are shown in as the percentage of all the parts delivered to the operator that are counterfeit parts. The primary insight from the experiment is that a high buyback rate results in a higher prevalence of counterfeits in the supply chain. Irrespective of the buyback rate, there is an initial sudden increase in the prevalence of counterfeit parts in the supply chain followed by a buyback rate-induced increase (relative to no buyback, 0 parts/time step) in the percentage of counterfeit parts received by the operator. The takeaway from this experiment is that too rapid a buyback can initially increase the prevalence of counterfeit parts in the supply chain.
Figure 4. Discontinuance-driven buyback showing that high-rate buyback policies can result in a higher percentage of parts received by the operator being counterfeit. Discontinuance occurred at time step 1000 where 11% of the delivered inventory was counterfeit.
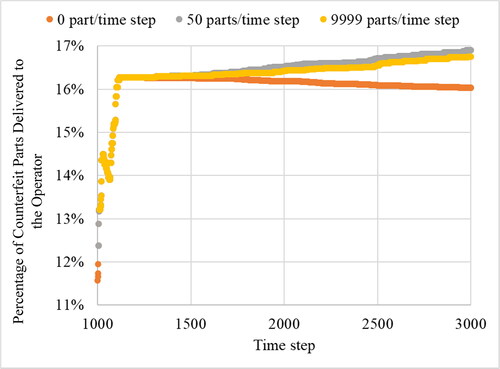
The causes of the dynamic shown in can be attributed to a reduction in the availability of the authorized parts due to the buyback. This dynamic puts pressure on component buyers, leading to purchases from non-authorized channels. The increased part demand through non-authorized channels, in turn, leads to market opportunities for counterfeiters (POEs). Such demands may be filled by illicit manufacturing and procurement by POEs, further increasing the prevalence of counterfeit parts in the supply chain. Lead time does not affect the dynamic as, during discontinuation, stocks are not replenished, and buyback is only applied to parts in inventory.
4.2. Supplier debarments
One possible consequence of getting caught selling counterfeit parts is debarment from future business opportunities. Debarment is a mechanism used by entities in critical system supply chains as a punishment, and it removes suppliers prone to selling counterfeit parts from supplier pools. It is also considered a deterrent to future infractions by the remaining members in the pool. There is no literature reporting the impact of debarment on reducing counterfeit incidences. In this experiment, multiple durations of debarment have been examined for efficacy in counterfeit part control, encouragement of IDs to increase testing accuracy and possible unintended consequences.
4.2.1. Experiment design
Each independent distributor and customer in the supply chain has the ability to test incoming shipments of parts for authenticity. The probability of correctly detecting the authenticity of incoming shipments is correlated with the parameter at time step
Each ID in the independent distributor base can independently choose the
parameter value they wish to target, while customers follow a predefined constant
value. Customer
has not been modeled as a dynamic parameter since the objective of this experiment only focuses on the behavior of IDs concerning adjusting their
in a supply chain with a debarment policy. Choosing a higher
increases the selling price per part by
as well as the offered lead time by
making the agent less competitive in securing a PO during negotiation compared to other distributors, as seen in (
is set to one for this case). However, with a higher
value, counterfeit parts are less likely to enter the agent’s inventory and later be sold, resulting in less probability of debarment and loss of participation in negotiation.
In the model, if a shipment is detected to have at least one counterfeit part, the seller is removed from the buyer’s set for a duration of debarment in time steps (
). The model assumes that no false positives occur during testing. False positive testing cases are not considered, as they are assumed to be rare and can be resolved between the involved parties without impacting specific policies and technologies. The debarment duration is a global policy applicable to all agents active in the supply chain. A secondary effect of the debarment policy is an assumption that the debarment is public knowledge to all the agents within the network. The information broadcasting allows agents to have access to information about a positive counterfeit detection case. If an agent is debarred, it can adjust its internal parameters in order to recover from lost profits during the debarment duration, namely through adjustment of its
parameter.
Many algorithms can be implemented in modeling the adjustment behavior of IDs. A Q-learning algorithm (Watkins and Dayan, Citation1992) given in Equationequation (5)
(5)
(5) has been used to model the ID’s learning behavior in correlating
with
(5)
(5)
In Q-learning, agents move from one state ( to another state (
by taking actions
in time steps. After each action, the agent reevaluates the “value” of the action through immediate reward (
), i.e., did the action result in a more favorable state or a less favorable state for the agent? The transition from state
to
by taking the action
is stored as a unitless Q-value
After reevaluation and revisitation of a state previously visited, the agent is more likely to make the decision that has the highest probability of resulting in a more favorable state. Higher Q-values are more likely decisions by an agent compared to lower value Q-values in determining possible actions.
In the model, each ID agent can be at any of the 180 discretized states ()
according to Equationequation (6)
(6)
(6) representing the IRR in terms of the slope of the net present value of the agent expressed as degrees. For example, in
And in
(6)
(6)
Agents can take 10 discretized actions to operate at any time steps
= TA
while
is the set of all possible actions at the state
The immediate reward of the agent from the state
to
by taking the action
is taken to be
reflective change in
at time step t.
and
represent unitless parameters of the algorithm, defined as the learning rate and action discount rate.
After initializing values of each agent, in each time step, agents reduce the
value by multiplying
by 0.99. This automatic reduction represents the compliance of IDs in testing during the period when no counterfeit part is identified sold by the IDs. This concept of “slacking-off” in testing acts as a mechanism to explore the state field. If the
value is less than
the agent executes the algorithm in Equationequation (5)
(5)
(5) learning the Q-value associated with taking the action of
at state
When a counterfeit part is detected in an ID agent’s outgoing shipment, and the ID is debarred, after the end of the debarment period, the ID adjusts its
based on the previously learned Q-values and its current state of
4.2.2. Results
Eight debarment durations of 0, 10, 25, 50, 100, 250, 500, and 1000 time steps were tested during a 6000 time step duration experiment. Typically, debarment times in the U.S. DoD practices are in years. Each debarment experiment was conducted with uniformly distributed demand and stochastic discrete model static values. Each experiment was conducted five times, and average values were captured and presented. Based on the simulation results, debarment is seen to not significantly impact the number of counterfeit parts delivered to the operator during the pre-discontinuation life-cycle stage of a part, as shown in .
Figure 5. The percentage of counterfeit and authentic parts received by the operator for various durations of debarment (DT) pre-discontinuance. Each bar represents a specific case study for a specific debarment duration.
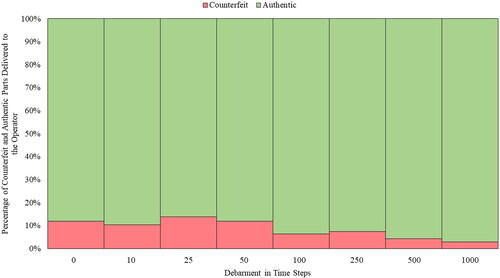
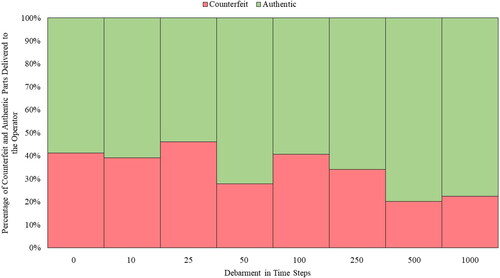
However, after the discontinuance of a part, a longer debarment duration leads to a lower fraction of counterfeit parts delivered to the operator, as shown in . The ineffectiveness of debarment during pre-discontinuance versus post-discontinuance can be attributed to IDs making up a relatively smaller share in the part flow compared with the post-discontinuance period.
Figure 6. The percentage of counterfeit and authentic parts received by the operator for various durations of debarment (DT) post-discontinuance. Each bar represents a specific case study for a specific debarment duration.
5. Policy implementation implications
Any attempt to alter a supply-chain system for the desired objective may also have unintended consequences with impacts beyond intuitive expectations. The dynamics of such systems can only be detected through practical parametric analysis. To disrupt the flow of counterfeit parts in the electronic part supply chain, we have simulated two current policies and their impacts on the stated objective of reducing the counterfeit incidence at the operator and analyzed for any unintended consequences.
Although buyback contracts are a policy tool mutually beneficial to the OCMs and distributors, they can have negative consequences concerning the proliferation of counterfeit parts. The positive business motivations should be weighed against the risk of promoting an increase in counterfeit versions of the parts removed from the supply chain. If companies choose to implement buyback contracts, the distributors should be given sufficient time to return their stock. This allocation of time would give the market time to transition away from the part and not be shocked.
Buyback contracts are implemented by the private sector, but debarment is a public policy tool to disrupt the illicit electronic parts supply chain. Enforcing public policies requires resources and has associated costs that is not borne by an individual agent, but by enforcement agencies that are not represented in this model. Enforcing debarment during a part’s pre-discontinuation stage does not significantly reduce the counterfeit parts received by the operators. However, enforcing debarment during the post-discontinuation stage of a part results in a measurable reduction in counterfeit part flow. Agencies should focus on enforcing debarment for parts that are obsolete rather than on the parts that are actively produced. With this policy choice, more resources will be available for implementation during the more effective post-discontinuation stage. It should be noted tht policies may have multiple objectives in addition to counterfiet part reduction they may achieve those objectives even if the results on coutnerfeit part prolifeartion are not positive.
6. Discussion and conclusions
This article demonstrates that a realistic electronic component supply chain that includes counterfeit parts can be built as a network model. The structure of the supply chain and the major active entities are identified. The motivation and connections of each entity, as well as their decision-making capabilities, are built into the model. Entities were modeled as agents residing in population bases. The supply-chain network model was implemented in the commercial AnyLogic simulation tool as an agent-based model.
The two studies implemented are based on actual administrative and business practices. It is impractical or impossible in real-life to conduct such an experiment. The results from this study provide policymakers with guidance on how to design, optimize and implement policy and measure the effectiveness and cost at a global scale without being influenced by the narrow goals of one member and anecdotal information. Government and company-level policymakers can use such models to test and adjust anti-counterfeiting policies before widespread implementation.
The model has been validated by observing visible dynamics such as the bullwhip effect and measurable metrics in the electronics supply chain published by the U.S. Department of Commerce (U.S. Department of Commerce, Citation2010). In addition, subject matter experts have validated each agent interaction and objective under the stated assumptions.
Several modeling simplifications have been made to represent the electronics supply chain. Agents have limited autonomy in participating in policies such as detection broadcasting and mandatory buybacks. In the real world, agents might decide not to participate in such policies for reasons such as legal ramifications and more complex profit models. We have assumed that agent populations remain constant, whereas in real-life, their numbers vary for various business reasons, including mergers, acquisitions, bankruptcies, and spinoffs. Agents’ objectives can be more abstract than maximizing profit, as was assumed in this article. Objectives such as mission success or nation-state-related objectives can introduce unique behaviors leading to rare emergent dynamics. These objectives will be incorporated in future versions of the model. These modeling simplifications will be addressed in future efforts, and other emerging policies such as distributed ledger and information sharing chains will be analyzed. Concurrent implementation of multiple mitigation/policy strategies will also be explored. The formulas presented as a mathematical representation of the supply-chain dynamics are simplified. More complex and representative mathematical representations will be introduced in future work. Our approach can be extended to other types of parts given the required modifications in the distribution channels and modes of purchase.
Reproducibility Report
Download MS Word (25.3 KB)Disclosure statement
The authors report that there are no competing interests to declare.
Additional information
Funding
Notes on contributors
Hirbod Akhavantaheri
Hirbod Akhavantaheri is graduate student in the Department of Mechanical Engineering at the University of Maryland and a research assistant at the Center for Advanced Life Cycle Engineering. He is actively researching in network modeling, blockchain technology in supply chain, reinforcement learning, evolutionary algorithms, multi-agent social systems, and policy analysis. He received his Bachelor of Science degree in Mechanical Engineering from University of Maryland in 2019. He has also previously worked on designing the architecture of novel mesh reflectors for space-based radar systems at L3Harris Technologies.
Peter Sandborn
Peter Sandborn is a Professor in the Department of Mechanical Engineering at the University of Maryland. He is a Director of the Maryland Center of Excellence for Sustainment Sciences (MChESS), a member of the CALCE Electronic Products and Systems Center and is the former Director of the Maryland Technology Enterprise Institute (Mtech) at the University of Maryland. He also currently serves as the Associate Chair for Graduate Studies in the Department of Mechanical Engineering. Dr. Sandborn's research group develops life-cycle cost models and business case support for long field life systems. This work includes: obsolescence forecasting algorithms, counterfeit part detection and network modeling, strategic design refresh planning, return on investment models for maintenance planning (including for Prognostics and Health Management) and outcome-based contract design and optimization. Dr. Sandborn is an Associate Editor of the IEEE Transactions on Electronics Packaging Manufacturing and a member of the Board of Directors of the PHM Society. He is the author of over 200 technical publications and several books on electronic packaging and electronic systems cost analysis. He was the winner of the 2004 SOLE Proceedings, the 2006 Eugene L. Grant, the 2017 ASME Kos Ishii-Toshiba, and the 2018 Jacques S. Gansler awards. He is a Fellow of the IEEE, the ASME and the PHM Society. Dr. Sandborn has a B.S. degree in engineering physics from the University of Colorado, Boulder, in 1982, and the M.S. degree in electrical science and Ph.D. degree in electrical engineering, both from the University of Michigan, Ann Arbor, in 1983 and 1987, respectively.
Diganta Das
Dr. Diganta Das (PhD, Mechanical Engineering, University of Maryland, College Park, B.Tech (Hons), Manufacturing Science and Engineering, Indian Institute of Technology) is an Associate Research Scientist at the Center for Advanced Life Cycle Engineering. His expertise is in reliability, environmental and operational ratings of electronic parts, uprating, electronic part reprocessing, counterfeit electronics, technology trends in electronic parts, and parts selection and management methodologies. His research interests include electronic parts supply chain, counterfeit electronics avoidance and detection, light-emitting diode failure mechanisms, prognostics-based risk mitigation of electronics, and power electronics reliability. He is the Vice Chair of the Standards Association of the IEEE Reliability Society, chair of the Reliability Prediction working group, and sub-group chair of several SAE counterfeit detection working groups. The is the founding chair of the long-running counterfeit parts and materials symposium. He is a Six Sigma Black Belt and a member of IEEE, IMAPS, SAE, and SMTA, and a distinguished technical member of SMTA.
Notes
1 It should be noted that currently there is very little risk of criminal prosecution, since prosecution cases are low for most white collar crimes and many POE agents are outside of the jurisdictions where the operators and OEMs operate.
2 Equations Equation(1)(1)
(1) through (3) are not unique to the electronics supply chain. These equations can be applied to other supply chains where agents are motivated by IRR and purchase parts based on their inventory level.
References
- Anzoom, R., Nagi, R. and Vogiatzis, C. (2021) A review of research in illicit supply-chain networks and new directions to thwart them. IISE Transactions, 54(2), 134–158.
- Asadizanjani, N., Tehranipoor, M. and Forte, D. (2017) Counterfeit electronics detection using image processing and machine learning. Journal of Physics: Conference Series, 787(1), 012023.
- Atasu, A. and Van Wassenhove, L.N. (2011) An operations perspective on product take-back legislation for E-waste: Theory, practice, and research needs. Production and Operations Management, 21(3), 407–422.
- Axtell, R. (2000) Why agents? On the varied motivations for agent computing in the social sciences. Centeron Social and Economic Dynamics, 1–23.
- Berry, D., Towill, D.R. and Wadsley, N. (1994) Supply chain management in the electronics products industry. International Journal of Physical Distribution & Logistics Management, 24(10), 20–32.
- Bhushan, S., Tirupati, D. and Suresh, D.N. (2013) System dynamics modeling based analysis to combat counterfeit drugs supply chain in India. IIM Bangalore Research Paper, (417).
- Blume, L. (2015) Agent-based models for policy analysis. In: Committee on the Assessment of Agent-Based Models to Inform Tobacco Product Regulation; Board on Population Health and Public Health Practice; Institute of Medicine; Wallace R., Geller A., Ogawa V.A., editors. Assessing the Use of Agent-Based Models for Tobacco Regulation. Washington (D.C.): National Academies Press (U.S.)
- Bodner, D.A. (2014) Enterprise modeling framework for counterfeit parts in defense systems. Procedia Computer Science, 36, 425–431.
- Bodner, D.A. (2015) Mitigating counterfeit part intrusions with enterprise simulation. Procedia Computer Science, 61, 233–239.
- Bright, D., Koskinen, J. and Malm, A. (2019). Illicit network dynamics: The formation and evolution of a drug trafficking network. Journal of Quantitative Criminology, 35(2), 237–258.
- Brondoni, S.M. (2012) Innovation and imitation: Corporate strategies for global competition, Symphonya. Emerging Issues in Management, (1), 10–24.
- Brondoni, S.M. (2018) Planned obsolescence, total quality, zero defects and global competition. Symphonya. Emerging Issues in Management, (2), 8–20.
- Busby, J.S. (2019) The co-evolution of competition and parasitism in the resource-based view: A risk model of product counterfeiting. European Journal of Operational Research, 276(1), 300–313.
- Chen, S., Zhang, H., Guan, J. and Rao, Z. (2020) Agent-based modeling and simulation of stochastic heat pump usage behavior in residential communities. Building Simulation, 13(4), 803–821.
- Choi, J.B., Rogers, J. and Jones, E.C. (2015) The impact of a shared pharmaceutical supply chain model on counterfeit drugs, diverted drugs, and drug shortages. 2015 Portland International Conference on Management of Engineering and Technology (PICMET), IEEE, Portland, OR, USA, pp. 1879–1889.
- Cui, P., Dixon, J., Guin, U. and Dimase, D. (2019) A blockchain-based framework for supply chain provenance. IEEE Access, 7, 157113–157125.
- Fernandez, F.M., Green, M.D. and Newton, P.N. (2008) Prevalence and detection of counterfeit pharmaceuticals: A mini review. Industrial & Engineering Chemistry Research, 47(3), 585–590.
- Guin, U., Huang, K., DiMase, D., Carulli, J.M., Tehranipoor, M. and Makris, Y. (2014) Counterfeit integrated circuits: A rising threat in the global semiconductor supply chain. Proceedings of the IEEE, 102(8), 1207–1228.
- Islam, M.N. and Kundu, S. (2019) Enabling IC traceability via blockchain pegged to embedded PUF. ACM Transactions on Design Automation of Electronic Systems, 24(3), 1–23.
- Kanovsky, A., Spanik, P. and Frivaldsky, M. (2015) Detection of electronic counterfeit components. 16th International Scientific Conference on Electric Power Engineering (EPE), IEEE, Ostrava, Czech Republic, pp. 701–705.
- Livingston, H. (2010) Securing the DOD Supply Chain from the Risks of Counterfeit Electronic Components. BAE Systems. https://www.erai.com/CustomUploads/ca/wp/2010_1_Securing_the_DOD_Supply_Chain_from_the_Risks_of_Counterfeit_Electronic_Components.pdf
- Macal, C.M. and North, M.J. (2010) Tutorial on agent-based modelling and simulation. Journal of Simulation, 4, 151–162.
- Magliocca, N.R., McSweeney, K., Sesnie, S.E., Tellman, E., Devine, J.A., Nielsen, E.A., Pearson, Z. and Wrathall, D.J. (2019) Modeling cocaine traffickers and counterdrug interdiction forces as a complex adaptive system. Proceedings of the National Academy of Sciences, 116(16), 7784–7792.
- Pennock, M., Rouse, W. and Bodner, D. (2016) Enterprise systems analysis, Systems Engineering Research Center, Technical Report SERC-2016-TR-103. https://apps.dtic.mil/sti/pdfs/AD1032936.pdf
- Rahmandad, H. and Sterman, J. (2008) Heterogeneity and network structure in the dynamics of diffusion: Comparing agent-based and differential equation models. Management Science, 54(5), 998–1014.
- Rice, J. and Caniato, F. (2003) Building a secure and resilient supply network. Supply Chain Management Review, 7, 22–30.
- Rouse, W.B. and Bodner, D.A. (2013) Multi-level modeling of complex socio-technical systems, Center for Complex Systems & Enterprises, Report No. CCSE-2013-01.
- SAE (2022) Counterfeit Electronic Parts; Avoidance, Detection, Mitigation, and Disposal. SAE International, Standard AS5553.
- Sandborn, P. (2008) Trapped on technology’s trailing edge. IEEE Spectrum, 45(1), 42–45.
- Santhanam, K., Sekaran, S., Vaikundam, S. and Kumarasamy, A.M. (2013) Counterfeit currency detection technique using image processing, polarization principle and holographic technique. Fifth International Conference on Computational Intelligence, Modelling and Simulation, IEEE, Seoul, South Korea, pp. 231–235.
- Schipp, F. (2018) Current trends in counterfeit electronic parts. Proceedings of the CALCE Symposium on Counterfeit Parts and Materials, Center for Advanced Life Cycle Engineering, College Park, MD, USA.
- University of Maryland (2021), Enterprise Network Models for Counterfeit Part Supply Chains Workshop, August 5. Available at http://escml.umd.edu/NSFCounterfeit/Network%20Modeling%20Workshop%20Report%20-%20Final.pdf (accessed 14 February 2023).
- U.S. Department of Commerce, (2010) Bureau of Industry and Security Office of Technology Evaluation, Defense Industrial Base Assessment: Counterfeit Electronics. Available at https://www.bis.doc.gov/index.php/documents/technology-evaluation/37-defense-industrial-base-assessment-of-counterfeit-electronics-2010/file (accessed 14 February 2023).
- U.S. Government Accountability Office (2016) DOD needs to improve reporting and oversight to reduce supply chain risk. GAO Report GAO-16-236, 1-45. Retrieved from https://gao.org
- U.S. Senate Armed Services Committee (2011) Inquiry into Counterfeit Electronic Parts in the Department of Defense Supply Chain. 112th Congress 2nd Session Report 112–167. Avaiable at https://www.govinfo.gov/content/pkg/CHRG-112shrg72702/html/CHRG-112shrg72702.htm (accessed 14 February 2023).
- Wang, J. (2010) Using fuzzy optimization model and hybrid intelligent algorithm to solve buyback problem. Proceedings of the IEEE International Conference on Intelligent Computing and Intelligent Systems, IEEE Press, Piscataway, NJ, pp. 649–652.
- Wang, S., Gurnani, H. and Subramanian, U. (2021) The informational role of buyback contracts. Management Science, 67(1), 279–296.
- Watkins, C.J. and Dayan, P. (1992) Q-learning. Machine Learning, 8(3), 279–292.
- Yin, H., Zheng, J. and Wang, X. (2004) Multi-agent-based supply chain modeling and bidding. Fifth World Congress on Intelligent Control and Automation, IEEE, Hangzhou, China, pp. 3187–3191.
- Zhang, J. and Zhang, R.Q. (2015) Supply chain structure in a market with deceptive counterfeits. European Journal of Operational Research, 240(1), 84–97.
- Zhao, C. and Qiu, J. (2014) Agent-based simulation for order selection strategy in collaboration process of supply chain. 18th International Conference on Computer Supported Cooperative Work in Design, IEEE, Hsinchu, Taiwan pp. 18–22.