
ABSTRACT
This study quantified rugby referees’ decision-making accuracy at the breakdown in an elite rugby sevens tournament, examining whether decision-making accuracy differed over time, and if it was associated with match demands, score difference, field location, and referee positioning. During the National Sevens Tournament (six referees, 22 matches), decision-making accuracy was analysed using video coding from 602 breakdowns and match demands were examined using GNSS technology and heart rate recordings. Overall, the referees had a decision-making accuracy of 88.2% with no changes over time (all p > 0.05). There were no significant associations between match demands, score difference, or field location and decision-making accuracy (all p > 0.05). However, significantly more incorrect decisions occurred when the referees were in a suboptimal position (29.0%) compared to an optimal position (10.9%) at the breakdown (p < 0.05). The findings suggest that referees’ decision-making accuracy during the breakdown remains relatively consistent across an elite rugby sevens tournament. While unaffected by match demands, score difference or field location, referees’ decision-making accuracy may be improved by optimising their positioning at the breakdown.
1. Introduction
Rugby sevens is an intermittent contact sport played across different ages and competitive levels (e.g. youth to adults and amateur to international; Ross et al., Citation2015; Sant’Anna, Roberts et al., Citation2019). Although it is played under the same laws and on the same sized field as 15-a-side rugby union, rugby sevens teams comprise fewer players, matches are 14 minutes in duration (i.e. 2 halves of 7 minutes), and is usually played in a tournament format, with teams playing multiple matches over one or consecutive days of competition (Ross et al., Citation2015; Sant’Anna, Roberts et al., Citation2019). Rugby sevens matches are under the control of a referee and two touch judges or assistant referees (Sant’Anna, Roberts et al., Citation2019; Suarez-Arrones, Calvo-Lluch et al., Citation2013). For elite-level matches, two in-goal judges are also incorporated (Sant’Anna, Roberts et al., Citation2019). Officiating field-based invasion team sports such as rugby sevens requires fast and accurate processing of gameplay information to guide appropriate infringement-based decision-making (Ollis et al., Citation2006). The referee is the sole judge of facts and responsible for enforcing the laws of the game, ensuring matches are played in a fair and safe manner (World Rugby, Citation2020). Referees cover a total distance ranging from ~1600 m to 2000 m, of which ~550 m is covered at high-intensity (>18.4 km−1) speed at an average of ~85% of the maximum heart rate (Sant’Anna, Moore et al., Citation2019; Sant’Anna, Roberts et al., Citation2019; Suarez-Arrones, Calvo-Lluch et al., Citation2013; Suarez-Arrones, Núñez et al., Citation2013), and these match demands do not appear to differ between halves or days of competition (Sant’Anna, Moore et al., Citation2019; Suarez-Arrones, Calvo-Lluch et al., Citation2013). However, to date, no study has investigated the associations between the match demands placed on rugby sevens referees and their decision-making accuracy. Indeed, only a relatively small number of studies have shed light on this issue in any sport, revealing mixed results. For example, Emmonds et al. (Citation2015) observed no significant relationship between distance covered, high-intensity running efforts, mean heart rate, and decision-making accuracy among rugby league referees. However, Elsworthy et al. (Citation2014) found that the running speed prior to an incorrect decision was significantly higher than for a correct decision, thus impeding the decision-making accuracy of Australian football umpires.
Beyond match demands, research has investigated the associations between decision-making accuracy of officials and time (Ahmed et al., Citation2017; Elsworthy, Burke, Scott et al., Citation2014b; Larkin et al., Citation2014; Mallo et al., Citation2012; Mascarenhas, Button, Dicks, & Dicks, 2009; Riiser et al., Citation2019), score difference (Corrigan et al., Citation2019; Lago-Peñas & Gómez-López, Citation2016), field location (Castillo et al., Citation2019; Corrigan et al., Citation2019; Elsworthy, Burke, Scott et al., Citation2014b; Gómez Carmona & Pino Ortega, Citation2016), and referee positioning (Elsworthy, Burke, Dascombe et al., Citation2014; Mallo et al., Citation2012). In terms of time, Mallo et al. (Citation2012) found decision-making accuracy to be lowest among soccer referees in the last 15 minutes of a match, but Mascarenhas et al. (Citation2009) found the lowest accuracy to occur in the opening 15 minutes of each half during a soccer match. With regard to score difference, Lago-Peñas and Gómez-López (Citation2016) found that a greater score difference between the teams resulted in less extra time being added by the referees, but as score difference increased, Australian football umpire’s decision-making accuracy was found to improve (Corrigan et al., Citation2019). In terms of field location, Castillo et al. (Citation2019) found no differences in the decision-making accuracy of soccer referees, while Gómez Carmona and Pino Ortega (Citation2016) found that they were more likely to make incorrect decisions on the right side of the field. Regarding referee positioning, Mallo et al. (Citation2012) found that greater distances from the play were associated with poorer decision-making among soccer referees, while Elsworthy et al. (Citation2014) found that distance from play did not affect the accuracy of free-kick decisions among Australian football umpires. Thus, overall, the findings from the literature have been inconsistent, and no study to date has been conducted with rugby sevens referees specifically.
During a rugby sevens match, the most frequent contact events, where opposing players physically engage with each other to contest for possession of the ball, occur during the tackle and ruck (Hendricks et al., Citation2020). A tackle occurs when the ball-carrier is held and brought to the ground by one or more opponents, and a ruck is formed when at least one player from each team is in contact, on their feet and over the ball which is on the ground (World Rugby, Citation2020). The short period of play including and immediately after the tackle, and before and during the ruck, is collectively known as the breakdown (Mitchell & Tierney, Citation2020), and is the event where most (52%) penalty kicks (or penalties) are awarded in a rugby sevens match (World Rugby, Citation2019). Additionally, over 60% of all player injuries occur during the breakdown at an elite international level (Hendricks et al., Citation2020). Therefore, the breakdown is the most important and challenging event for a rugby sevens referee to officiate, hence the importance of accurate decision-making, ensuring a fair outcome at this phase of play in a match.
This study had two aims. First, the study aimed to assess referees’ decision-making accuracy at the breakdown during an elite rugby sevens tournament, and to examine whether this changed over time (i.e. first vs. second half of a match, group [day 1] vs. knockout [day 2] stage of a tournament). Second, the study aimed to investigate whether the decision-making accuracy of referees was related to the match demands in the 30 seconds preceding the breakdown (e.g. high-intensity running), as well as the score difference, field position, or referee positioning. It was hypothesised that referee decision-making accuracy would not differ based on match period, tournament stage, and would not be related to score difference. However, it was predicted that decision-making accuracy would be related to match demands, field location, score difference, and referee positioning such that decision-making accuracy would be compromised considerably after high-intensity running, for events located nearer the goal line, when the score difference was small, and when the referee was sub-optimally positioned.
2. Methods
2.1. Participants
Six male referees (age: 26 ± 2 years; body mass: 77.6 ± 6.3 kg, height: 183 ± 5 cm) officiating at the national level volunteered to participate in the study. All referees had at least two years of refereeing experience (6 ± 1 years). Data was collected during a professional National Rugby Sevens tournament in 2019, over 22 matches, resulting in 4 ± 2 matches per referee (range = 1 to 5 matches). The study received institutional ethical approval (University of Bath, REACH: EP 17/18112) and permission to undertake the study was granted by the Rugby Football Union (RFU) Referee Manager. Finally, written informed consent was obtained from each referee prior to data collection.
2.2. Decision-making accuracy
All matches were broadcast live on television by a commercial broadcasting company, the recordings of which were used for analysis using coding software (NacSports Pro Plus V.5.0.1). The total number and timing of each breakdown was coded by the primary researcher, who had more than 10 years of experience refereeing from amateur to elite-level matches. The primary researcher coded the referees’ decisions at each of the 602 breakdowns events in all 22 matches and then recoded all matches 2 weeks later with excellent intra-coder reliability (K = 0.81, p < 0.001, 95% CI [0.64–0.99]) (Cohen, Citation1988). Inter-coder reliability was also assessed via an experienced rugby referee reviewer coding all the matches once, revealing excellent reliability (K = 0.86, p < 0.001, 95% CI [0.80–0.90]) (Cohen, Citation1988). Despite the excellent reliability, when an agreement could not be reached (n = 98), the “gold-standard” was set by the more experienced referee reviewer, who has officiated rugby at an elite-level, and was actively reviewing elite rugby matches as part of their occupation at the time of the study.
Each of the 602 breakdowns was assessed in terms of whether a penalty offence was committed or not. Penalties were assessed according to the World Rugby law book (laws 14 and 15, tackle and ruck, respectively) (World Rugby, Citation2020). With the use of the video analysis, it was possible to play, replay, and pause all the situations before seeing the actual match referee’s decision, to decide whether the decisions taken by the referees were correct or incorrect, and to identify any “missed” decisions by the referees. Coders were instructed not to watch or rely on the match referee’s decision. Specifically, each breakdown decision was classified as either: (1) correct (i.e. penalty was awarded against a player who had infringed), (2) incorrect (i.e. penalty was awarded but no infringement was committed, or a penalty was awarded against a player who had not infringed), and (3) missed (i.e. a penalty was not awarded against a player who had infringed). These categories were used in previous research with rugby league (Emmonds et al., Citation2015), soccer (Riiser et al., Citation2019), and Australian football (Elsworthy, Burke, Scott et al., Citation2014b) officials. In the case that no infringement had been committed, or the referee decided that the offence was not material (i.e. no clear effect or impact), the decision was placed into a fourth category (i.e. play on), provided none of the other categories applied. Incorrect and missed penalties (i.e. categories 2 and 3) were then combined to reflect “incorrect decisions”, while correct and play on decisions (i.e. categories 1 and 4) were combined to reflect “correct decisions” (Emmonds et al., Citation2015; Riiser et al., Citation2019). Finally, the decision-making accuracy was calculated as the number of correct decisions divided by the total number of decisions (i.e. correct, incorrect, missed, and played on) (Elsworthy, Burke, Scott et al., Citation2014b).
2.3. Field location, score difference, and referee positioning
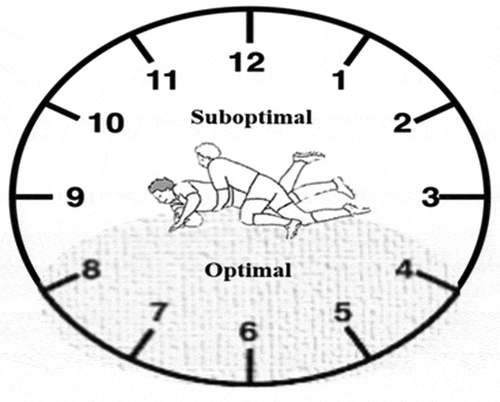
As well as examining the referees decisions, each breakdown was coded according to: (1) field location in relation to the team who had possession (i.e. zone A = attacking area between 22-m area and the try line, zone B = attacking area between 22-m area and the halfway line, zone C = defensive area between 22-m area and the halfway line, or zone D = defensive area between 22-m area and the try line (Van Rooyen et al., Citation2010); see ); (2) score difference between the two teams at the time of the breakdown (i.e. small = ≤7 points, medium = 8 to 14 points, or large = ≥15 points (Corrigan et al., Citation2019); and (3) referee positioning at the time of the breakdown, according to the “clock definition”, with the breakdown at the centre of the “clock” (i.e. optimal = 4 to 8 o’clock, suboptimal = 8 to 4 o’clock (RFU, Citation2018); see ).
Figure 1. The schematic used to code the area of the field where the breakdown occurred
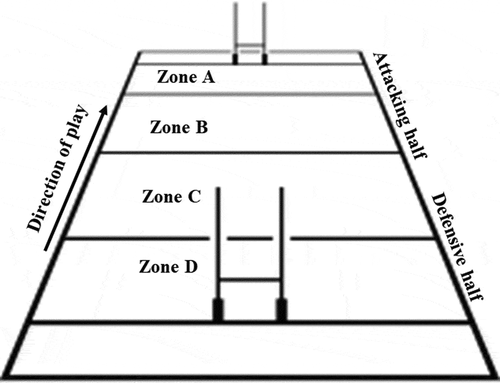
Figure 2. The “clock definition” used to code referee positioning as optimal or suboptimal
2.4. Match demands
Beneath their normal kit, the referees wore an elasticated vest with an augmented concurrent Multi-Global Navigation Satellite System (GNSS) receiver unit (Apex Pro Series, 10 Hz, STATSports, Belfast, UK), located between their shoulder blades. The GNSS unit was switched on ~15 minutes before, and turned off immediately after, each match. The validity and reliability of this GNSS unit have been reported previously (Beato et al., Citation2018). Each referee was allocated a specific GNSS unit for the entire duration of the study and were familiar with wearing similar units. The data collected in each match included: total, and high-intensity (>18.4 km.h−1) distance covered (m), the number of high-intensity (>2.79 m.s−2) accelerations (calculated from a single derivation of the speed during a period of 0.5 seconds (Couderc et al., Citation2019) and sprints (20 km.h−1 or greater sustained for at least 1s (Sant ‘Anna et al., Citation2020; Sant’Anna, Roberts et al., Citation2019) (n), and total sprint distance (m) (Sant’Anna, Roberts et al., Citation2019).
Heart rate (HR) data was also collected during matches from each referee through an HR sensor (Polar T31, Polar Electro, Kempele, Finland) worn around each referee’s chest, which transmitted real-time data via Bluetooth to the GNSS unit. Maximal HR (HRmax) was determined to be the highest of either: (1) HRmax estimated through the formula: 208 – (0.7 x age) (Tanaka et al., Citation2001), or (2) HRmax values obtained during the match (Suarez-Arrones, Calvo-Lluch et al., Citation2013).
2.5. Procedure
After collection and before the analysis, match footage and GNSS data were manually synchronised by the primary researcher at the start of each half, and at the time of each breakdown. In line with previous research (Elsworthy, Burke, Dascombe et al., Citation2014; Riiser et al., Citation2019), the match demands 30 seconds prior to each breakdown event were determined for the total and high-intensity distance covered, number of high-intensity accelerations and sprints, sprint distance, and average HR. Unfortunately, due to the GNSS signal loss in the last minute of the two matches, the match demands prior to 10 breakdowns were not included in the final analysis. Thus, the analysis between match demands and decision-making accuracy were based on data from 592 breakdowns, while all other analyses were based on data from 602 breakdowns.
2.6. Statistical analysis
Video analysis data was exported from Nacsport software (Pro PLUS V.5.0.1) into Microsoft Excel. Data from each GNSS unit was downloaded to analysis software (STATSports Apex software, v. 3.0.02011). All data was then exported to statistical analysis software (IBM SPSS v.27.0; IBM Corp., Armonk, NY, USA). Data distributions were checked using Shapiro–Wilk tests and homogeneity of variances were investigated using Levene’s tests where appropriate. Normally distributed data (i.e. total distance) are presented as mean plus standard deviation (SD), while non-normally distributed data (i.e. high-intensity distance, average HR, number of high-intensity accelerations and sprints, and sprint distance) are presented as median with interquartile range (IQR). Differences in the number of correct and incorrect decisions between the first and second halves of matches, group and knockout stages of the tournament, score difference, field location, and referee positioning were analysed via chi-square tests. Furthermore, for normally distributed data, the differences in match demands between correct and incorrect decisions were analysed via paired samples t-tests, with effect sizes (Cohen’s d) of 0.2, 0.5 and 0.8 interpreted as small, medium, and large, respectively (Cohen, Citation1988). In contrast, for non-normally distributed data, the differences in match demands between correct and incorrect decisions were examined by Wilcoxon signed rank tests, with effect sizes (r) of 0.1, 0.3, and 0.5 interpreted as small, medium, and large, respectively (Cohen, Citation1988). Finally, associations between match demands, field position, score difference, referee position and decision-making accuracy were analysed via a series of binary logistic regression analysis with decision-making accuracy (i.e. correct = 1 vs. incorrect = 2) entered as the dependent variable, and total and high-intensity distance, average HR, number of high-intensity accelerations and sprints, sprint distance, score difference, field position, and referee position entered as independent variables. For all the statistical analyses, α was set at 0.05.
3. Results
3.1. Decision-making accuracy
During the tournament, there were a total of 602 breakdowns, with a mean of 27 ± 7 breakdowns per match, representing one breakdown every 35 ± 12 seconds. There was an average of 4 ± 2 breakdown penalties per match, which equates to one penalty every 9 ± 6 breakdowns. Overall, the referees made the correct decision in 531 breakdowns and incorrect decisions in 71 breakdowns (i.e. 52 missed and 19 incorrect decisions), which represents a decision-making accuracy of 88.2%.
3.2. Changes in decision-making accuracy over time
A total of 322 breakdowns occurred during the first half, with referees having a decision-making accuracy of 88.5% (285 breakdowns), and 280 breakdowns occurred during the second half, with referees having a decision-making accuracy of 87.8% (246 breakdowns). The frequency of correct and incorrect decisions did not differ significantly between the first and second halves of matches across the tournament (X2[1] = 1.06, p = 0.30). In the group stage, there were a total of 341 breakdowns, with referees displaying a decision-making accuracy of 89.7% (306 breakdowns), whereas in the knockout stage there were a total of 261 breakdowns, with the referees having a decision-making accuracy of 86.2% (225 breakdowns). The frequency of correct and incorrect decisions did not differ significantly between the group and knockout stages of the tournament (X2[1] = 0.03, p = 0.87). Finally, there were no significant differences in the decision-making accuracy of referees between the first and second halves during the group (X2[1] = 2.0, p = 0.16) or knockout (X2[1] = 0.85, p = 0.35) stages of the tournament ().
Table 1. Summary of breakdown decision-making accuracy between the first and second halves during the two stages of the tournament (i.e. group and knock-out stages)
3.3. Differences in match demands between correct and incorrect decisions
In the 30 seconds prior to the breakdown, the total distance covered was not significantly different between correct and incorrect decisions (68 ± 6 m vs. 66 ± 8 m, respectively; t(5) = 1.00, p = 0.36, d = 0.4). Moreover, high-intensity distance covered (Z = −0.73, p = 0.46, r = −0.21), average HR (Z = −0.52, p = 0.60, r = −0.15), number of high-intensity accelerations (Z = −0.105, p = 0.92, r = −0.03), and sprints (Z = −0.105, p = 0.92, r = −0.03), and sprint distance (Z = −0.73, p = 0.46, r = −0.21), did not differ significantly between correct and incorrect decisions ().
Table 2. Median (IQR) high-intensity distance, average HR, number of high-intensity accelerations and sprints, and sprint distance, in the 30 seconds before correct and incorrect breakdown decisions
3.4. Associations between match demands and decision-making accuracy
Total (β = −0.01, p = 0.63) and high-intensity (β = −0.01, p = 0.80) distance, average HR (β = −0.03, p = 0.12), number of high-intensity accelerations (β = 0.06, p = 0.69) and sprints (β = 0.16, p = 0.34), and sprint distance (β < 0.01, p = 0.58), all failed to account for a significant proportion of variance in decision-making accuracy.
3.5. Associations between score difference, field location, referee positioning and decision-making accuracy
Neither the score difference (β = 0.09, p = 0.57), nor the field position (β = 0.08, p = 0.56), accounted for a significant proportion of the variance in decision-making accuracy. However, referee positioning accounted for a significant proportion of the variance in decision-making accuracy (β = 1.21, p = 0.004), with incorrect decisions more likely to occur when the referees were in a suboptimal (29.0%) compared to an optimal (10.9%) position.
4. Discussion
This study assessed rugby referees’ decision-making accuracy at the breakdown during an elite rugby sevens tournament in relation to time (i.e. first vs. second halves, group vs. knock-out stages), match demands in the 30 seconds preceding the breakdown (e.g. high-intensity distance covered), score difference, field position, and referee positioning. The results showed no significant difference in the breakdown decision-making accuracy between the first and second halves of matches or the two stages of the tournament (i.e. group vs. knock-out), and no association between decision-making accuracy and the match demands 30 seconds prior to a breakdown decision. Furthermore, score difference and field position were unrelated to decision-making accuracy, but rugby referees were more likely to make an incorrect decision when officiating the breakdown from a suboptimal position than an optimal position.
The decision-making accuracy of rugby sevens referees found in this study (i.e. 88.2%) is similar to that reported for Australian football umpires (Elsworthy, Burke, Dascombe et al., Citation2014), and higher than that reported for 15-a-side rugby (Mascarenhas et al., Citation2005) and rugby league (Emmonds et al., Citation2015) referees (i.e. ~50% and 74%, respectively). The contrast in referees’ decision-making accuracy between rugby sevens and other rugby codes might be due to differences in the nature of the sports (i.e. less players involved in a contact situation in sevens), and the methods of quantifying decision-making accuracy (i.e. real-word match play vs. video-based test). Additionally, the results did not reveal any differences in decision-making accuracy between the first and second halves of matches, which corroborate the findings by Castillo et al. (Citation2019), that reported that soccer referees' decision-making accuracy were not affected by match period. The relatively short duration (i.e. 14 minutes) and high-intensity nature of rugby sevens matches may explain why no differences in decision-making accuracy was observed between the halves. Indeed, the relatively short periods of rest (i.e. ball out-of-play time and half time interval) may protect rugby sevens referees from experiencing a dip in decision-making accuracy, with the referees better able to maintain their mental awareness throughout the entire match (Mascarenhas et al., Citation2009). Moreover, no differences in decision-making accuracy emerged between the group and knock-out stages of the tournament, which is in line with one study which found that soccer referees’ decision-making accuracy was unaffected by tournament phase (Castillo et al., Citation2019). Thus, the consecutive days of the tournament seemed to have no influence on decision-making accuracy, potentially because the referees maintained their optimal mental and physiological activation throughout both tournament stages.
This study showed that the quality of the referee officiating at the breakdown was not influenced by the match demands 30 seconds prior. Specifically, no significant effects emerged between correct and incorrect decisions, a finding that is consistent with the results of previous research conducted with soccer referees (Riiser et al., Citation2019) and Australian Football umpires (Elsworthy, Burke, Dascombe et al., Citation2014). However, Elsworthy et al. (Citation2014) reported that higher relative running speeds 5 seconds before a decision increased the likelihood of a decisional error for Australian Football umpires, suggesting that the increased physiological loads immediately prior to a decision may facilitate a reduction in the cognitive processes which are involved in decision-making due to changes in cerebral blood flow. Additionally, no significant differences in average HR were observed between correct and incorrect decisions in the present study, which is consistent with the findings of previous research with soccer referees (Mascarenhas et al., Citation2009), but contradicts the findings from Gómez Carmona and Pino Ortega (Citation2016) who found an increase in errors among soccer referees when working above 85% of the maximum HR. Thus, given the conflicting findings in the literature, and the lack of associations observed between decision-making accuracy and match demands 30 seconds prior to the breakdown in this study suggests that none of these variables (e.g. high-intensity distance covered) can be used in isolation to predict decision-making accuracy. Additionally, it's worth considering that all referees involved in this study were part of the RFU National Panel, routinely assessed in terms of physical fitness and match reviews. Therefore, their level of training (fitness and technical) is likely to be sufficient to enable their decision-making accuracy to be unaffected by stage of tournament or match demands.
The present study showed that decision-making was not associated with the score difference between the two teams. This result does not corroborate the findings of previous research conducted with Australian Football umpires (Corrigan et al., Citation2019), and contradicts the findings reported by soccer referees (Lago-Peñas & Gómez-López, Citation2016). Specifically, the score differential appeared to affect soccer referees’ decision-making in close matches as the amount of injury time they awarded depended on the score margin, with a greater score difference resulting in less extra time being added (Lago-Peñas & Gómez-López, Citation2016). Additionally, the present study analysed the association between decision-making accuracy and field position. In contrast to the findings reported with Australian Football umpires (Corrigan et al., Citation2019; Elsworthy, Burke, Scott et al., Citation2014b), there was no association between field position and decision-making accuracy, which is in line with the results reported with soccer referees (Castillo et al., Citation2019). Thus, our results might infer that the referees’ decision-making accuracy did not seem to differ based on score differential or field position. One possible explanation for our findings, is that the tournament was held at a neutral venue with an impartial crowd, thus bias caused by “home advantage”, where the surrounding crowd appeared to influence (albeit subconsciously) the referees’ decisions in favour of the home team, were less likely to occur (Nevill et al., Citation2017).
The results of the present study indicated that rugby referees were more likely to make correct decisions in the breakdown when in an optimal position compared to a suboptimal position. This result is consistent with the findings of previous research with soccer referees (Johansen & Erikstad, Citation2020), and may indicate that optimal positioning (i.e. short distance, good angle of sight) allows referees to make better decisions based on more relevant and timely environmental cues, and that suboptimal positioning may lead to limited visual input and thus an increased risk of incorrect decisions (Johansen & Erikstad, Citation2020). In fact, to apply the laws of the game, referees are expected to follow the game closely irrespective of the intensity of their previous movements because good positioning is considered crucial for accurate decision-making (Helsen & Bultynck, Citation2004). Thus, the placement of the referee at an optimal angle and with good insight into the breakdown seems to be important for correct decision-making. Accordingly, for the practice of officiating, the findings suggest that referees should improve their awareness to achieve an optimal position at the breakdown (i.e. between 4 and 8 o’clock ,RFU, Citation2018), which could result in more accurate decision-making.
This is the first study to examine the decision-making accuracy of rugby sevens referees, and to evaluate situations leading to both action and no action from the referee, giving a more representative and accurate assessment of decision-making accuracy. However, despite the novel findings of the present study, it is not without limitations. First, the analyses were first performed during only one elite rugby sevens tournament, potentially limiting the generalisability of the findings to other rugby codes, tournaments, and competitive levels. Thus, similar studies in more sevens tournaments, and during 15-a-side rugby matches of different competitive levels (e.g. amateur vs. elite) should be conducted to either confirm or refute the findings from this study. Second, it is worth noting that the decision-making accuracy data presented in this study represents only a selection of incidents (i.e. breakdown events), and although breakdown decisions might represent a relatively large proportion of the total decisions a referee makes during a match (World Rugby, Citation2019), rugby sevens refereeing also involves making decisions in other contact (e.g. scrums and lineouts) and game (e.g. forward passes, offsides) events. As such, future research should aim to establish methods to identify how the variables assessed in this study (e.g. score difference, referee positioning, etc.) influence the decision-making accuracy across all events during rugby sevens matches and tournaments. Third, this study focused only on-field referee’s decision-making accuracy and did not consider inputs from assistant referees. Given that assistant referees monitor many elements of the game (e.g. foul play and offside lines) and frequently communicate with and support referees in their judgement of play (Mallo et al., Citation2012; Pietraszewski et al., Citation2014), future research should examine the influence of assistant referees on the decision-making accuracy of on-field referees. Finally, this study only investigated whether internal match-related factors (e.g. field location) influenced decision-making accuracy. Therefore, future research should investigate the influence of external factors (e.g. crowd noise) on the decision-making accuracy of rugby referees (Nevill et al., Citation2017).
5. Conclusion
In conclusion, this study showed that the decision-making accuracy of rugby referees at the breakdown in an elite sevens tournament did not differ significantly over time (i.e. first vs. second halves of matches, group vs. knock-out stages of a tournament) and that the match demands 30 seconds prior to a breakdown event, score difference, and field position were not associated with decision-making accuracy. However, referees were more likely to make an incorrect decision when in a suboptimal position. Thus, positioning skills are worth reviewing and improving as part of referees’ training programmes aimed at enhancing decision-making accuracy.
Acknowledgments
The authors would like to thank the referees who took part. Further, we would like to thank the Rugby Football Union for allowing access to referees, and STATSports for providing the GNSS units. Finally, the authors would like to thank Clare Daniels for her help during the preparation of the manuscript.
Disclosure statement
No potential conflict of interest was reported by the author(s).
Additional information
Funding
References
- Ahmed, H., Davison, G., & Dixon, D. (2017). Analysis of activity patterns, physiological demands and decision-making performance of elite Futsal referees during matches. International Journal of Performance Analysis in Sport, 17. https://doi.org/https://doi.org/10.1080/24748668.2017.1399321
- Beato, M., Coratella, G., Stiff, A., & Iacono, A. D. (2018). The validity and between-unit variability of GNSS units (STATSports Apex 10 and 18 Hz) for measuring distance and peak speed in team sports. Frontiers in Physiology, 9, 1288. https://doi.org/https://doi.org/10.3389/fphys.2018.01288
- Castillo, D., Raya-González, J., Usabiaga, O., Cámara-Tobalina, J., Castellano-Paulis, J., & Yanci-Irigoyen, J. (2019). Analysis of the success in soccer match officials’ decisions during an international tournament according to contextual factors. RICYDE. Revista internacional de ciencias del deporte, 15(57), 225–234. https://doi.org/https://doi.org/10.5232/ricyde
- Cohen, J. (1988). Statistical power analysis for the behavioral-sciences. Perceptual and Motor Skills, 67(3), 1007.
- Corrigan, S. L., Dwyer, D. B., Harvey, B., & Gastin, P. B. (2019). The influence of match characteristics and experience on decision-making performance in AFL umpires. Journal of Science and Medicine in Sport, 22(1), 112–116. https://doi.org/https://doi.org/10.1016/j.jsams.2018.06.005
- Couderc, A., Gabbett, T. J., Piscione, J., Robineau, J., Peeters, A., Igarza, G., Thomas, C., Hanon, C., & Lacome, M. (2019). Repeated high-intensity effort activity in international male rugby sevens. Journal of Strength and Conditioning Research, Publish Ahead of Print. https://doi.org/https://doi.org/10.1519/jsc.0000000000002986
- Elsworthy, N., Burke, D., & Dascombe, B. J. (2014). Factors relating to the decision-making performance of Australian football officials. International Journal of Performance Analysis in Sport, 14(2), 401–410.
- Elsworthy, N., Burke, D., Scott, B. R., Stevens, C. J., & Dascombe, B. J. (2014b). Physical and decision-making demands of Australian football umpires during competitive matches. Journal of Strength and Conditioning Research, 28(12), 3502–3507. https://doi.org/https://doi.org/10.1519/jsc.0000000000000567
- Emmonds, S., O’Hara, J., Till, K., Jones, B., Brightmore, A., & Cooke, C. (2015). Physiological and movement demands of rugby league referees: Influence on penalty accuracy. Journal of Strength and Conditioning Research, 29(12), 3367–3374. https://doi.org/https://doi.org/10.1519/jsc.0000000000001002
- Gómez Carmona, C. D., & Pino Ortega, J. (2016). Kinematic and physiological analysis of the performance of the football referee and its relationship with decision making. Journal of Human Sport and Exercise, 11(4), 397–414. https://doi.org/https://doi.org/10.14198/jhse.2016.114.01
- Helsen, W., & Bultynck, J. B. (2004). Physical and perceptual-cognitive demands of top-class refereeing in association football. Journal of Sports Sciences, 22(2), 179–189. https://doi.org/https://doi.org/10.1080/02640410310001641502
- Hendricks, S., Sin, D. W., van Niekerk, T., Den Hollander, S., Brown, J., Maree, W., Treu, P., & Lambert, M. (2020). Technical determinants of tackle and ruck performance in International Rugby Sevens. European Journal of Sport Science, 20(7), 868–879. https://doi.org/https://doi.org/10.1080/17461391.2019.1675764
- Johansen, B. T., & Erikstad, M. K. (2020). A preliminary analysis of the importance of distance, angle, and insight when soccer referees make penalty decisions. Frontiers in Sports and Active Living, 2(p), 595703. https://doi.org/https://doi.org/10.3389/fspor.2020.595703
- Lago-Peñas, C., & Gómez-López, M. (2016). The influence of referee bias on extra time in elite soccer matches. Perceptual and Motor Skills, 122(2), 666–677. https://doi.org/https://doi.org/10.1177/0031512516633342
- Larkin, P., O’Brien, B., Mesagno, C., Berry, J., Harvey, J., & Spittle, M. (2014). Assessment of decision-making performance and in-game physical exertion of Australian football umpires. Journal of Sports Sciences, 32(15), 1446–1453. https://doi.org/https://doi.org/10.1080/02640414.2014.896998
- Mallo, J., Gonzalez Frutos, P., Juarez, D., & Navarro, E. (2012). Effect of positioning on the accuracy of decision making of association football top-class referees and assistant referees during competitive matches. Journal of Sports Sciences, 30(13), 1437–1445. https://doi.org/https://doi.org/10.1080/02640414.2012.711485
- Mascarenhas, D., Collins, D., Mortimer, P., & Morris, B. (2005). Training accurate and coherent decision making in rugby union referees. The Sport Psychologist, 19(2), 131–147. https://doi.org/https://doi.org/10.1123/tsp.19.2.131
- Mascarenhas, D., Dicks, O. H., Dicks, O. H., & Dicks, M. (2009). Physical performance and decision making in association football referees: A naturalistic study. The Open Sports Sciences Journal, 2(1), 1–9. https://doi.org/https://doi.org/10.2174/1875399X00902010001
- Mitchell, S., & Tierney, G. (2020). Sanctioning of breakdown infringements during the knockout stage of the 2019 rugby world cup. International Journal of Sports Science & Coaching, 16. https://doi.org/https://doi.org/10.1177/1747954120970922
- Nevill, A. M., Hemingway, A., Greaves, R., Dallaway, A., & Devonport, T. J. (2017). Inconsistency of decision-making, the Achilles heel of referees. Journal of Sports Sciences, 35(22), 2257–2261. https://doi.org/https://doi.org/10.1080/02640414.2016.1265143
- Ollis, S., Macpherson, A., & Collins, D. (2006). Expertise and talent development in rugby refereeing: An ethnographic enquiry. Journal of Sports Sciences, 24(3), 309–322. https://doi.org/https://doi.org/10.1080/17461390500188710
- Pietraszewski, P., Roczniok, R., Maszczyk, A., Grycmann, P., Roleder, T., Stanula, A., Fidos-Czuba, O., & Ponczek, M. (2014, April 9). The elements of executive attention in top soccer referees and assistant referees. Journal of Human Kinetics, 40(1), 235–243. https://doi.org/https://doi.org/10.2478/hukin-2014-0025. PMID: 25031691; PMCID: PMC4096105.
- RFU. (2018). Whistle-stop - positioning. Retrieved December 8, 2020, from https://www.youtube.com/watch?app=desktop&v=EgoVrEpJ8wc
- Riiser, A., Andersen, V., Sæterbakken, A., Ylvisaker, E., & Moe, V. F. (2019). Running performance and position is not related to decision-making accuracy in referees. Sports Medicine, 3(2), E66–E71. https://doi.org/https://doi.org/10.1055/a-0958-8608
- Ross, A., Gill, N., & Cronin, J. (2015). The match demands of international rugby sevens. Journal of Sports Sciences, 33(10), 1035–1041. https://doi.org/https://doi.org/10.1080/02640414.2014.979858
- Sant ‘Anna, R. T., Roberts, S. P., Moore, L. J., Reid, A., & Stokes, K. A. (2020). Rugby union referees’ physical and physiological demands across different competitive levels. The Journal of Sports Medicine and Physical Fitness. https://doi.org/https://doi.org/10.23736/s0022-4707.20.11447-6
- Sant’Anna, R. T., Moore, L. J., Roberts, S. P., & Stokes, K. A. (2019). Rugby union referees’ external and internal load and heart rate responses during a national sevens tournament - BASES Conference 2019 – Programme and abstracts. Journal of Sports Sciences, 37(sup1), 87. https://doi.org/https://doi.org/10.1080/02640414.2019.1671688
- Sant’Anna, R. T., Roberts, S. P., Moore, L. J., & Stokes, K. A. (2019). Physical demands of refereeing rugby sevens matches at different competitive levels. Journal of Strength and Conditioning Research, Publish Ahead of Print. https://doi.org/https://doi.org/10.1080/02640410310001641502
- Suarez-Arrones, L., Calvo-Lluch, Á., Portillo, J., Sánchez, F., & Mendez-Villanueva, A. (2013). Running demands and heart rate response in rugby sevens referees. Journal of Strength and Conditioning Research, 27(6), 1618–1622. https://doi.org/https://doi.org/10.1519/JSC.0b013e3182712755
- Suarez-Arrones, L., Núñez, J., Munguía-Izquierdo, D., Portillo, J., & Mendez-Villanueva, A. (2013). Impact of several matches in a day on physical performance in Rugby Sevens referees. International Journal of Sports Physiology and Performance, 8(5), 496–501. https://doi.org/https://doi.org/10.1123/ijspp.8.5.496
- Tanaka, H., Monahan, K. D., & Seals, D. R. (2001). Age-predicted maximal heart rate revisited. Journal of the American College of Cardiology, 37(1), 153–156. https://doi.org/https://doi.org/10.1016/s0735-1097(00)01054-8
- Van Rooyen, M. K., Diedrick, E., & Noakes, T. D. (2010). Ruck frequency as a predictor of success in the 2007 Rugby World Cup Tournament. International Journal of Performance Analysis in Sport, 10(1), 33–46.
- World Rugby. (2019). Tracking the trends of the modern game. Retrieved December 8, 2020, from https://playerwelfare.worldrugby.org/?documentid=156
- World Rugby. (2020). Laws of the game. Retrieved December 8, 2020, from https://laws.worldrugby.org/