
ABSTRACT
Chaohu lake and its surrounding have received considerable attention in terms of water and sediment pollution investigations. In this study, the trend of changes in four key land uses in the catchment area was examined. Maximum Likelihood Supervised Classification (MLC) in ESRI© ArcGIS was applied to subsets of Landsat MSS, TM, ETM and OLI/TIRS images of 1979 to 2015. The results showed that the water bodies’ position remained relatively stable, while the portions of land used for urban activities and agriculture consistently increased. The built-up areas increased from 3.5% in 1979 to 25.1% in 2015. Similarly, the agricultural land use increased from the area coverage of 29.8% in 1979 to 45.2% in 2015. Forested/vegetated land of the catchment substantially decreased during this period, from 59.8% in 1979 to 22.9% in 2015. Decades of improper land use activities and resource utilisation have led to ecological degradation of the basin which has manifested in serious eutrophication of the lake. The conflict between the economic development and the need to protect the ecosystem of Chaohu catchment has now become a management issue. Deliberate planning should be made to reduce the rate of conversion of the forested land area to agriculture and urban use.
1. Introduction
Land use and land cover (LULC) changes are considered important parameters in measuring or assessing global changes at different spatial and temporal scales (Islam, Jashimuddin, Nath, & Nath, Citation2017). These changes are mostly driven by anthropogenic activities and, on many occasions, these changes directly impact both human and the natural environment (Ruiz-Luna & Berlanga-Robles, Citation2003). Impacts of changes in LULC on both human and natural environments are diverse. For example, the changes influence the composition of the atmosphere and the exchanges of energies and materials (e.g. Kindu, Schneider, Teketay, & Knoke et al., Citation2013), causing biological diversities and contributing to vegetation reduction (e.g. Zeng, Wu, Zhan, & Zhang, Citation2008), soil erosion (e.g. Zha et al., Citation2015), ecosystem services alteration (e.g. Mas et al., Citation2004), and un-sustainability of socio-economic activities and natural resources (Vescovi, Park, & Vlek, Citation2002).
With notable global and local population growth, increasing pressures are daily exerted on limited natural environment and thereby contributing to changes in land use and land cover of the environment (Islam et al., Citation2017). Monitoring land use/land cover changes is very important in the understanding of landscape dynamics at, or between, a period (Rawat & Kumar, Citation2015), the understanding of which are essential in environmental management and wider decision making.
Change in LULC is not static. It is a dynamic and continuous processes (Mondal, Sharma, Garg, & Kappas, Citation2016). Continuous observation of these changes is highly essential in overall environmental and ecosystem services monitoring (e.g. Lal & Anouncia, Citation2015). With the advent of remote sensing and Geographical Information System (GIS) technologies, the monitoring and detection of LULC changes are now made possible at low cost and with better accuracy (Lo & Choi, Citation2004). Remotely sensed data, e.g. Landsat, provides valuable and continuous records of the earth’s landscape for the past four decades, approximately. The archive of these data (Landsat series, especially) is now made freely available to scientific community, and thus serves as a repertoire of information of identifying or monitoring the changes imposed on physical and human environment (Islam et al., Citation2017).
Lake Chaohu and its basin have been the subject of different studies in the last few decades because of its importance as the area of ancient civilisation and current diverse human activities (Li et al., Citation2009; Wu et al., Citation2010). Examples of recent studies on this vital basin include: investigation of the influence of land-use changes on absorbed nitrogen and phosphorus loadings in the basin (Jiang et al., Citation2014); examination of seasonal variation in the microcystin concentration in the lake (Yang et al., Citation2006); phosphorus distribution and heavy metal pollution in the sediments of the lake (Zan et al., Citation2011); assessments of heavy metals in sediment of the urban river systems within the lake (Shao et al., Citation2016); and so on. The conversion of land cover to various land uses are threatening the fragile ecosystems within the basin. In this study, 1979 is considered as the base year to examine the trend of changes in key LULC for over 30 years and the impact of this dynamics on the lake parameters.
2. Study area
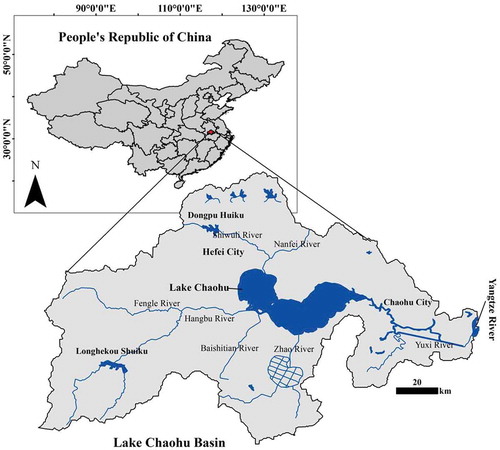
Lake Chaohu in Anhui Province is the fifth largest freshwater lake in China. It is a shallow eutrophic lake located in the lower Yangtze basin with a surface area of 770 km2 at 31°25′–31°43′N, 117°17′–117°51′E () and a mean depth of approximately 3.0m (Jiang et al., Citation2014; Tang et al., Citation2015; Xue, Zhang, Duan, & Ma, Citation2017). This catchment area, 13,350 km2, is characterised by an intermediate of subtropical to warm temperate monsoon climate with an annual mean temperature of 15°C–16.1°C, an annual mean precipitation of 1100mm, and a surface water temperature that varies between 5.2 and 32.6°C (17.3°C in average) (Chen, Yang, Dong, & Liu, Citation2013; Jiang et al., Citation2014; Tang et al., Citation2015; Xue et al., Citation2017). There are eight major inflowing rivers to Lake Chaohu and one outflowing river. These inflowing rivers account for over 80% of the total runoff volume from the catchment area to feed the lake and there is only one outlet (Xue et al., Citation2017). The inflow rivers are Zhegao, Nanfei, Shiwuli, Pai, Fengle, Hangbu, Baishitian and Zhao Rivers while the only outflow is Yuxi River, which is the only channel linking the lake to the Yangtze River (). In the 1950s, the urban population of Lake Chaohu Basin was ca 200,000; however, increasing immigration in the province has led to increase in the population to ca 1.6 million people in 1985; ca. 8 million in 2009 and currently ca 9.1 million (Jiang et al., Citation2014; Xue et al., Citation2017). With changes in human population are changes in land use pattern, and the associated effects.
Figure 1. The Study Area (Inset: Location of Lake Chaohu in China). Source: The data for the map were extracted from the DIVA-GIS database (http://www.diva-gis.org/), ©1995-1998, LizardTech, Inc.
3. Methods
3.1 Data and data preparation
Landsat Satellite data: Multi-Spectral Scanner (MSS), Thematic Mapper (TM), Enhanced Thematic Mapper (ETM) and Operational Land Imager (OLI)—Thermal Infrared Sensor (TIRS) for the year 1979, 1984, 1990, 1995, 2000, 2005, 2010 and 2015 respectively (), sourced from the US Geological Survey (USGS) depository (https://earthexplorer.usgs.gov) were used for land use/cover classification. These imageries were registered in the same projection, the Universal Transverse Mercator (UTM) projection World Geodetic System (WGS) 1984 Zone 50N and the Spectral Bands Green (0.5–0.6 µm), Red (0.6–0.7 µm) and Near Infrared (0.8–1.1 µm) as composite images were used for the classification. Landsat images are known to be very vital in the classification of different landscape categories and components at larger scale (Butt, Shabbir, Ahmad, & Aziz, Citation2015).
Table 1. Specification of the Landsat data analysed.
3.2 Image classification
In LULC, image classification is the mostly used conventional land use change observation and detection method because of its ability to create series of land cover maps (El Garouani, Mulla, El Garouani, & Knight, Citation2017). The Maximum Likelihood Classification (MLC) supervised method in ArcGIS was applied to classify the series of Landsat bands for the 35 years under study, after the images have been pre-processed, geo-referenced, mosaicking and sub-setting to the Area of Interest (AoI). MLC is based on the likelihood of a pixel (Picture element) belonging to a class, with the assumption (in theory) that this likelihood is equal for all classes, that the input bands are evenly and uniformly distributed (El Garouani et al., Citation2017). The steps taken for image classification involved the creation of training samples, as polygons, for each of the observed four (4) classes from the colour composite images through the on-screen digitisation of the thematic classes. The delineated classes were water, built-up/settlement areas, vegetation and agriculture/agricultural lands (). The training sample polygons, after delimitation around the representative of respective land cover types, were derived from each of the imageries (from 1979 to 2015), saved as separate signature files (.sig extension) and applied on the images for the supervised classification in ArcGIS’s MLC. This approach has been the most widely used in LULC change assessment with greater acceptable accuracies (e.g. Butt et al., Citation2015; El Garouani et al., Citation2017; Islam et al., Citation2017; etc.). It works on the basis that a satisfactory spectral significance is the one with “minimal confusion” from the land covers being mapped (Butt et al., Citation2015).
Table 2. Classes delineated based on supervised classification.
3.3 Accuracy assessment
The generated classified land use maps were verified using the Google Earth images of December 1984 (for 1979, being the oldest historical images in Google Earth for the area) and those closest to the dates of Landsat Image acquisition () respectively. An accuracy assessment for the classified images was done in ArcGIS 10.2. From the classifier, several reference points were generated randomly for each supervised image using the nearest Google Earth map for each of the image year as Ground Truth value, respectively. The randomly generated points were identified and assigned different classes as Ground Truth values based on the Google Earth maps. The correctly identified points in Google Earth Maps were considered as the classified values used for Confusion/Error Matrix and Kappa statistics generated in ArcGIS and processed in Microsoft Excel spreadsheet.
The confusion (error) matrix analysed for accuracy assessment in this study makes it easier to visualise the performance of the accuracy assessment. Here, Users’ Accuracy, Producers’ Accuracy, Overall Accuracy and Kappa Co-efficient, arising from error matrix analyses, are reported. The overall accuracy for the image classification was obtained by dividing the sum of the entries in the “from-to” agreement of the confusion matrix with the total number of the examined pixels in the classification (Islam et al., Citation2017). Kappa co-efficient, a nonparametric statistic which describes the relationship between categories of variables not only for the diagonal elements (Rossiter, Citation2014) but also for all the elements in the confusion matrix (Butt et al., Citation2015), was also calculated to assess the level of agreement among the data values generated in the image classification, using the Kappa co-efficient equation of Afify (Citation2011:190).
4. Results and discussion
4.1 Land use change analysis
The classified land use maps of Chaohu Lake basin from the year 1979 to 2015 are presented in . The figure presents the aerial distribution of the land use categories for the years under consideration, at approximate five-year interval. A total of four classes were produced for each of the images (water, built-up areas/settlements, vegetation and agriculture/agricultural land). The outputs for classification of images were compared in terms of the total area for each land use category. As presented in and and , the land use classes that has consistently increased are built-up areas and agricultural land respectively, at the detriment of vegetated (uncultivated land areas). Of all the land use categories, built-up areas (see for definitions) increased from 3.5% of the total area of the basin (area of 477.15 km2) to ~6.6% in 1984, 7.5% in 1990, ~7.0% in 1995, 18.9% in 2000, 24.1% in 2005, 24.9% in 2010 and 25.1% in 2015 respectively (, ). This is followed by land used for agricultural purposes, with a total coverage area of 29.8% (area of 3974.58 km2) in 1979 to 52.4% in 1984, reduced to 42.3% in 1990 before increasing to 65.3% in 1995, 47.6% in 2000, 48% in 2005, 46.1% in 2010 and 45.2% in 2015 respectively (). The substantial increase of these two categories of land use was made possible by the probable conversion of forested/highly vegetated areas for these other uses within the basin. In 1979, the uncultivated vegetated/forested areas of the basin stood at 59.8% but this was decreased to 34.1% in 1984, then a slight increase of 43.8% in 1990 before resumption of the downward trend in 1995 at 21.3%, in 2000 at 26.6%, in 2005 at 21.3%, in 2010 at 22.1% and 22.9% in 2015 respectively (). Water system (Riverine classes) remained relatively constant through the temporal period considered here.
Table 3. Land-cover classes and area represented by each class in square kilometres.
Figure 2. Classified maps of Lake Chaohu basin from 1979 to 2015. (Images are classified from Landsat Satellite data sourced from the US Geological Survey (USGS) depository (https://earthexplorer.usgs.gov.) The shapefile used for area extraction was from the DIVA-GIS database (http://www.diva-gis.org/) ©1995-1998, LizardTech, Inc.”)
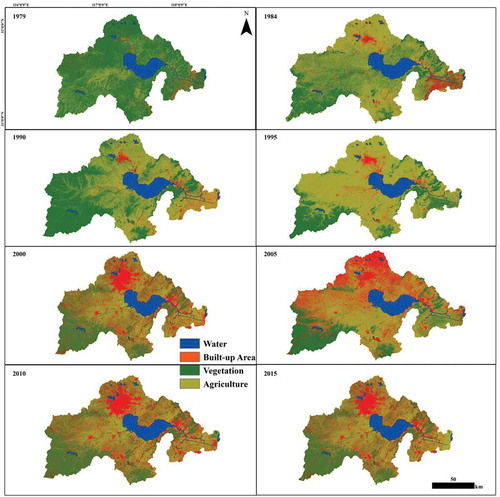
Figure 3. Yearly percentages of four land use cover at Lake Chaohu Basin.
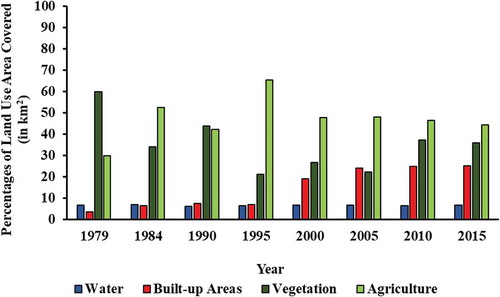
Overall, uncultivated vegetation land shrank considerably at 36.88% between 1979 and 2015 while there was increase of 15.45% (representing 2062.58 km2 of the basin) in the areas occupied by land cultivated for agricultural purpose and 21.69% (representing 2895.62 km2 of the basin) developed for settlements and other urban land uses. The increasing trend of these two classes of land use within this watershed basin is an indication that economic advancement () in, and probable population migration () to, the area have accounted for the induced anthropogenic influence on the land use in the basin. Encroaching into vegetated land by agriculture practices and the need for urban expansion are some of the driving force for land use changes in watershed areas (Butt et al., Citation2015). Development and construction of new housing schemes, farmhouses, roads, bridges, pavements, recreational facilities and other structures are the main reasons which caused the land area classified as built-up areas in the images to have increased from 477.15 km2 in 1979 to 3362.97km2 in 2015, an increase of 21.69%.
Figure 4. Yearly gross domestic product for Hefei and Chaohu (the main cities within Lake Chaohu Basin). Data source: https://www.ceicdata.com/en/china/gross-domestic-product
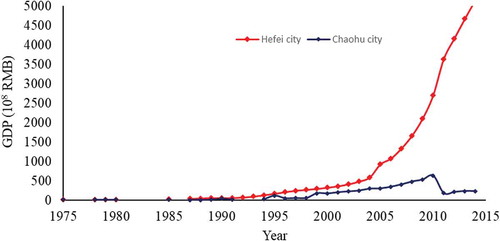
Figure 5. Yearly population at Hefei and Chaohu cities (the main cities at Lake Chaohu Basin). Data source: http://population.city/china/hefei/ http://population.city/china/chaohu/
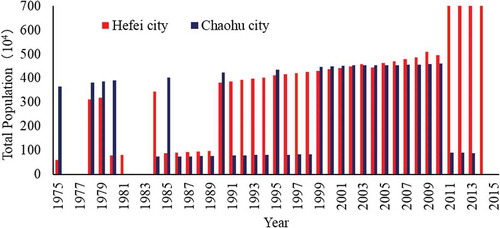
Easy accessibility to the water in the basin (e.g. to streams, rivers and the lake) for agricultural purposes and the increasing demand for food for the growing population () have, directly and indirectly, caused the land being use for agricultural purposes to increase in the basin within the last four decades. However, this has led to the depletion of uncultivated vegetated land and minor reduction of many streams output and the dried up of few river tributaries. The riverine system within the basin was very stable during the decades investigated in this study.
4.2 Overall accuracy and Kappa (k^) statistics for 1979 to 2015 supervised classification
For the supervised classification of 1979 to 2015 images, the overall accuracies were 87% (1979), 86% (1984), 86% (1990), 82% (1995), 85% (2000), 86% (2005), 82% (2010) and 81% (2015) respectively while the Kappa statistics were 0.869 (1979), 0.860 (1984), 0.866 (1990), 0.819 (1995), 0.851 (2000), 0.868 (2005), 0.825 (2010) and 0.831 (2015) for the images respectively (). Kappa statistics here measured the identified classification of the remotely sensed images and the ground truth referenced data, and this is used here to check the accuracy of the classification measured. A Kappa value of between 0.81 and 1.00 is an indication of almost perfect or perfect classification between the two measurements in the classification system (Islam et al., Citation2017). Thus, producer’s accuracies and user’s accuracies for each of the classes classified in this process as well as the overall accuracy and the Kappa value for the images are satisfactory, suggesting that the land use classification in this analysis is good enough to detect the changing scenarios of Lake Chaohu basin.
Table 4. Accuracies and Kappa Statistics of the supervised land use classification of Lake Chaohu Basin.
PA*—Producer’s Accuracy; UC: User’s Accuracy.
4.3 Evidence and influence of land use change on Lake Chaohu
Evidence of consistent trend of growth in built-up areas (urbanisation) and agricultural intensification in Lake Chaohu basin for the past four decades have significantly deteriorated the environmental conditions of the lake and its watershed. The importance of the basin’s water resources to the 9.1 million inhabitants are evidenced on their total and heavy dependence on the lake as the primary source of domestic water usage (Qin et al., Citation2013) and irrigation (Cui, Huang, Chen, & Morse, Citation2009). The land use pattern in the basin has changed considerably because of the increasing development of agriculture, of diverse industries and increasing buildings for urban settlements (, ). In addition, the basin has been characterised with the conversion of vegetated land to urban and industrial uses (built-up areas) in the recent decades (Huang, Zhan, Yan, Wu, & Denga, Citation2013; Jiang et al., Citation2014).
The ecological environment in Lake Chaohu Basins is very fragile. Decades of improper land use activities and resource utilisation have led to ecological degradation of the basin which are manifested in serious eutrophication of the lake, resulting from increasing anthropogenic inputs from the lake’s watershed (Jiang et al., Citation2014; Wang, Zhang, & Liang, Citation2012; Xue et al., Citation2017; Zan et al., Citation2012). The continuous utilisation of fertilisers for agricultural practises, the development and advancement of industrial/urban areas are,also, evidence of increasing anthropogenic influences in the basin (Zan et al., Citation2011).
Although the central government through the Ministry of Environmental Protection of People’s Republic of China and other local governments have set up many pollution control measures for the lake, Chaohu has remained one of the most eutrophicated lakes in China (Wang et al., Citation2012) because of the continuous discharge of municipal and industrial wastewater, domestic wastewater, agricultural fertilisers and soil erosion (Song, Wu, & Jin, Citation2008), which are direct results of increasing trend of urbanisation in the basin. Widespread incidence of linear alkylbenzenes (LABs) in sampled sediments from Chaohu is an indication of the domestic sewage from Hefei, the rapidly growing urban city within the Chaohu Lake catchment basin (see Wang et al., Citation2012).
In the early 1980s when eutrophication began to occur in Chaohu Lake, the heavy metals within the sediments and pore water were relatively low (Tu et al., Citation1990). However, with increasing and extensive farming activities (post 1980s: (,)), ()), many toxic metals in the sediments started showing continuous increases within the Chaohu Lake catchment in the last three decades (e.g. Wen, Shan, & Zhang, Citation2012; Zan et al., Citation2011) thereby severely contaminating both the sediments and pore water (e.g. Huang et al., Citation2013; Qin et al., Citation2014). Similarly, input from increasing industrial and domestic wastewater arising from the increasing built-up areas have resulted in high metal toxic contents of the estuarine systems of Nanfei and Zhegao Rivers and other parts of the Chaohu catchment basin (Wen et al., Citation2012). Changing land use, climate and geology of Chaohu basin play important roles in the transportation of nutrients and sediments from the basin areas to the network of streams/rivers in, and eventually, to the Lake, causing increasing absorption of nutrients (e.g. nitrogen and phosphorus) in the catchment (e.g. Jiang et al., Citation2014).
The rapid economic development of the last three decades, with astronomical increase in Gross Domestic Product (GDP) of Hefei and Chaohu cities (the two main cities within the basin, ) and strong population growth because of in-migration () are the two major evidences of anthropogenic presence in Chaohu catchment. The anthropogenic disturbances (such as built-up area sewages, aquiculture, fertiliser usages, nutrients inputs, etc.) have imposed hydrological alterations and promoted the increase of eutrophic species in the lake ecosystem (e.g. Chen et al., Citation2013). Conflict between the economic development and the need to protect the ecosystem of Chaohu catchment has now become a management issue. This demands a kind of constructed wetland modelling procedure whereby catchment systems protection and economic management can be modelled and coupled (e.g. Ni, Xu, & Zhang, Citation2018) to prevent the continuous negative impacts of the land use and land cover changes in Chaohu Lake basin.
5. Conclusion and recommendation
With continuous and increasing modifications of land use configuration within Chaohu Lake basin is the significant contamination of the water and sediment systems of the basin and the lake from the release of pollutants from municipal sewage and agricultural activities in the basin. This present study has shown that uncultivated vegetated land use in this basin is giving way to advancement and expansion of urban and agricultural land uses. Whereas the sewages and pollutants from these increasing land uses continue to be responsible for the pollution of Chaohu lake, one of the most polluted lakes in China. There is, therefore, the need to establish increasing sewage treatment capacity within the basin to be able to accommodate the increasing sewages that are continuously being generated from increasing urban and agricultural activities. In addition to this, there is the need for the diversification of land uses to limit the influence of agricultural pollution on the water and sediment quality. Deliberate planning and efforts should be made to reduce the rate of conversion of forested (vegetated) land area to agriculture and urban use in the basin. Diffuse flux of heavy metals on sediments and water in Chaohu lake should be seriously considered because of the health implication these metals will have on the ever-increasing population depending on the lake as a drinking water source. Socio-economic, demographic, cultural and other anthropogenic variables are very vital in the exploration of morphodynamics in a watershed basin, as these variables are highly related to the land use and land cover changes. Further investigation along this line is hereby recommended.
Disclosure statement
No potential conflict of interest was reported by the author.
References
- Afify, H. A. (2011). Evaluation of change detection techniques for monitoring landcover changes: A case study in new burg El-Arab area. Alexandria Engineering Journal, 50(2), 187–195. doi:10.1016/j.aej.2011.06.001
- Butt, A., Shabbir, R., Ahmad, S. S., & Aziz, N. (2015). Land use change mapping and analysis using remote sensing and GIS: A case study of Simly watershed, Islamabad, Pakistan. The Egyptian Journal of Remote Sensing and Space Sciences, 18, 251–259.
- Chen, X., Yang, X., Dong, X., & Liu, E. (2013). Environmental changes in Chaohu Lake (southeast, China) since the mid 20th century: The interactive impacts of nutrients, hydrology and climate. Limnologica, 43, 10–17.
- Cui, X., Huang, G., Chen, W., & Morse, A. (2009). Threat of climate change on water resources and supply: Case study of north China. Desalination, 248, 476–478.
- El Garouani, A., Mulla, D. J., El Garouani, S., & Knight, J. (2017). Analysis of urban growth and sprawl from remote sensing data: Case of fez, morocco. International Journal of Sustainable Built Environment, 6, 160–169.
- Huang, J., Zhan, J., Yan, H., Wu, F., & Denga, W. (2013). Evaluation of the impacts of land use on water quality: A case study in the chaohu lake basin. The Scientific World Journal, Article ID 329187, 1–7. doi:10.1155/2013/329187
- Islam, K., Jashimuddin, M., Nath, B., & Nath, T. K. (2017). Land use classification and change detection by using multi-temporal remotely sensed imagery: The case of chunati wildlife sanctuary, Bangladesh. The Egyptian Journal of Remote Sensing and Space Sciences, in press. doi:10.1016/j.ejrs.2016.12.005.
- Jiang, T., Hou, S., Xi, B., Su, J., Hou, H., Yu, H., & Li, X. (2014). The influences of land-use changes on the absorbed nitrogen and phosphorus loadings in the drainage basin of lake Chaohu, China. Environment Earth Sciences, 71, 4165–4176.
- Kindu, M., Schneider, T., Teketay, D., Knoke, T., et al. (2013). Land use/land cover change analysis using object-based classification approach in Munessa-Shashemene landscape of the Ethiopian highlands. Remote Sens, 5, 2411–2435.
- Lal, A. M., & Anouncia, M. S. (2015). Semi-supervised change detection approach combining sparse fusion and constrained k means for multi-temporal remote sensing images. The Egyptian Journal of Remote Sensing and Space Sciences, 18, 279–288.
- Li, Y., Zhou, G., Liang, T., Wu, L., & Liu, W. (2009). Study of land use change on the gains and losses of ecosystem service function values of Chaohu lake basin. Geographical Research, 28(6), 1656–1664.
- Lo, C. P., & Choi, J. (2004). A hybrid approach to urban land use/cover mapping using Landsat 7 enhanced thematic mapper plus (ETM+) images. International Journal of Remote Sensing, 25(14), 2687–2700.
- Mas, J.-F., Velázquez, A., Díaz-Gallegos, J. R., Mayorga-Saucedo, R., Alcántara, C., Bocco, G., … Pérez-Vega, A. (2004). Assessing land use/cover changes: A nationwide multidate spatial database for Mexico. International Journal Applications Earth Obs Geoinf, 5, 249–261.
- Mondal, M. S., Sharma, N., Garg, P. K., & Kappas, M. (2016). Statistical independence test and validation of CA Markov land use land cover (LULC) prediction results. The Egyptian Journal of Remote Sensing and Space Sciences, 19, 259–272.
- Ni, J., Xu, J., & Zhang, M. (2018). Constructed wetland modelling for watershed ecosystem protection under a certain economic load: A case study at the Chaohu Lake watershed, China. Ecological Modelling, 368, 180–190.
- Qin, N., He, W., Kong, X.-Z., Liu, W.-X., He, Q.-S., Yang, B., … Xu, F.-L. (2013). Atmospheric partitioning and the air–Water exchange of polycyclic aromatic hydrocarbons in a large shallow Chinese lake (Lake Chaohu). Chemosphere, 93, 1685–1693.
- Qin, N., He, W., Kong, X.-Z., Liu, W.-X., He, Q.-S., Yang, B., … Zhao, X.-L. (2014). Distribution, partitioning and sources of polycyclic aromatic hydrocarbons in the water–SPM–Sediment system of Lake Chaohu, China. Science of the Total Environment, 496, 414–423.
- Rawat, J. S., & Kumar, M. (2015). Monitoring land use/cover change using remote sensing and GIS techniques: A case study of Hawalbagh block, district Almora, Uttarakhand, India. The Egyptian Journal of Remote Sensing and Space Sciences, 18, 77–84.
- Rossiter, D. G. (2014). Technical Note: Statistical methods for accuracy assessment of classified thematic maps. Enschede, Netherlands: University of Twente, Faculty of Geo-Information Science & Earth Observation (ITC).
- Ruiz-Luna, A., & Berlanga-Robles, C. A. (2003). Land use, land cover changes and costal lagoon surface reduction associated with urban growth in northwest Mexico. Land Ecology, 18, 159–171.
- Shao, S., Xue, L., Liu, C., Shang, J., Wang, Z., He, X., & Fan, C. (2016). Assessment of heavy metals in sediment in a heavily polluted urban river in the Chaohu Basin, China. Chinese Journal of Oceanology and Limnology, 34(3), 526–538.
- Song, R.-P., Wu, K.-Y., & Jin, J.-L. (2008). Analysis on the causes of water security and their preventive countermeasures in Chaohu Basin. ResourSoil Water Conserv (In Chinese), 15, 162–165.
- Tang, J., Shi, T., Wu, X., Cao, H., Li, X., Hua, R., … Yue, Y. (2015). The occurrence and distribution of antibiotics in Lake Chaohu, China: Seasonal variation, potential source and risk assessment. Chemosphere, 122, 154–161.
- Tu, Q., Gu, D., Yin, C., Xu, Z., & Han, J. (1990). A series researches on Lakes of China - the Chaohu lake study on Eutrophication (pp. 158). Hefei: University of Science and Technology of China Press.
- Vescovi, F. D., Park, S. J., & Vlek, P. L. (2002). Detection of human-induced land cover changes in a savannah landscape in Ghana: I. Change detection and quantification. In 2nd workshop of the earsel special interest group on remote sensing for developing countries. Bonn, Germany.
- Wang, J.-H., Zhang, K., & Liang, B. (2012). Tracing urban sewage pollution in Chaohu Lake (China) using linear alkylbenzenes (LABs) as a molecular marker. Science of the Total Environment, 414, 356–363.
- Wen, S., Shan, B., & Zhang, H. (2012). Metals in sediment/pore water in Chaohu Lake: Distribution, trends and flux. Journal of Environmental Sciences, 24(12), 2041–2050.
- Wu, L., Wang, X., Zhou, K., Mo, D., Zhu, C., Gao, C., … Han, W. (2010). Transmutation of ancient settlements and environmental changes between 6000-2000 aBP in the Chaohu Lake Basin. Eastern China Journal Geographic Sciences, 20(5), 687–700.
- Xue, K., Zhang, Y., Duan, H., & Ma, R. (2017). Variability of light absorption properties in optically complex inland waters of Lake Chaohu, China. Journal of Great Lakes Research, 43, 17–31.
- Yang, H., Xie, P., Xu, J., Zheng, L., Deng, D., Zhou, Q., & Wu, S. (2006). Seasonal variation of microcystin concentration in lake chaohu, a shallow subtropical lake in the people’s republic of China. Bull. Environment Contamination Toxicogical, 77, 367–374.
- Zan, F. Y., Huo, S. L., Xi, B. D., Li, Q. Q., Liao, H. Q., & Zhang, J. T. (2011). Phosphorus distribution in the sediments of a shallow eutrophic lake, Lake Chaohu, China. Environment Earth Sciences, 62(8), 1643–1653.
- Zan, F. Y., Huo, S. L., Xi, B. D., Liao, H. Q., Zhang, J. T., & Yeager, K. M. (2012). A 100-year sedimentary record of natural and anthropogenic impacts on a shallow eutrophic lake, Lake Chaohu. China Journal Environment Monitoring, 14(3), 804–816.
- Zeng, Y. N., Wu, G. P., Zhan, F. B., & Zhang, H. H. (2008). Modeling spatial land use pattern using autologistic regression. The International Archives of the Photogrammetry, Remote Sensing and Spatial Information Sciences, XXXVII, 115–118.
- Zha, L., Deng, G., & Gujia, J. (2015). Dynamic changes of soil erosion in the chaohu watershed from 1992 to 2013 (in chinese with english abstract). Journal of Geography, 70(11), 1708-1719.