
ABSTRACT
Soil surveying and mapping is an important operation in soil science, and characterization of their properties is a key step in understanding soil quality . This study was undertaken to investigate the spatial variability of selected soil properties, such as soil pH, electrical conductivity (EC1:5), carbonate content (CaCO3) and total organic matter (TOM) and soil texture using different conventional analytical methods. Spatial distribution of these soil properties was elaborated by using the kriging method. The obtained results showed that the soil is alkaline, soil pH ranges from 7.20 to 8.78. TOM varies from 0.11 to 1.05 dS/m, and its texture varied from sand to loam content. Nonetheless, EC values fall within the slight, moderate and strong degrees of salinity. According to these results, it can be concluded that the soil is saline. Interrelationships between the parameters analyzed and the different samples were investigated by multivariate analyses, principal component analysis (PCA), and hierarchical cluster analyses (HCA). HCA classified the five groups, which were compared to PCA visualizations. The Box-plots show that the values fractions (sand, silt, clay) were very variable. Pearson correlation coefficient indicates a high correlation between carbonate content and pH, organic matter and silt fraction
1. Introduction
The degradation of the soil in the world increased in the last sixty years, in the North as in the South, caused by the growth of the demographic populations and by the industrial expansion (Brabant, Bied-Charreton, & Schnepf, Citation2010). The world evaluation of the anthropic degradation of soils, Global Assessment of Human-induced Soil Degradation (GLASOD) revealed that 15% of the soils of planet are touched (Sommet Mondial de l’Alimentation, Citation1996). The knowledge of soil properties spatial variability is very important in agronomic, pedological, and environmental studies. Studies on these spatial variability of soil properties are of great importance for enhancing the accuracy of soil surveys and mapping and providing useful information for fertilization, soil quality, and other applications to soils (Biswas & Paul, Citation2012; Sivarajan, Nagarajan, & Sivasamy, Citation2013; Tunçay, Bayramin, Tercan, & Ünver, Citation2013; Wang, Zuo, & Zhang, Citation2008; Zucco, Brocca, Moramarco, & Morbidelli, Citation2014). According to the soil scientists, the soil properties vary in space, and in time (Trangmar, Yost, & Uehara, Citation1986; Warrick, Myers, & Nielsen, Citation1986). These temporal and spatial variations are the results of complex interaction between several physical, chemical, biological, anthropogenic, topographical, and climatic factors (Gaston, Locke, Zablotowicz, & Reddy, Citation2001; Mzuku et al., Citation2005; Zhang, Wang, & Wang, Citation2002).
Soil spatial and temporal variability results from a combination of intrinsic and extrinsic factors of soil. Intrinsic spatial variability is linked to natural variations in soil characteristics, which is also related to soil-formation processes. Extrinsic spatial variability is linked to the variations caused by management practices such as chemical application, tillage and irrigation (Rao & Wagenet, Citation1985). Generally, the farming practices affect the physical, mineral, biological properties of soil. Variations in soil characteristics, which occur depending on both agricultural management practices and soil formation processes, have a significant impact on agricultural products due to their potential to limit the agricultural production (Sciarretta & Trematerra, Citation2014). Thereby, in agricultural area, the information obtained from the interaction between soil attributes and the spatial changes of these attributes can bring significant contributions to the planning productive management applications and to sustainable environmental quality (Akbas, Citation2014).
In cultivated areas, soil fertility is an important indicator of quality in sustainable agricultural production, the information obtained about physical, chemical, and biological characteristics of the soil can lead to considerable information related to the present agricultural productivity and sustainable agricultural productivity in future. Generally, agricultural production and soil fertility are substantially influenced by many factors including soil physical and chemical properties, soil texture and soil structure, nutrient availability, available water in soil, soil depth, amounts of fertilizers, and pesticides (Hanks & Ritchie, Citation1991; Wibawa, Duduzile, Swenson, Hopkins, & Dahnke, Citation1993). Moreover, in arid and semiarid areas, major soil processes that affect agricultural productivity are salinity and soil pollution (Wallender & Tanji, Citation2011).
The use of saline water for irrigation generates the risk of salt accumulation in the root zone and affects damage to crop production and soil fertility (Läuchli & Epstein, Citation1990; Maas, Citation1986). The salt accumulation process can also be caused by other factors, such as elevation of shallow groundwater and/or sea water intrusion in coastal areas (Chhabra, Citation1996).
Generally, salt affected soils occur predominantly in semi-arid regions, where rainfall is insufficient to leach salts from the root zone. According to several parameters such as pH, Sodium absorption ratio (SAR) and electrical conductivity, these soils are classified in saline, sodic and saline-sodic (Brady & Weil, Citation2008). In saline soils, high salt concentration in the soil solution reduces water and nutrient uptake by plants (Harris, Citation1981, Keren, Citation2000). In sodic soils, sodium (Na+) is the dominant cation on the exchange sites of the soil causing dispersion of organic matter and clay particles. The dispersed clay particles can clog pores cause decreasing of the water infiltration, permeability and reduced plant growth (Qadir & Schubert, Citation2002; Sumner, Citation1993).
In Morocco, the irrigation sector, holds a very important place in the national economy and is facing problems that treating sustainable agricultural development. The intensification of agriculture was often accompanied by an uncontrolled and excessive irrigation mineral fertilize. Theses can have a negative impact on the quality of water resources and soil (El Baghdadi et al., Citation2012; Aghzar, Berdai, Bellouti, & Soudi, Citation2002).
Irrigated perimeter of Tadla is one of the largest irrigated perimeter areas in Morocco and is characterized by the intense activity of the soil.
The Tadla perimeter is located in the semi-arid zone and divided by the Oum R’bia River into two large irrigated perimeters: Beni-Amir in the North and Beni-Moussa in the South. The Beni-Amir perimeter is characterized by large hydric capacities and urban activities and agricultural. These characteristics make the perimeter sensitive and vulnerable to various types of pollutions (industrial, urban and agricultural), which increases day to day. The Beni-Amir perimeter was subject of several agricultural and agrochemical technical treatments (fertilizers, phytosanitary treatments). Biggest problem of polluting effect was the main reason to study this part of the Tadla perimeter, which has an importance agricultural of region.
The intensive using of agriculture activities at the irrigated perimeter of the Beni-Amir carried on degradation of soil quality. In addition, This perimeter is irrigated by the very salty waters of the Oum R’bia River (Dakak et al., Citation2011, Faouzi & Larabi, Citation2001).The Regional Office of Agricultural Development of Tadla, installed a network of the soil and groundwater monitoring. Soil samples had chosen on the basis of the spatial representativeness in the perimeter the main hydrogeological variants and the main soil types (Bellouti et al., Citation2002). However, several studies have been conducted in the Tadla plain, on water, on soil and on sediment, to determine the origin of this degradation (El Baghdadi, Jakani, Barakat, & Bay, Citation2011; Barakat, El Baghdadi, Rais, & Nadem, Citation2012).
In Beni Amir region, most of the farmers follow indiscriminate usage of inorganic fertilizer and synthetic pesticides which leads to enhance ecological imbalance, soil salinity, and hazards to human health (Rapheal & Adebayo, Citation2011; Reddy, Satpathy, & Dhiviya, Citation2013). However, excessive usage threatens to the groundwater quality and soil health on a large scale. However, excessive use threatens soil and groundwater quality on a large scale. Therefore, proper investigation of soil properties and their spatial variability are of vital importance.
Geostatistics provides a set of statistical tools for incorporating the spatial coordinates of soil observations in data processing since the 1960s (Davies & Gamm, Citation1970), allowing for description and modeling of spatial patterns, prediction at unsampled locations, and assessment of the uncertainty attached to these predictions. In soil science, since the publication of the first applications of geostatistics in the early 1980s (Burgess & Webster, Citation1980a; Webster & Burgess, Citation1980), geostatistical methods have become popular, due to the popularity of kriging technique and their implementation in geographic information systems (GIS) (Douaik, Van Meirvenne, & Tóth, Citation2005; Goovaerts, Rossel, & McBratney, Citation2002; Pebesma, Citation2004; Sinowski & Auerswald, Citation1999; Webster & Burgess, Citation1980). The classification and kriging techniques are the most used for soil surveying (Cattle, McBratney, & Minasny, Citation2002; Robinson & Metternicht, Citation2006). However, these techniques have been extensively used for generating maps of soil properties.
This paper aims at providing soil scientists with a small applied introduction to basic geostatistical tools such as the kriging techniques. Thus, multivariate statistical approaches such as, principal component analysis (PCA) (Brejda, Karlen, Smith, & Allan, Citation2000; Dolédec & Chessel, Citation1987), hierarchical cluster analyses (HCA) and Pearson correlation coefficient, have been used to assess the physical and chemical attributes of soil.
The interpretation of these data offers a proper understanding of soil quality and draws significant conclusions, that interests soil scientists recently (Hillel, Citation1991; Nourzadeh, Mahdian, Malakouti, & Khavazi, Citation2012; Simeonov et al., Citation2003; Singh, Malik, Mohan, & Sinha, Citation2004; Wälder, Wälder, Rinklebe, & Menz, Citation2008; Winderlin et al., Citation2001) and which can result in a more sustainable agricultural use of areas now and in future. Likewise, in literature, it has been stated in many international studies that spatial variability is used as a method for evaluating soil data (Erşahin & Karaman, Citation2000; Shange, Ankumah, Githinji, & Zabawa, Citation2012; Shukla, Lal, & Ebinger, Citation2006).
The purpose of this study, which was carried out on the agricultural soils of the Beni-Amir area, was to (1) determine physicochemical properties of soil in agricultural area where irrigation farming takes place, (2) find out the spatial variabilities of some parameters (pH, EC, CaCO3, MO) creating the maps of spatial distribution by using the geographic information systems (GIS) and (3) evaluate soil quality status in surface using the maps of spatial distribution created and multivariate statistical approaches.
2. Materials and methods
2.1 Study area
The Tadla plain is a vast synclinal located in central Morocco, with altitude of 400 m and limited in the north by the Plateau of Phosphates, in the south by the High Atlas of Beni-Mellal and in the west by the Tassaout area. This plain is traversed by approximately 160 Km of the Oum R’bia River, which divides it into two large irrigated perimeters with different hydraulic characters: Beni-Amir in the North and Beni-Moussa in the South. These perimeters are characterized by the irrigated surfaces of 33 000 ha and 69 500 ha, respectively (Hammoumi, Sinan, Lekhlif, & Lakhdar, Citation2013).
The plain of Tadla is characterized by semi-arid continental climate with annual average temperature about 19°C and annual precipitation varies from 400 mm/year in the north of the plain to 600 mm/year in the south (The Atlas Mountains).
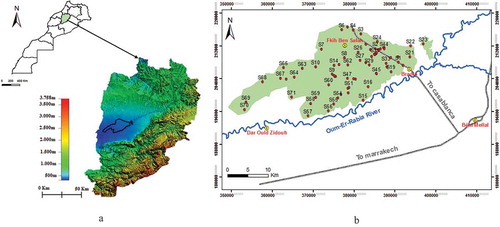
The Tadla basin is attached to the Mesetian domain of central Morocco and presents a synclinal morphology filled by the sedimentary deposits which mainly composed of limestone, marls and sandstone and presented an age of the Palaeozoic to Quaternary (Bouchaou et al., Citation2009). Our study area is focused on Béni-Amir zone (, )).
Figure 1. (a) Location the study area. (b) Location the study area and sampling stations.
2.2 Soil sampling
A total of 71 ()) soil samples were taken to laboratory for preceding the analyses. Soil samples were spread on trays and were air dried at ambient conditions for two weeks, homogenized, and passed through 2 mm mesh sieve (NF ISO 11464, Citation2006) and stored in poly-ethylene bags at ambient temperature before analysis of soil properties and concentrations of heavy metals. The soil properties of these sites (Beni-Amir area) were evaluated for pH, conductivity and organic matter.
2.3 Analytical methods
To obtain the soil properties we determine for each sample: (i) particle size analysis; (ii) % of organic matter content (OM); (iii) % of carbonates content (CaCO3); (iv) electrical conductivity (EC) (dS/m); (v) pH. These properties were measured following standard techniques.
The soil texture (sand, slit, clay) determined according to the international method of Robinson, standard AFNOR NF X31-107 using sodium hexametaphosphate for particles dispersion. This method is based on the difference in sedimentation velocity between small particles and larger, after the destruction of carbonates and organic matter.
The soil pH was measured in a suspension of 25 mL de-ionized water to 10 g of soil (1/2.5 soil to water ratio (w/v)) after shaking for 1 hour. the soil Conductivity (1/5) was determined in a 1/5 (v/v) soil/water distilled, slurry using 10 g soil and 50 ml water and shaken for 30 mn. Samples were shaken for 1 hour to obtain a balance between the solid phase and the liquid phase and allowed to settle for 2 hours prior to analysis. The soil pH and CE were measured using a Thermo Scientific Orion 4-Star Plus pH/Conductivity Meter.
The total organic matter (TOM) and the carbonate content (CaCO3) were analyzed by the thermolyne furnace 6000°C for 4 hours at 550 °C and 2 hours at 930 °C, respectively.
Data treatment and multivariate statistical methods kriging method
In this study, the spatial distribution maps of some parameters, such as (TOM, CE and CaCO3) were obtained using kriging method. The Kriging method is interpolation methods proposed by Krige (Citation1978)(Isaaks & Srivastava, Citation1989) that allow taking into consideration the spatial continuity of the points (vector). The mapping procedure started by sampling the soil with samples indicates point (shape file). The results of these samples were converted to raster through interpolation using Ordinary kriging (Mueller et al., Citation2004) in Arc-GIS Software Geostatistical Analyst Extension. The Ordinary krigingis the most appropriate methods in the modeling. In our study, this method was performed with a prediction set of 71 data points.
2.4. Multivariate statistical analysis
Cluster analysis is the name given to an set of techniques, which provides an graphical display (dendrogram) easy to undersand of variables. It’s a method used frequently in the geological sciences to help classify or group variables of a data set as homogeneous groups (Qmode) (Davies & Gamm, Citation1970). It helps to reduce the size of the samples/variables into smaller numbers of groups.
The multivariate statistical techniques such as: principal component analysis (PCA) and hierarchical cluster analyses (HCA) were applied to the data for drawing meaningful information. All mathematical and statistical computations were made using Excel (version 2010) and XL-Stat software (version 2013).
The application of different statistical approaches (PCA and HCA) for the interpretation of these data offers a proper understanding of soil quality. Due to the existence of different factors, that could affect the soil quality, these methods were applied to the physico-chemical data in order to study the able variables parameters of the soil in study area.
These statistical approaches (PCA and HCA) are based on data matrix (71 × 7); whose rows are the different soil samples analyzed and whose columns correspond to the different parameters.
PCA was applied to examine the relationships among the variables. Whereas, CAH was applied to the soils with a view to group the similar sampling sites (spatial variability) by using the Ward’s method and Euclidean distances. These techniques were applied to experimental data, standardized to avoid misclassification arising from the different orders and different units between variables.
3. Results and discussion
3.1 Assessment of physico-chemical properties
The results obtained of the collected data of soil physicochemical parameters (soil pH−water, Electrical Conductivity (EC1:5), total organic matter (TOM), carbonate content (CaCO3) and soil texture (% sand, % Slit and % clay)) are present in . The statistical parameter, such as minimum, maximum, arithmetic mean and Standard deviation, of these selected physicochemical soil properties was obtained through the conventional statistics using SPSS software (). However, the maps of the studied parameters were generated using the kriging (ordinary) technique (Osama et al., Citation2005) in order to assess the spatial variability of each parameter.
Table 1. Physicochemical and textural parameters of the agricultural sols from different stations in Beni-Amir area (n = 71).
The obtained results showed a small fluctuation in pHwater values that range from 7.20 to 8.78 with an average of 7.87. pHkcl varies from 6.90 to 7.50 with an average of 7.16. These values indicate that the soil is slightly alkaline to neutral. This result probably related to carbonate nature and organic matter accumulation (humus) in soil. The Total Organic Matter (TOM) and the carbonate content (CaCO3) vary from 1.70% to 9.79% and 7.08% to 37.33% with an average of 5.72% and 18.03%, respectively. Which indicates that Beni Amir soils are rich in TOM and carbonate content. Electrical conductivity is a very important parameter for studying soil quality; it’s used to determine the degree of soil salinity. The salts come from several sources namely irrigation water, fertilizer use, rising water tables and dissolving soil minerals (Chandrasekaran & Ravisankar, Citation2015). Soil salinity has related crop production in irrigated regions. The problem of soil salinization is particularly prevalent in arid and semi-arid areas where evapotranspiration exceeds annual precipitation and irrigation is necessary to meet water requirements. Our area is one of the most irrigated areas in Morocco. The results obtained of EC are ranging between 0.11 ds/m and 1.05 dS/m, with an average of 0.27 dS/m. According to these EC1:5 values, these soils are moderately affected by salts. But to confirm this soils salinity, it is necessary to measure the ECe of saturated paste extract.
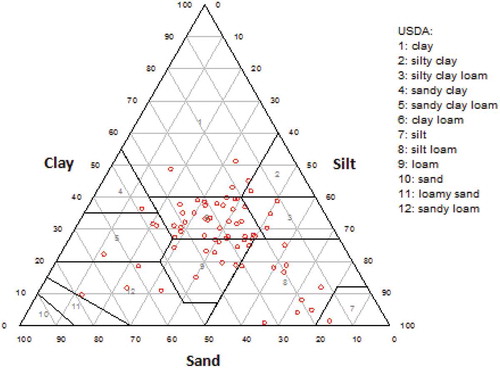
The soil texture analysis is the process of studying the distribution of the different grains in a sample, depending on their size. Soil texture is an estimate of sand, silt, and clay content in a soil. In our study area, the sand, silt, and clay are calculated as percentage (). The percentage of sand ranges from 11% to 78. 40%, with an average value 31.43%, silt ranges from 11.89% to 83.41%, with an average value 41.05% and clay ranges from 0.66% to 50.94% with an average value 27.53%. The sand and clay content were both approximately 30%. However, the silt content is about 50%, which indicates that the silt content is dominant. Therefore, in our study area, the soil texture is primarily loam; this result is confirmed by the results obtained from soil textural triangle ()
Figure 2. The soil textural triangle.
3.2. Multivariate analysis and GIS
Spatial distribution of soil properties
The quantitative evaluation of spatial variability of soil data, using geostatistical techniques, is a very important operation (Yang, Zhu, Zhao, Liu, & Tong, Citation2011). Kriging, for example, is characterized as a method of optimal prediction or estimation in geographical space and is often referred to as being the best linear unbiased predictor (Oliver, Citation2010). Hence, the collected soil physicochemical data (EC, TOM and CaCO3) were assigned to the respective geo-coordinates and exported to a GIS domain, as a shape file for geostatistical using Arc GIS Software. The Kriging method was also used to produce spatial distribution maps of soil data in order to estimating the values of non-sampled locations. The spatial distribution maps of studied parameters are shown in .
The spatial distribution of total organic matter (TOM)
Soil TOM is an accumulation of dead plant materials and partially decayed plant and animal residues. ) presents the distribution map of total organic matter (TOM). According to this map, the high values of TOM are located in the southern and eastern parts, where agriculture is well developed. But, the low values are seen in the western and the northern parts. This decrease of TOM is probably due to the effect of several factors such as, soil degradation in this area, urban transportation (National road N°:11 leading to Casablanca), human and industrial (Safilait-Jibal factory) activities.
Figure 3. Distribution map of total organic matter (TOM), carbonate content (CaCO3) and electrical conductivity (CE1:5) in the soil of the Béni-Amir area. The map was generated with the software ArcGIS.
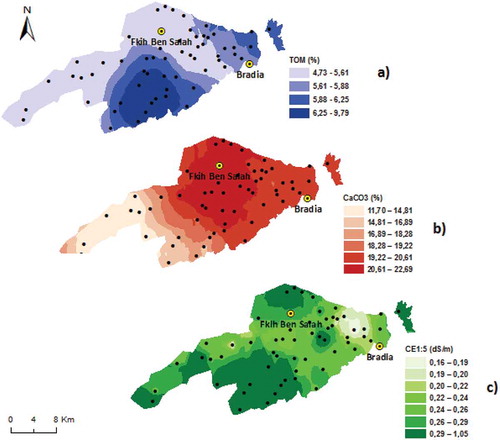
The spatial distribution of soil carbonate
The CaCO3 values show unequal distributions that are often correlated with topographical features such as slope and elevation. Our study area is rich in carbonates with a slight diminution towards the south-western part ()). In addition, the study area is rich in carbonate formations. Geologically, this area is characterized by the Quaternary deposits covering the most of study area and along the rivers. Dominant formations are limestone, marls and sandstone.
The spatial distribution of soil salinity
The assessment of soil salinity is based on EC data and their spatial distribution. EC is a cle parameter to deduce the soil salinity despite the large spatial variability in soil salinity. kriging interpolation was used for predict unsampled locations to solve this problem. The distribution map of the EC in the study area is shown in ). This figure shows that most of the area comes under the saline. Salt originate from saline irrigation water and also rainwater runoff that flows through alkaline soils and rocks (e.g., limestone). The high values of EC are seen in the central part, but the low values are located in western part.
3.3. Hierarchical cluster analysis (HCA) and principal component analysis (PCA)
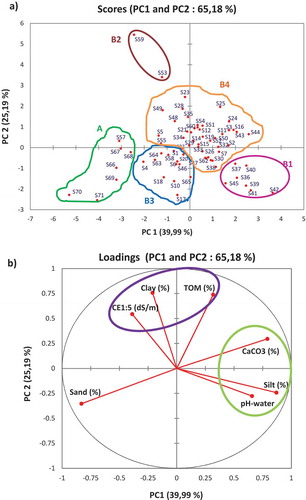
Cluster analysis is comprised of a multivariate methods series that are used to find true groups of data or stations, grouping samples on the basis of their similarities. The result of the Q-mode cluster analysis can be displayed in a tree-like structure, called a Dendrogram. The derived Dendrogram is used in this study and shown in . The Word’s method was applied and Euclidean distance was chosen as a measure of this similarity. The variables taken for this analysis are same as Pearson’s correlation analysis. This Q-mode HCA has highlighted two large clusters, A and B (). Cluster A includes samples located in the southern part of our study area. While all the other stations are grouped in cluster B. Four clusters of lower hierarchical order may be recognised in both B (B1, B2, B3 and B4). Each samples group may be considered as a distinct sub-environment (Burone et al., Citation2006). Cluster A, which corresponds to a well-defined and narrow sector located in the southern part of our study area. These samples are characterised by the low values of TOM and CaCO3, associated with the highest EC values. Cluster B, includes samples from a large area located of the study area. The groups obtained for this analysis are same as PCA. The PCA was applied to physicochemical parameters. The PCA generated for the first two dimensions is shown in . PC1 explained 39.99% of the total variance in the data set and PC2 explained 25.19%, explaining 65.18% of the total variance. PC1 concerned mainly pH, CaCO3, Sand and Silt. While all PC2 was influenced by EC, TOM, and Clay.
Figure 4. Box- plots of different soil particles (%) and soil salinity CE1:5 (dS/m).
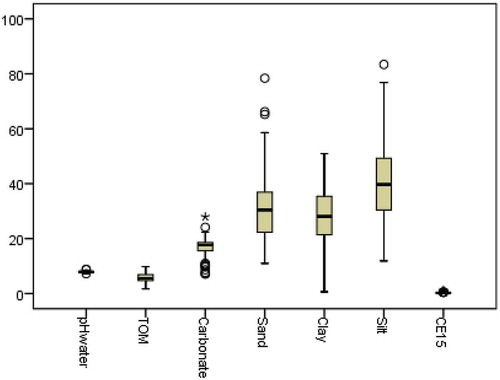
Figure 5. Dendrogram of cluster analysis (Ward’s method).
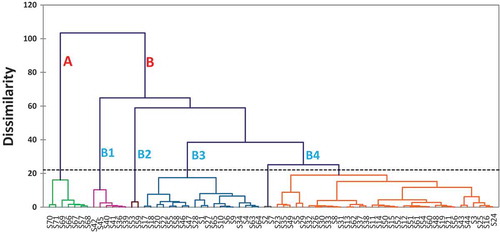
Figure 6. Principe component analysis (PCA) plots: a) loading plot for different variables on PC1 and PC2 and b) PCA score plot for soil sample.
3.4 Box-plots
Box-plots show the distribution of measured soil parameters, they are used in this study to investigate the variation of each parameter. The sand, silt and clay contents plots show strong variability. No variability differences were found for CE, TOM, pH and carbonate; demonstrating the homogeneity of these properties ().
Pearson correlation coefficient
Pearson correlation coefficient was calculated to determine the relationship between some physicochemical soils properties (pHwater, CE1:5, TOM, CaCO3, Sand, Clay and Silt fraction content). Correlation coefficient of heavy metal elements in agricultural soils from Beni Amir irrigated perimeter are presented in . Pearson correlation coefficient indicates that the pH is positively correlated with CaCO3 (r = 0.409, p < 0.001) and Silt (r = 0.434, p < 0.001), but it’s negatively correlated with EC (r = −0.387, p < 0.001) and Sand (r = 0.418, p < 0.001). TOM is positively correlated with CaCO3 (r = 0.436, p < 0.001), but it’s negatively correlated with Sand (r = −0.381, p < 0.001). CaCO3 is positively correlated with Silt (r = 0.536, p < 0.001), but it’s negatively correlated with Sand (r = −0.608, p < 0.001). Sand and Silt are strongly negatively correlated with Silt (r = −0.708, p < 0.001) and clay (r = −0.537, p < 0.001), respectively.
Table 2. Pearson correlation matrix of some physicochemical properties of soils in Beni-Amir area.
Soils, as natural corps, are inherently heterogeneous, due to the many factors that contribute to their diagenesis (Maniyunda, Raji, & Gwari, Citation2013). Soil heterogeneities can occur from land use, landscape position, and management strategies, (Sivarajan et al., Citation2013; Yasrebi et al., Citation2008), and can also come from interaction of physical, chemical, biological, and anthropogenic processes (Ghartey, Dowuona, Nartey, Adjadeh, & Lawson, Citation2012, Serrano, Shahidian, & Silva, Citation2014; Akhatanzzaman et al., Citation2014). This variability of soil properties is a general characteristic in arid and semi-arid area (Liu et al., Citation2007). Such information of soil properties is needed for improving agricultural production, recourses management, evaluating environment, and provide as a base for further research by scientists (Nkheloane, Olaleye, & Mating, Citation2012).
Our study area is a part of the Beni-Mellal watershed; it’s characterized by semi-arid continental climate. Their geological formations are mainly composed of erosion deposit, namely limestone, marl and sandstone, which comes from erosion of the atlas chain. Their age varies from Paleozoic to Quaternary. Consequently, In Our area, factors affecting soil physicochemical properties, including geological, climatic and hydrological contexts, suggest that the Tadla soils are vulnerable to climate change, as well as to populated and agricultural contamination. Due to the existence of different factors, the statistical methods were applied to the physicochemical data, in order to separate the area into homogenous zones in order to optimize their management. In this latter respect, the Cluster analysis (Q-mode HCA) has highlighted two large clusters, A and B. So, Kriging method is now accepted by several soil scientists as a useful technique for estimating the values of soil properties at unsampled sites, and to map the estimated values (Journel & Huijbregts, Citation1978). Soil scientists are interested not only to know spatial variation of soil properties but also to deduct the sources of this variation. If man’s activities are the cause of excesses of some soil attributes, farmers should modify their agricultural management.
The role of carbonate shows that a minimum of carbonate content capable of maintaining the buffering capacity of soil pH (Wang et al., Citation2015). In our area, the parent materials in the soils were rich in carbonate. High values of carbonate are probably related to the accumulation of atlas deposits and outcropping of the parent rock. But the low values are coincided with the lowest values of pH and TOM (). However, the high TOM values were found in the southeastern part characterized by a dense vegetation cover favoring the Humus formation. The clay and humus have a negative charge and are associated in the argilo-humic complex. This association is resulted with a moderately high correlation coefficients (r = 0.281, p<0.05) (). The organic matter (humus) is very important for soil quality, and it forms with clay a “glue” which allows the construction of solid aggregates and resistant to the water degradation. The clay promotes the humidification and slows humus mineralization. In sandy soil (lack of clay) the formation of clay-humus complex and humification are absent (Huber & Schaub, Citation2011). Humus is defined as an amorphous organic compound, cohesive, and hydrophilic (Huber & Schaub, Citation2011). Their formation processes in soils is natural and easy, depending on soil types, climates and residues. The soil texture is an intrinsic parameter of soil, that are affects soil chemical properties. Soil organic matter and humus contents (highly decomposed organic matter) are modify the general effects of soil mineral texture enhancing soil structure formation, increasing soil water holding capacity, and increasing soil CEC.
The effect of saline irrigation water
In arid and semiarid regions, the regular monitoring of soil salinity is essential for efficient soil and water management of agricultural lands (Bilgili., Cullu, Van Es, Aydemir, & Aydemir, Citation2011, Aldabaa et al., Citation2015). Irrigation in these regions is generally considered an effective way of increasing agricultural production. This can supply the water needed for crop growth when rainfall is limited but, the bad drainage of the latter generates the salinity soil.
Salinity can occur when irrigation; because almost all water (even natural rainfall) contains some dissolved salts (I.L.R.I, Citation1989). When the plants use the water, the salts are precipitatedin the soil and begin to accumulate. Salinity phenomenon can have significant impacts on the degradation of soils quality. Several authors show that soil respiration is reduced with increasing soil EC (McCormick & Wolf, Citation1980; Pathak & Rao, Citation1998; Walpola & Arunakumara, Citation2010; in Reddy & Crohn, Citation2014).
In our study area, the irrigation started in 1935 (Hammani et al., Citation2004, Moniod, Citation1973) by the establishment of a diversion dam on Oum-Er-Bia River, and this perimeter is irrigated with saline waters of this River (Faouzi &Larabi, Citation2001, Dakak et al., Citation2011). Excessive use of irrigation by Oum-Er-Bia water causes rise salinity in the groundwater at levels close to the surface (up to – 2 m).Finally, the salinization from irrigation water is also increased by poor drainage and use of saline irrigation water. Our study area, agricultural crops is irrigated with saline water of Oum-Er-Rbia river. The control of soil salinity based on knowledge of its spatial distribution, is becoming necessary in order to assure strategies for sustainable agricultural development. The electromagnetic induction is frequently used to map saline soils (Cameron, Read, Jong, & Oosterveld, Citation1981; Cannon, Lachapelle, & McKenzie, Citation1994; Dakak et al., Citation2011; Lesch, Rhoades, Lund, & Corwin, Citation1992; Williams & Hoey, Citation1987). This method was applied in our study area by Dakak et al. (Citation2011). The overall soil salinity varies between 0.35 and 13 dS/m. This decrease in salinity observed to date probably due to the installation of small dams along the Oum-Er-Bia river for irrigation water and the efforts carried out to educate farmers by ORMVAT.
4. Conclusions
Soil quality data collected from 71 stations located in the Beni-Amir perimeter in Tadla plain have been examined by the multivariate statistical techniques such as: principal component analysis (PCA) and hierarchical cluster analysis (HCA) to yield correlations between variables. The geographic information systems (GIS) used of the data obtained from the Beni-Amir perimeter is found to be a very efficient tool to assess the current situation of the region.
According to the results of this study on soil types and impact of land used we can concluded that the soil is saline and soil texture varied from sand to clay content. TOM is moderately to strongly high in soil. The carbonate content (CaCO3) also high in the study area. In addition, the EC values fall within the moderate and strong degrees of salinity. Drip irrigation is considered the most efficient irrigation method to resolve this salinity problem. The high content of OM and clay fraction in the surface layers has a high ability to link heavy metals and prevents their vertical movement in soil horizons.
References
- Aghzar, N., Berdai, H., Bellouti, A., & Soudi, B. (2002). Pollution nitrique des eaux souterraines au Tadla (Maroc). Revue des sciences de l’eau/Journal of Water Science, 15(2), 459–492.
- Akbas, F. (2014). Spatial variability of soil color parameters and soil properties in an alluvial soil. African Journal of Agricultural Research, 9(12), 1025–1035.
- Akhtaruzzaman, M., Haque, M. E., & Osman, K. T. (2014). Morphological, physical and chemical characteristics of hill forest soils at chittagong university, bangladesh. Open Journal of Soil Science, 4(01), 26. doi:10.4236/ojss.2014.41004
- Aldabaa, A. A. A., Weindorf, D. C., Chakraborty, S., Sharma, A., & Li, B. (2015). Combination of proximal and remote sensing methods for rapid soil salinity quantification. Geoderma, 239, 34–46.
- Barakat, A., El Baghdadi, M., Rais, J., & Nadem, S. (2012). Assessment of heavy metal in surface sediments of Day River at Beni-Mellal region, Morocco. Research Journal of Environmental and Earth Sciences, 4(8), 797–806.
- Bellouti, A., Cherkaoui, F., Benhida, M., Debbarh, A., Soudi, B., & Badraoui, M. (2002). Mise en place d’un système de suivi et de surveillance de la qualité des eaux souterraines et des sols dans le périmètre irrigué du Tadla, au Maroc. In Atelier du PCSI (Programme Commun Systèmes Irrigués) sur une Maîtrise des Impacts Environnementaux de l’Irrigation, pp 11. Retrieved from http://hal.cirad.fr/cirad-00180737/
- Bilgili, A. V., Cullu, M. A., Van Es, H. M., Aydemir, A., & Aydemir, S. (2011). The use of hyperspectral visible and near infrared reflectance spectroscopy for the characterization of salt-affected soils in the Harran plain. Turkey Arid Land Research and Management, 25(1), 19–37.
- Biswas, A., & Paul, A. K. (2012). Physico-chemical analysis of saline soils of solar salterns and isolation of moderately halophilic bacteria for poly (3-hydroxybutyric acid) production. Int Res J Microbiol, 2, 227–236.
- Bouchaou, L., Michelot, J. L., Qurtobi, M., Zine, N., Gaye, C. B., Aggarwal, P. K., … Vengosh, A. (2009). Origin and residence time of groundwater in the Tadla basin (Morocco) using multiple isotopic and geochemical tools. Journal of hydrology, 379(3–4), 323–338.
- Brabant, P., Bied-Charreton, M., & Schnepf, M. O. (2010). Une méthode d’évaluation et de cartographie de la dégradation des terres: proposition de directives normalisées. Retrieved from http://horizon.documentation.ird.fr/exl-doc/pleins_textes/divers12-04/010050923.pdf
- Brady, N. C., & Weil, R. R. (2008). The soils around us. The Nature and Properties of Soils (14th ed., pp. 1–31). New Jersey and OH: Pearson Prentice Hall.
- Brejda, J. J., Karlen, D. L., Smith, J. L., & Allan, D. L. (2000). Identification of regional soil quality factors and indicators II. Northern Mississippi Loess Hills and Palouse Prairie. Soil Science Society of America Journal, 64(6), 2125–2135.
- Burgess, T. M., & Webster, R. (1980a). Optimal interpolation and isarithmic mapping of soil properties. Journal of Soil Science, 31(2), 315–331.
- Burone, L., Venturini, N., Sprechmann, P., Valente, P., & Muniz, P. (2006). Foraminiferal responses to polluted sediments in the Montevideo coastal zone, Uruguay. Marine Pollution Bulletin, 52, 61-73. doi:10.1016/j.marpolbul.2005.08.007
- Cameron, D. R., Read, D., Jong, E. D., & Oosterveld, M. (1981). Mapping salinity using resistivity and electromagnetic inductive techniques. Canadian Journal of Soil Science, 61(1), 67–78.
- Cannon, M. E., Lachapelle, G., & McKenzie, R. C. (1994). Soil salinity mapping with electromagnetic induction and satellite-based navigation methods. Canadian Journal of Soil Science, 74(3), 335–343.
- Cattle, J. A., McBratney, A., & Minasny, B. (2002). Kriging method evaluation for assessing the spatial distribution of urban soil lead contamination. Journal of Environmental Quality, 31(5), 1576–1588.
- Chandrasekaran, A., & Ravisankar, R. (2015). Spatial distribution of physico-chemical properties and function of heavy metals in soils of Yelagiri hills, Tamilnadu by energy dispersive X-ray florescence spectroscopy (EDXRF) with statistical approach. Spectrochimica Acta Part A: Molecular and Biomolecular Spectroscopy, 150, 586–601.
- Chhabra, R. (1996). Soil Salinity and Water Quality (pp. 284). New Delhi: Oxford Press. Retrieved from https://www.crcpress.com/Soil-Salinity-and-Water-Quality/Chhabra/p/book/9789054107279#googlePreviewContainer
- Dakak, H., Soudi, B., Mohammadi, A. B., Douaik, A., Badraoui, M., & Moussadek, R. (2011). Prospection de la salinité des sols par induction électromagnétique sur la plaine du Tadla (Maroc): tentative d’optimisation par analyse géostatistique. Science et changements planétaires/Sécheresse, 22(3), 178–185.
- Davies, B. E., & Gamm, S. A. (1970). Trend surface analysis applied to soil reaction values from Kent, England. Geoderma, 3(3), 223–231.
- Dolédec, S., & Chessel, D. (1987). Rythmes saisonniers et composantes stationnelles en milieu aquatique. I: Description d’un plan d’observation complet par projection de variables. Acta Oecologica Oecologia Generalis, 8(3), 403–426.
- Douaik, A., Van Meirvenne, M., & Tóth, T. (2005). Soil salinity mapping using spatio-temporal kriging and Bayesian maximum entropy with interval soft data. Geoderma, 128(3–4), 234–248.
- El Baghdadi, M., Barakat, A., Sajieddine, M., & Nadem, S. (2012). Heavy metal pollution and soil magnetic susceptibility in urban soil of Beni Mellal City (Morocco). Environmental Earth Sciences, 66(1), 141–155.
- El Baghdadi, M. E., Jakani, K., Barakat, A., & Bay, Y. (2011). Magnetic susceptibility and heavy metal contamination in agricultural soil of Tadla Plain. Journal Materials Environment Sciences, 2, 513–519.
- Erşahin, S., & Karaman, R. (2000). Use of factor analysis in the assessment of soil variability for site specific management and soil fertility studies. Tarım Bilimleri Dergisi, 6(2), 76–81.
- Faouzi, M., & Larabi, A. (2001). Problématique de la remontée, de la salinité et de la pollution par les nitrates des eaux de la nappe phréatique des Beni-Amir (Tadla, Maroc). Ingénieries-EAT, 27, 23.
- Gaston, L. A., Locke, M. A., Zablotowicz, R. M., & Reddy, K. N. (2001). Spatial variability of soil properties and weed populations in the Mississippi Delta. Soil Science Society of America Journal, 65(2), 449–459.
- Ghartey, E. O., Dowuona, G. N., Nartey, E. K., Adjadeh, T. A., & Lawson, I. Y. (2012). Assessment of variability in the quality of an acrisol under different land use systems in Ghana. Open Journal of Soil Science, 2(1), 33.
- Goovaerts, P., Rossel, R. V., & McBratney, A. B. (2002). Geostatistical modeling and propagation of uncertainty: application to the management of agricultural fields. In Proceedings of International Association for Mathematical Geology (IAMG) (pp. 15–20).
- Hammani, A., Kuper, M., Debbarh, A., Bouarfa, S., Badraoui, M., & Bellouti, A. (2004). Evolution de l’exploitation des eaux souterraines dans le périmètre irrigué du Tadla. In Séminaire sur la modernisation de l’agriculture irriguée, IAV Hassan II, pp. 8. Retrieved from https://hal.archives-ouvertes.fr/cirad-00189415/.
- Hammoumi, N. E., Sinan, M., Lekhlif, B., & Lakhdar, M. (2013). Use of multivariate statistical and geographic information system (GIS)-based approach to evaluate ground water quality in the irrigated plain of Tadla (Morocco). International Journal of Water Resources and Environmental Engineering, 5(2), 77–93.
- Hanks, J., & Ritchie, J. T. (1991). Modeling plant and soil systems (pp. 545). Madison (WI): American Society of Agronomy, Crop Science Society of America and Soil Science Society of America.
- Harris, R. F. (1981). Effect of water potential on microbial growth and activity. waterpotentialr Water potential relations in soil microbiology, 23–95.
- Hillel, D. (1991). Research in soil physics: A review. Soil Science, 151, 30–34.
- Huber, G., & Schaub, C. (2011). La fertilité des sols: L’importance de la matière organique. In Chambre d’agriculture du Bas-Rhin (pp. 46).
- I.L.R.I. (1989). Effectiveness and Social/Environmental Impacts of Irrigation Projects: a Review, In: Annual Report of the International Institute for Land Reclamation and Improvement (ILRI), Wageningen, the Netherlands (pp. 18–34).
- Isaaks, E. H., & Srivastava, R. M. (1989). An Introduction to Applied Geostatistics (pp. 560). New York: Oxford Univ, Press.
- Journel, A. G., & Huijbregts, C. J. (1978). Mining geostatistics (pp. 600). London: Academic press.
- Keren, R. (2000). Salinity. In Sumner ME, editor. Handbook of soil science (pp. 3–25). Boca Raton: CRC Press.
- Krige, D. G. (1978). Lognormal-de Wijsian geostatistics for ore evaluation. Johannesburg, South African Institute of Mining and Metallurgy. Monograph Series, 1.
- Läuchli, A., & Epstein, E. (1990). Plant responses to saline and sodic conditions. Agricultural Salinity Assessment and Management, 71, 113–137.
- Lesch, S. M., Rhoades, J. D., Lund, L. J., & Corwin, D. L. (1992). Mapping soil salinity using calibrated electromagnetic measurements. Soil Science Society of America Journal, 56(2), 540–548.
- Liu, X., Chunjian, S., Liang, W., Jiang, Y., Jiang, D., & Steinberger, Y. (2007). Spatial variability of soil properties related to salinity and alkalinity in meliorated grassland of Horqin sand land, Northeast China. Agricultural Journal, 2(5), 564–569.
- Maas, E. V. (1986). Salt tolerance of plants. Applications Agricultural Research, 1, 12–26.
- Maniyunda, L. M., Raji, B. A., & Gwari, M. G. (2013). Variability of some soil physicochemical properties on lithosequence in Funtua, North-Western Nigeria. International Journal Sciences Researcher, 2, 174–180.
- McCormick, R. W., & Wolf, D. C. (1980). Effect of sodium chloride on CO2 evolution, ammonification, and nitrification in a Sassafras sandy loam. Soil Biology & Biochemistry, 12(2), 153–157.
- Moniod, F. (1973). Etude hydrologique de l’Oum er R’bia (Maroc). Cahiers ORSTOM. Série Hydrologie, 10(2), 153–170.
- Mueller, T. G., Pusuluri, N. B., Mathias, K. K., Cornelius, P. L., Barnhisel, R. I., & Shearer, S. A. (2004). Map quality for ordinary kriging and inverse distance weighted interpolation. Soil Science Society of America Journal, 68(6), 2042–2047.
- Mzuku, M., Khosla, R., Reich, R., Inman, D., Smith, F., & MacDonald, L. (2005). Spatial variability of measured soil properties across site-specific management zones. Soil Science Society of America Journal, 69(5), 1572–1579.
- NF ISO 11464. (2006). Qualité du sol - Prétraitement des échantillons pour analyses physico-chimiques (pp. 17).
- Nkheloane, T., Olaleye, A. O., & Mating, R. (2012). Spatial heterogeneity of soil physico-chemical properties in contrasting wetland soils in two agro-ecological zones of Lesotho. Soil Research, 50(7), 579–587.
- Nourzadeh, M., Mahdian, M. H., Malakouti, M. J., & Khavazi, K. (2012). Investigation and prediction spatial variability in chemical properties of agricultural soil using geostatistics. Archives of agronomy and soil science, 58(5), 461–475.
- Oliver, M. A. (2010). An overview of geostatistics and precision agriculture. In Geostatistical applications for precision agriculture (pp. 1–34). Dordrecht: Springer. Retrieved from https://link.springer.com/chapter/10.1007/978-90-481-9133-8_1
- Osama, M., Fukumara, K., Ishida, T., & Yoshino, K. (2005). Assessment of Spatial Variability of Soil and Canopy Properties in a Cassava Field. Journal of Japan society of hydrology and water resources, 18 (5), 501–509.
- Pathak, H., & Rao, D. (1998). Carbon and nitrogen mineralization from added organic matter in saline and alkali soils. Soil biology & biochemistry, 30(6), 695–702.
- Pebesma, E. J. (2004). Multivariable geostatistics in S: The gstat package. Computers & Geosciences, 30(7), 683–691.
- Qadir, M., & Schubert, S. (2002). Degradation processes and nutrient constraints in sodic soils. Land Degradation & Development, 13(4), 275–294.
- Rao, P. S. C., & Wagenet, R. J. (1985). Spatial variability of pesticides in field soils: Methods for data analysis and consequences. Weed Science, 33(S2), 18–24.
- Rapheal, O., & Adebayo, K. S. (2011). Assessment of trace heavy metal contaminations of some selected vegetables irrigated with water from River Benue within Makurdi Metropolis, Benue State Nigeria. Advances in Applied Science Research, 2(5), 590–601.
- Reddy, M. V., Satpathy, D., & Dhiviya, K. S. (2013). Assessment of heavy metals (Cd and Pb) and micronutrients (Cu, Mn, and Zn) of paddy (Oryzasativa L.) field surface soil and water in a predominantly paddy-cultivated area at Puducherry (Pondicherry, India), and effects of the agricultural runoff on the elemental concentrations of a receiving rivulet. Environmental Monitoring and Assessment, 185(8), 6693–6704.
- Reddy, N., & Crohn, D. M. (2014). Effects of soil salinity and carbon availability from organic amendments on nitrous oxide emissions. Geoderma, 235, 363–371.
- Robinson, T. P., & Metternicht, G. (2006). Testing the performance of spatial interpolation techniques for mapping soil properties. Computers and Electronics in Agriculture, 50(2), 97–108.
- Sciarretta, A., & Trematerra, P. (2014). Geostatistical tools for the study of insect spatial distribution: Practical implications in the integrated management of orchard and vineyard pests. Plant Protection Science, 50(2), 97–110.
- Serrano, J., Shahidian, S., & Silva, J. M. D. (2014). Spatial and temporal patterns of apparent electrical conductivity: Dualem vs. Veris sensors for monitoring soil properties. Sensors, 14(6), 10024–10041.
- Shange, R. S., Ankumah, R. O., Githinji, L., & Zabawa, R. (2012). Spatial assessment of selected soil properties within an industrial poultry production site. Air, Soil and Water Research, 5, ASWR-S9268. Retrieved from http://journals.sagepub.com/doi/pdf/10.4137/ASWR.S9268
- Shukla, M. K., Lal, R., & Ebinger, M. (2006). Determining soil quality indicators by factor analysis. Soil and Tillage Research, 87(2), 194–204.
- Simeonov, V., Stratis, J. A., Samara, C., Zachariadis, G., Voutsa, D., Anthemidis, A., … Kouimtzis, T. (2003). Assessment of the surface water quality in Northern Greece. Water Research, 37(17), 4119–4124.
- Singh, K. P., Malik, A., Mohan, D., & Sinha, S. (2004). Multivariate statistical techniques for the evaluation of spatial and temporal variations in water quality of Gomti River (India)—a case study. Water Research, 38(18), 3980–3992.
- Sinowski, W., & Auerswald, K. (1999). Using relief parameters in a discriminant analysis to stratify geological areas with different spatial variability of soil properties. Geoderma, 89(1–2), 113–128.
- Sivarajan, S., Nagarajan, M., & Sivasamy, R. (2013). Spatial Variability analysis of Soil Properties using raster based GIS Techniques. Asian Journal of Applied Science, 6(2), 68–78.
- Sommet Mondial de l’Alimentation. (1996). Dégradation anthropique des sols (pp. 13–17). Rome: World Food Summit: Sommet Mondial de l’Alimentation.
- Sumner, M. E. (1993). Sodic soils-New perspectives. Soil Research, 31(6), 683–750.
- Trangmar, B. B., Yost, R. S., & Uehara, G. (1986). Application of geostatistics to spatial studies of soil properties. Advances in Agronomy, 38, 45–94. Retrieved from https://www.sciencedirect.com/science/article/pii/S0065211308606732
- Tunçay, T., Bayramin, I., Tercan, A. E., & Ünver, İ. (2013). Spatial variability of some soil properties: A case study of the Lower Seyhan river basin in Turkey. Zemdirbyste-Agriculture, 100(2), 213–219.
- Wälder, K., Wälder, O., Rinklebe, J., & Menz, J. (2008). Estimation of soil properties with geostatistical methods in floodplains. Archives of Agronomy and Soil Science, 54(3), 275–295.
- Wallender, W. W., & Tanji, K. K. (2011). Agricultural salinity assessment and management (No. Ed. 2). American Society of Civil Engineers (ASCE). Retrieved from https://www.cabdirect.org/cabdirect/abstract/20123155653.
- Walpola, B. C., & Arunakumara, K. K. I. U. (2010). Effect of salt stress on decomposition of organicmatter and nitrogen mineralization in animalmanure amended soils. Journal Agricultural Sciences, 5(1), 9–18.
- Wang, C., Li, W., Yang, Z., Chen, Y., Shao, W., & Ji, J. (2015). An invisible soil acidification: Critical role of soil carbonate and its impact on heavy metal bioavailability. Scientific reports, 5, 12735.
- Wang, C., Zuo, Q., & Zhang, R. (2008). Estimating the necessary sampling size of surface soil moisture at different scales using a random combination method. Journal of Hydrology, 352(3–4), 309–321.
- Warrick, A. W., Myers, D. E., & Nielsen, D. R. (1986). Geostatistical methods applied to soil science. In Methods of soil analysis, part 1, 2nd edn. Physical and mineralogical methods. Agronomy Monograph, 9, 53–82.
- Webster, R., & Burgess, T. M. (1980). Optimal interpolation and isarithmic mapping of soil properties III changing drift and universal kriging. Journal of Soil Science, 31(3), 505–524.
- Wibawa, W. D., Duduzile, L. D., Swenson, L. J., Hopkins, D. G., & Dahnke, W. C. (1993). Variable fertilizer application based on yield goal, soil fertility, and soil map unit. Journal Products Agricultural, 6(2), 255–261.
- Williams, B. G., & Hoey, D. (1987). The use of electromagnetic induction to detect the spatial variability of the salt and clay contents of soils. Soil Research, 25(1), 21–27.
- Winderlin, D. A., Diaz, M. P., Ame, M. V., Pesce, S. F., Hued, A. C., & Bistoni, M. A. (2001). Pattern recognition techniques for the evaluation of spatial and temporal variations in water quality, a case study: Suquía river basin (Córdoba-Argentina). Water Research, 35(12), 2881–2894.
- Yang, Y., Zhu, J., Zhao, C., Liu, S., & Tong, X. (2011). The spatial continuity study of NDVI based on Kriging and BPNN algorithm. Mathematical and Computer Modelling, 54(3–4), 1138–1144.
- Yasrebi, J., Saffari, M., Fathi, H., Karimian, N., Emadi, M., & Baghernejad, M. (2008). Spatial variability of soil fertility properties for precision agriculture in Southern Iran. Journal Applications Sciences, 8, 1642–1650.
- Zhang, N., Wang, M., & Wang, N. (2002). Precision agriculture—a worldwide overview. Computers and Electronics in Agriculture, 36(2–3), 113–132.
- Zucco, G., Brocca, L., Moramarco, T., & Morbidelli, R. (2014). Influence of land use on soil moisture spatial–temporal variability and monitoring. Journal of Hydrology, 516, 193–199.