
ABSTRACT
The present study is an attempt to describe the geomorphic evolution of the Dongar River Basin, Son Valley, Central India. To achieve this target, a detailed field survey and morphometric analysis of the river have been carried out using Cartosat-DEM data with the help of ArcGIS 10 software. The basin area of the Dongar River is 35.17 km2 having trellis and sub-dendritic to dendritic drainage patterns. The Dongar River is designated as fourth-order basin and lower order streams mostly dominate in the basin with the drainage density value of 1.21 km−1. The stream order of the basin is predominantly controlled by physiographic and tectonic set-up of the study area. The slope of basin varies from 0° to 42.04° and is mainly controlled by the local geology and erosional cycles. The bifurcation ratio (Rb) for the studied basin varies from 1.58 to 4. The higher values of the bifurcation ratio, i.e., of second/third along with third/fourth order, reveal the regional geological and tectonic controls when river starts draining along the exposures of lower Vindhyan . The elongation ratio of the basin is 0.86 thus indicates high infiltration capacity, low runoff, and low-to-moderate slope of the river basin. The increase in stream length ratio from lower to higher order shows that the basin has reached mature geomorphic stage. The major trends of lineaments are ENE – WSW, i.e., almost analogous to Son-Narmada lineament suggesting that Son-Narmada lineament played an important role to control the drainage dynamics and evolution of the adjacent river basins. These features along the Dongar River and the orientation of the major lineaments suggest neotectonics, may be due to reactivation of the Son-Narmada lineament.
1. Introduction
Morphometry is the measurement and mathematical analysis of the configuration of the earth’s surface, shape, and dimensions of its landforms (Clarke, Citation1996). In recent years, the morphometric analysis has emerged as a powerful tool to identify and interpret the neotectonic signatures, which controls the basin dynamics of a river (Thomas, Joseph, & Thrivikramaji, Citation2010; Pareta & Pareta, Citation2011; Singh & Kanhaiya, Citation2015; Kaushik & Ghosh, Citation2015a, Citation2015b; Prakash, Singh, & Shukla, Citation2016a; Prakash, Mohanty, Singh, Chaubey, & Prakash, Citation2016b; Prakash, Chaubey, Singh, Mohanty, & Singh, Citation2017a; Prakash, Mohanty, Pati, Singh, & Chaubey, Citation2017b; Prakash, Singh, Mohanty, Chaubey, & Singh Citation2017c; Rai, Chandel, Mishra, & Singh, Citation2018; Kanhaiya, Singh, Singh, Mittal, & Srivastava, Citation2018; Singh, Kanhaiya, Singh, & Chaubey, Citation2018a; Singh et al., Citation2018b). The quantitative analysis of river basin evaluation, watershed prioritization, soil and water conservation, and natural resources management at micro level has been defined using different morphometric parameters (Rudraiah, Govindaiah, & Srinivas, Citation2008). The evaluation of the morphometric parameters necessitates the preparation of drainage density map, ordering of the various streams, measurement of the catchment area and perimeter, length of drainage channels, frequency, bifurcation ratio, circulatory ratio, and constant channel maintenance (Nag & Chakraborty, Citation2003). These parameters are useful in various studies of geomorphology and surface water hydrology, such as flood characteristics, sediment yield, and evolution of basin morphology, characterizing river basins, and distribution of stream network within the catchment (Kanhaiya et al., Citation2018; Kaushik & Ghosh, Citation2018a, Citation2018b; Prakash, Singh, Mohanty, Chaubey, & Singh, Citation2017c; Prakash et al., Citation2016a; Rai et al., Citation2018; Rai, Mishra, & Mohan, Citation2017; Senadeera, Piyasiri, & Nandalal, Citation2001; Singh & Kanhaiya, Citation2015; Singh, Kumar, et al., Citation2018a; Singh, Kanhaiya, et al., Citation2018b; Sreedevi, Subrahmanyam, & Ahmed, Citation2004, Citation2005). It provides the near real time and accurate information related to distinct geological formation, landforms and helps in identification of drainage channels, which are altered by natural forces and sometimes by human activities.
The objective of the present research is to study the morphometric parameters of Dongar River Basin and to identify the influence of the underlying geology on the morphometric parameters of the basin and finally to generate a substantial knowledge base regarding the relationship between surface morphometry and subsurface lithology for integrated basin management. applicable for infrastructure developments In this paper, an attempt has been made to (i) delineate different physical characteristics of the drainage basins and understand the relationship among them, and (ii) understand the role of lithology and geologic structures in development of drainage pattern. The present study bridges the connection between surface morphometry and subsurface geology of a drainage basin to produce effective information extremely useful for basin management.
2. Study area
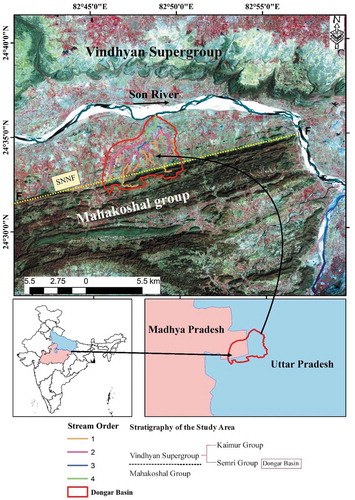
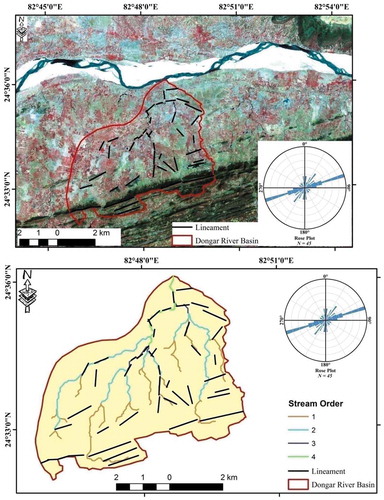
The Dongar River originates from Mahakoshal Group of rock (Lat. 82° 47׳ 38.56״ E Log. 24° 32׳ 24.51״ N, altitude 231 m) and flowing in the north direction crossing the SNNF (Son-Narmada North Fault), and then starts flowing in lower Vindhyan (Fawn Limestone and Glauconitic Sandstones) before its confluence with Son River near to Newari Village of Sonbhadra District, India (Lat. 82°48׳43.71״ E Log. 24°36׳3.01״N, altitude 118 m). It is a small river having length 12 km and covers a total drainage area of 35.17 km2 (). The river flows initially towards the west, and then turns towards the north direction before draining in Lower Vindhyan. The Dongar River is composed of a well-developed drainage network ranging from first- to fourth-order streams. The study area experiences a semi-arid type of climate, with three seasons in a year, i.e., summer (March to June), rainy (July to October), and winter (November to February) seasons. It remains too hot during summer and too cold during winter season. The maximum monthly temperature varies from 21ºC in January to 45ºC in June. The average rainfall varies between 850 and 1300 mm, about 85% of the annual rainfall occurs during the rainy season from the southwest monsoon. The distinction of seasonal pattern may be attributed due to marked variation in temperature, sun-shine, pattern of precipitation (mainly rainfall), and many other climatic factors. The coldest month in both the year was January with yearly average minimum temperature as 8.9°C, while May was the hottest month in both the year average maximum temperature of 44.7°C. The average relative humidity is high during rainy season and low during dry season.
Figure 1. Satellite imaginary showing the Dongar River Basin, Son Valley, Central India.
3. Material and method
For morphometric analysis, drainage map of the study area was prepared from Cartosat-DEM using ArcGIS 10 adopting the standard procedures (Band, Citation1986; Gurnell & Montgomery, Citation1999; Maidment, Citation2002; Morris & Heerdegen, Citation1988). In order to analyze the morphometric parameters, boundaries of 31 fifth-order and 6 sixth-order subbasins have been extracted (). The drainage network of the basin and the stream ordering was analyzed according to Horton (Citation1945), Strahler (Citation1958, Citation1964), Verstappen (Citation1983), Patton (Citation1988), Ritter, Kochel, and Miller (Citation1995), Macka (Citation2001), Reddy, Maji, and Gajbhiye (Citation2004), Vittala, Govindaiah, and Honne (Citation2004, Citation2006), Mesa (Citation2006) and Ozdemir and Brid (Citation2009). The formulae adopted for computation of morphometric parameters are given in .
Table 1. Formulae adopted for computation of different morphometric parameters and their calculated values for Dongar River Basin, Son Valley, Central India.
Figure 2. (a) Aspect map, (b) Slope map, and (c) Relief map of the Dongar River Basin, Son Valley, Central India.
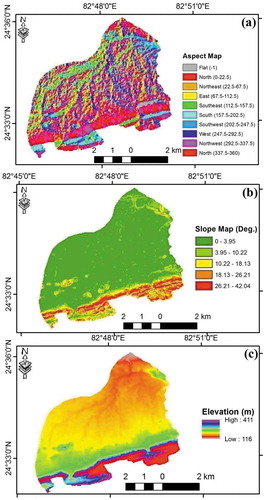
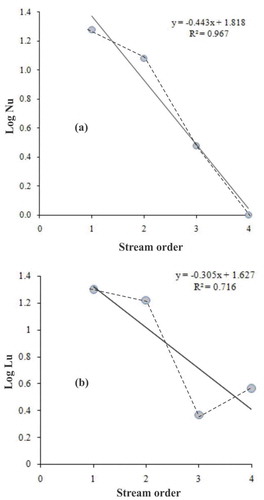
Figure 3. (a) Bivariate plots of “log Nu” vs. stream order (Horton’s first law). (b) “log Lu” vs. stream order (Horton’s second law).
4. Result and discussion
4.1. Drainage dynamics of the Dongar River Basin
The drainage dynamics of the Dongar River Basin has been intended using morphometric analysis. The calculated value of all the parameters is given in .
4.1.1. Aspect of the basin
In general, the aspect of the basin deals with direction to which a mountain slope faces (Magesh & Chandrasekar, Citation2014; Magesh, Chandrasekar, & Soundranayagam, Citation2011). Aspect of the basin has significant influences on the climatic conditions (precipitation, vegetation type, snow melt, and wind contact of the basin area) because the sun’s rays are in the west at the hottest time of day in the afternoon, and so in most cases a west-facing slope will be warmer than sheltered east-facing slope (Rai et al., Citation2018, Citation2017). This can also affect the distribution of vegetation in the area of a particular basin. The value of the output raster dataset represents the compass direction of the aspect (Magesh et al., Citation2011). The aspect map of Dongar River Basin is shown in ). It is clearly seen that the studied basin has north-west (N-W), east (E), and north (N) facing slopes. The southern part of the Dongar River Basin has slopes mainly facing towards north-west (N-W) where the river drains only through the Mahakoshal Group of rocks, and as the river enters into the lower Vindhyan the N-E slopes decreases in respective manner. The aspect values have a significant effect on the distribution of vegetation and bio-diversity in the basin area and is very helpful for the agricultural development.
4.1.2. Slope of the basin
Slope analysis is an important parameter in geomorphological studies for watershed development and important for morphometric analysis. According to Burrough (Citation1986), the maximum rate of change in value from each cell to its neighbor is identified as slope grid. The slope elements are controlled by the climate and morpho-geological processes in areas having rock of varying resistance (Gayen, Bhunia, & Shi, Citation2013; Magesh et al., Citation2011; Rai et al., Citation2017). A slope map of the study area has been prepared based on Cartosat-DEM data using the spatial analysis tool in ArcGIS 10 software. The degree of slope in Dongar River Basin varies from 3.95 to 42.04 ()). According to Sreedevi et al. (Citation2005), the slope distribution is an important factor for watershed planning for settlement, agriculture, deforestation/afforestation, planning of construction of water harvesting structures, engineering structures and morpho-conservation practices etc.
4.1.3. Relative relief
Relative relief is an important morphometric variable used for the assessment of morphological characteristics of any topography (Gayen et al., Citation2013). The highest relative relief is calculated as 411 m, while the lowest value is recorded as 116 m ()). The low relief indicates that the northern area of the Dongar River Basin having flat to gentle slope. Therefore, the area could be basically used for agricultural activities around stream sides due to being flat in nature and also water accessibility.
4.1.4. Stream order (Nu)
The total of stream channels in each order is called stream order. Stream number is directly proportional to size of the contributing watershed, to channel extent. Horton (Citation1945), Strahler (Citation1952) and Schidggar (Citation1970) gave different methods and system for ordering of streams. In all available methods, Horton (Citation1945) is most competent and commonly used since last decades. According to Horton (Citation1945), the number of streams of various orders in any river basin tends to closely to estimate as inverse geometric series of which the first term is unity and the ratio is bifurcation ratio. The stream number is progressively decreases as the stream order increases; the variation in stream order is largely associated with physiographic, geomorphological, geological, structural, and tectonics of the area (Rai et al., Citation2018; Singh & Kanhaiya, Citation2015).
It is found that Dongar River has stream up to fourth order. In total, 35 streams were identified of which 19 are first order, 12 are second order, 3 are third order, and 1 in fourth order (). Also the bivariate plot between “Log Nu” and stream order shows a inverse geometrical relationship ()). Drainage patterns of stream network from the basin have been observed as mainly of dendritic type which indicates the homogeneity in texture and lack of structural control.
4.1.5. Stream length (Lu)
The stream length (Lu) has been computed following Horton (Citation1945). Stream length is one of the most significant hydrological features of the basin as it reveals surface runoff characteristics. The stream of relatively smaller length is characteristics of areas with larger slopes and finer textures (Rai et al., Citation2018; Thomas et al., Citation2010). Longer lengths of streams are generally indicative of flatter gradient. The numbers of streams of various orders in a watershed are counted and their lengths from mouth to drainage divide are measured with the help of GIS software.
In the case of Dongar River, the total length of first-order stream is 19.87 km, second-order stream is 16.71 km, third-order stream is 2.43 km, and fourth-order stream is 3.66 km. The length of the streams in first order is highest and progressively decreases from first to fourth order which also verifies the Horton’s law of stream number, i.e., the number of stream segment of each order forms an inverse geometric sequence with order number. Also the bivariate plot between “Log Lu” and stream order shows a linear geometrical relationship ()).
4.1.6. Mean stream length (Lsm)
The mean stream length is a characteristic property related to the drainage network and its associated surfaces (Strahler, Citation1964). The mean stream length (Lsm) has been calculated by dividing the total stream length of order by the number of stream. The mean stream length of study area is 0.63 for first order, 1.14 for second order, 1.88 for third order, and 2.43 for fourth order. In general, the mean stream length of stream increases with increasing order. The similar observational facts have been found in the case of Son Basin and its other tributaries (see Rai et al., Citation2017)
4.1.7. Stream length ratio (Rl)
The stream length ratio can be defined as the ratio of the mean stream length of a given order to the mean stream length of next lower order, and has an important relationship with surface flow and discharge (Horton, Citation1945). The Rl values between streams of different order in the basin reveal that there are variations in slope and topography (Kanhaiya et al., Citation2018; Rai et al., Citation2018; Sreedevi et al., Citation2004; Thomas et al., Citation2010). The Rl values have significant relationship with slope and topography of successive stream order and also give clues about surface runoff and erosional history of a river (Kanhaiya et al., Citation2018; Singh & Kanhaiya, Citation2015; Sreedevi et al., Citation2004).
The average value of stream length ratio (Rl) 0.83 calculated for Dongar River Basin. The Rl value is 1.5 for fourth/third order, 0.14 for third/second order, and 0.84 for second/first-order stream channels (). The variability in Rl, among the successive stream orders, is a reflection of differences between slope and topography and hence it has an important control on discharge and erosional stage of the watershed (Sreedevi et al., Citation2004; Thomas et al., Citation2010). The increase in the Rl values from lower to higher orders may be indicative of attainment of geomorphic maturity (Thomas et al., Citation2010).
4.1.8. Bifurcation ratio (Rb)
Bifurcation ratio (Rb) can be defined as the ratio of the number of stream segments of a given order to the number of segments of the next higher order (Schumm, Citation1956). Horton (Citation1945) considered the bifurcation ratio as an index of relief and dissections. It is also considered as measure of the degree of ramification of drainage network and exercises a significant control over the infirmity of runoff (Chorley, Malm, & Pogorzelski, Citation1957; Mesa, Citation2006). According to Strahler (Citation1957), the bifurcation ratio shows a small range of variation for different regions or different environmental conditions, except where the geology dominates. In general, it is observed that Rb is not the same from one order to its next higher order.
For the studied basin mean calculated value of Rb is 2.86, which varying from 1.58 to 4 accordingly. The Rb value in the case of first to second order is 1.58 < 3 showing drainage network formed in homogeneous terrain but second to third order is 4.0 and third to fourth orders is 3.0 showing some structural disturbances (). Usually all these values are less than 10 indicating that the geologic structures do not exercise a dominant influence on the drainage pattern of the river basin (Thomas et al., Citation2010). The variations in the Rb values also reflect differences in the shape of the stream network (Rai et al., Citation2018; Singh & Kanhaiya, Citation2015; Thomas et al., Citation2010). The Rb values for the higher order (second/third and third/fourth) showing typical characteristics of the shear zone. The morphometric analysis of Achankovil River, flowing through the Achankovil Shear Zone in the Southern Kerala, reported Rb values in the range of 3.46 and 5.50 (Manu & Anirudhan, Citation2008). This result is also correlated and confirmed with the field survey.
4.1.9. Relief ratio (Rh)
The relief ratio (Rh) is ratio of maximum relief to horizontal distance along the longest dimension of the basin parallel to the main drainage line (Schumm, Citation1956). Relief ratio has a direct relation between the relief and channel gradient. Relief ratio measures the overall steepness of a drainage basin and is an indicator of the intensity of erosion process operating on slope of the basin (Schumm, Citation1956). In general, the relief ratio normally increases with decreasing drainage area and size of watersheds of a given drainage basin (Gottschalk, Citation1964; Thomas et al., Citation2010). Low values of relief ratios are generally due to the hard rock terrain in the catchment of the basin and/or low degree of basin slope (Rai et al., Citation2018; Singh & Kanhaiya, Citation2015).
The calculated value of Rh for the Dongar River Basin is 0.03 < 0.10, suggesting the exposure of the basement rocks as small ridges and mound with lower slope values (Thomas et al., Citation2010) (). The Rh of the studied basin is analogous to the Rh value of Muthirapuzha watershed of south Western Ghats, India (Rh = 0.05) studied by Thomas et al. (Citation2010). The Rh > 0.20 implies the presence of steeper slope and higher relief underlain by resistant bed rocks (Vittala et al., Citation2004). The Rh value is also correlatable with intensity of erosion developments functioning on the slopes and complete steepness of the river basin (Rai et al., Citation2018).
4.1.10. Elongation ratio (Re)
Schumm (Citation1956) defined elongation ratio as the ratio of diameter of a circle of the same area as the drainage basin and the maximum length of the basin. It is a measure of the shape of the river basin and mainly depends on the climatic and geological characteristics of a particular area. Values of Re generally vary from 0.6 to 1.0 over a wide variety of climatic and geologic types. Re values close to unity correspond typically to regions of low relief, whereas values in the range 0.6–0.8 are usually associated with high relief and steep ground slope (Strahler, Citation1964). These values can be grouped into three categories: circular (> 0.9), oval (0.9–0.8), and less elongated (< 0.7).
The Re value calculated for the Dongar River Basin is 0.86, indicating low-to-moderate slope and suggesting an oval shape of the basin (). Higher values of elongation ratio also display high infiltration capacity and low runoff, whereas lower Re values are considered by high susceptibility to erosion and sediment load (Reddy et al., Citation2004). The earlier study of the Son Basin by Rai et al. (Citation2017) reported that Re value of 0.55 indicates less elongated nature of the Son Basin along with high susceptibility to erosion and sediment load.
4.1.11. Drainage density (Dd)
Horton (Citation1932) reported that the drainage density (Dd) is an important indicator of the linear scale of landform elements in stream eroded topography. It is the ratio of total channel segment length cumulated for all order within a basin to the basin area, which is expressed in terms of km−1. The drainage density indicates the closeness of spacing of channels, thus providing a quantitative measure of the average length of stream channel for the whole basin. The low drainage density is more likely to occur in a region of highly resistant and permeable subsoil material under dense vegetative cover, and low relief . High drainage density is the resultant of weak or impermeable subsurface material, sparse vegetation, and mountainous relief. Low drainage density leads to coarse drainage texture, while high drainage density leads to fine drainage texture (Strahler, Citation1964).
The drainage density (Dd) of study area is 1.21 km−1 indicating moderate drainage density (). The moderate drainage density indicates that the basin has permeable subsoil and vegetative cover (Nag, Citation1998; Rai et al., Citation2017; Thomas et al., Citation2010). It also indicates the higher dissected drainage basin with a comparatively quick hydrological response compare to low drainage density (Melton, Citation1957).
4.1.12. Stream frequency (Sf)
Stream frequency (Sf) is expressed as the total number of stream segments of all orders per unit area (Horton, Citation1932). It exhibits positive correlation with drainage density in the watershed indicating an increase in stream population with respect to increase in drainage density. Reddy et al. (Citation2004) identified that low values of Sf designate occurrence of permeable subsurface material and low surface relief.
The calculated value of Sf for Dongar River Basin is 1.02 (). On the other hand, earlier study by Rai et al. (Citation2017) reported 0.10 value of stream frequency for its trunk river Son. But the stream frequency of Dongar River Basin is more or less similar to the other sub basins of the Son like Gopad (0.99) and Banas River (0.87) (Rai et al., Citation2017).
4.1.13. Form factor (Rf)
According to Horton (Citation1932), form factor (Rf) is nothing but the ratio of the basin area to the square of the basin length. The Rf indicates the flow intensity of a basin of a defined area (Horton, Citation1945). In general, the form factor value is always less than 0.78 (the value for perfectly circular basin). The smaller the value of the form factor, the more elongated will be the basin. Basin with high form factors experience larger peak flows of shorter duration, whereas elongated watersheds with low form factors experience lower peak flows of longer duration.
The Rf value for Dongar River Basin is 0.46, indicating elongated basin with lower peak flows of longer duration than the average (). Watershed morphology has a deep impact on watershed hydrology (Tucker & Bras, Citation1998). The Rf value of the Dongar River is more than other tributaries (Koyal, Kanhar, Rihnad, Gopad and Banas) of the Son River. (see Rai et al., Citation2017 for the Rf values of the Son River and other tributaries).
4.1.14. Circularity ratio (Rc)
Circularity ratio is the ratio of the area of a basin to the area of circle having the same circumference as the perimeter of the basin (Miller, Citation1953). It is influenced by the length and frequency of streams, slope, geological structures, and climatic condition of the area. It is also an indicator of the dendritic stage of the watershed. Low, medium, and high values of Rc show the young, mature, and old phases of the cycle of the tributary watershed (John Wilson, Chandrasekar, & Magesh, Citation2012; Rai et al., Citation2018).
The Rc value of the Dongar River Basin is 0.13 () similar to its trunk river Son which indicates the basin is at an early stage of topographical maturity. All the above shape-related factors significantly affect the hydrological response of the watersheds as basin-shaped and the preparation of stream segments combines to impact the size and shape of flood peaks (Ward & Robinson, Citation2000).
4.1.15. Length of overland flow (Lg)
The length of overland flow (Lg) is the length of water over the ground surface before it gets concentrated into definite stream channel (Horton, Citation1945). Lg is one of the most important independent variables affecting hydrologic and physiographic development of drainage basins (Horton, Citation1932). The length of overland flow is approximately equal to the half of the reciprocal of drainage density. This factor is related inversely to the average slope of the channel and is quiet synonymous with the length of sheet flow to a large degree (Singh & Kanhaiya, Citation2015).
The Lg value of the studied basin is 0.41 indicating steeper slope and smaller flow path (). Meanwhile, its trunk river Son and other tributaries have Lg values greater than Dongar Basin, suggesting gentler slopes and longer flow paths. The Lg values of Son and other tributary rivers also designate that runoff will take very less time to reach outlet. Thus, the Dongar River Basin shall be more vulnerable to flash flooding as compared to the trunk river Son and its other tributaries, i.e., Koyal, Kanhar, Rihnad, Gopad, and Banas Rivers (Rai et al., Citation2018, Citation2017).
4.1.16. Ruggedness number (Rn)
The ruggedness number (Rn) is expressed as the product of the basin relief and drainage density (Strahler, Citation1958). In general, ruggedness is measurement of unevenness of the basin surface and dependent on standard deviation of altitude, slope convexity, variability of contour curvature, and/or the measure of topographic texture (Rai et al., Citation2018; Thomas et al., Citation2010).
The Rn value calculated for the Dongar River Basin is 0.35 (), suggesting low relief of the basin. The low value of the ruggedness number of the river basin indicates that area is less prone to soil erosion and also has less intrinsic structure complexity associated with relief and drainage density (Vijith & Satheesh, Citation2006).
4.1.17. Melton ruggedness ratio (MRn)
The slop index that provides specialized representation of relief ruggedness within the river basin is known as Melton ruggedness ratio (Melton, Citation1957, Citation1965). Dongar River Basin has an MRn of 0.04, as shown in . The low value of MRn suggests little variation in the relief ruggedness within the watershed. The low ruggedness also indicates the availability of loci suitable to trap debris from upstream areas and out of tributaries dominated by debris flow, causing a transition from debris flow to bed load transport (Marchi & Fontana, Citation2005).
4.2. Active tectonics
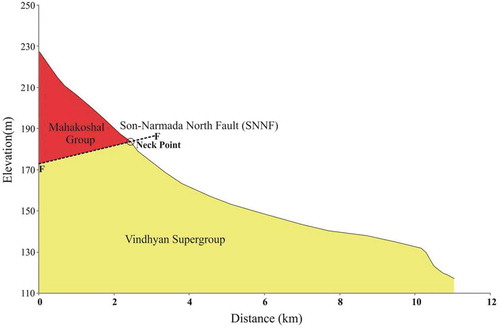
For evaluating the structure and tectonics of the Dongar River Basin; longitudinal profiles, asymmetry factors (AF) and lineament analysis have been taken into account along with other morphotectonic units. Longitudinal profiles result from the interaction between lithology change (Duvall, Kirby, & Burbank, Citation2004; Stock & Montgomery, Citation1999), base level change, and tectonics (Brocard, van der Beek, Bourles, Siame, & Mugnier, Citation2003; Gelabert, Fornos, Pardo, Rosello, & Segura, Citation2005; Snyder, Whipple, Tucker, & Merritts, Citation2000). Channel longitudinal profile illustrates tectonic activity through their channel morphology because streams and channels are most sensitive sensor to record any disturbances on sub surface and surface level.
In longitudinal profile, the knick point locations are indicator of sharp change in river gradient. River profile record long-term system equilibrium (Ritter, Kochel, & Miller, Citation2002), and rivers that are in equilibrium exhibit a concave upward shape where higher order streams have lower gradients, than lower order streams (Keller & Pinter, Citation2002). In the present study, the knick point has been occurred at 2.8 km and 182 m elevation from the source of the river (). Knick points i.e. the steep reaches in the longitudinal profile, can be caused by more resistant lithology or by an increase in shear stress or by surface uplift (Bishop, Hoey, Jansen, & Lexartza Artza, Citation2005). This knick point corresponds to the lithology variation; but since longitudinal profile of Dongar River show uneven gradients in small distance, it appears that this river basin may be in influence of some active tectonics.
Figure 4. Longitudinal profile of the Dongar River Basin, Son Valley, Central India.
AF includes directions of possible lateral tilting of a basin with respect to the river (Cox, Citation1994; Cuong & Zuchiewicz, Citation2001; Hare & Gardner, Citation1985; Prakash et al., Citation2017c). AF is calculated as 100 (Ar/At), where Ar = Area of the right side of the trunk stream, and At = total area of the drainage basin. If AF > 50 then river has shifted towards the left side, and AF< 50 then river has shifted towards the right side of the drainage basin (Molin, Pazzaglia, & Dramis, Citation2004). For Dongar River Basin, area of the right side of the trunk stream (Ar) is 22.32 km2 and total area of the drainage basin (At) is 35.18 km2. The Dongar River Basin has AF 63.44 showing that channel shifted towards left side of the basin (West ward).
In evaluating the nature of tectonic forces responsible for diastrophism and for determining the style and dimension of subsurface structures, data on lineaments are of significant value. In Precambrian terrains lineaments analysis is especially useful where outcrops are poor, and also where diastrophic effects are not clearly manifested because of feeble nature of stresses (Powar & Patil, Citation1983). In Dongar river basin, the lineaments have shown modal frequency maxima lying in ENE-WSW () direction which is almost parallel to the strike of the SNNF (Son-Narmada North Fault), Markundi Fault, and SNSF (Son-Narmada South Fault). In accordance with Singh (Citation2014) from the seismotectonics approach, the Narmada–Son lineament region is known to be a significantly disturbed zone. The 6.0M Jabalpur earthquake of 22 May 1997 is associated with the reactivation of SNSF (Son-Narmada South Fault). It is, therefore, inferred that the genesis of the lineaments of Dongar basin may be related to the stress system of the Son-Narmada mega lineament zone and are generated perhaps due to reactivation of any of its component such as SNNF (Son-Narmada North Fault), SNSF (Son-Narmada South Fault) and/or Markundi Fault in the recent geological past.
Figure 5. Lineament trends (ENE–WSW) of the Dongar River Basin, Son Valley, Central India.
5. Conclusion
GIS and remote-sensing techniques have proved to be accurate and efficient tool in drainage delineation and their interpretation. Bifurcation ratio, length ratio, and stream order of the Dongar River Basin indicate that the basin is of fourth order with trellis and dendritic to sub-dendritic drainage patterns. These parameters also indicate some structural or tectonic control may be due to the reactivation of Son Narmada Lineament Zone. Some secondary deformations occured in the basin may be the reflection of palaeo-seismic activities, that might have taken place in the recent geological past. The major lineaments of the river basin are analogous to SNNF (Son-Narmada North Fault), Markundi Fault, and SNSF (Son-Narmada South Fault) may be the testimony of the effect of reactivation of Son Narmada Lineament Zone within the Dongar River Basin. Relief ratio, Ruggedness number, and visual interpretation of DEM of the study area indicate low-to-moderate relief and slope, low runoff, and high infiltrations with early-mature stage of erosion . Drainage density, circulatory ratio, and elongation ratio show that texture of the basin is moderate and oval in shape. The complete morphometric analysis of drainage basin indicates that the Dongar River Basin might have been under the influence of active tectonics. As far as societal claims are concerned, the Dongar River Basin has good groundwater prospect and the study is very helpful for water management and infrastructure development in the near future.
Acknowledgments
The authors are grateful to the Head, CAS in Geology, Banaras Hindu University for providing GIS laboratory and computing facilities. The research fellowships from UGC (University Grant Commission) and DST (Department of Science and Technology), New Delhi, India are thankfully acknowledged.
Disclosure statement
No potential conflict of interest was reported by the authors.
References
- Band, L. E. (1986). Topographic partition of watersheds with digital elevation models. Water Resource Research, 22, 15–24.
- Bishop, P., Hoey, T. B., Jansen, J. D., & Lexartza Artza, I. (2005). Knick-point recession rateand catchment area: The case of uplifted rivers in eastern Scotland. Earth Surface Processes and Landforms, 30, 767–778.
- Brocard, G. Y., van der Beek, P. A., Bourlès, D. L., Siame, L. L., & Mugnier, J. L. (2003). Long-termfluvial incision rates and postglacial river relaxation time in the French westernAlps from10Be dating of alluvial terraces with assessment of inheritance, soil development and wind ablation effects. Earth and Planetary Science Letters, 209, 197–214.
- Burrough, P. A. (1986). Principles of geographical information systems for land resources assessment (pp. 50). New York: Oxford University Press.
- Chorley, R. J., Malm, D. E. G., & Pogorzelski, H. A. (1957). A new standard for estimating drainage basin shape. American Journal of Science, 255, 138–141.
- Clarke, J. I. (1996). Morphometry from maps. Essays in geomorphology (pp. 235–274). New York, NY: Elsevierpublication Co.
- Cox, R. T. (1994). Analysis of drainage-basins symmetry as rapid technique to identify areas of possible quaternary tilt-block tectonics: An example from Mississippi Embayment. Geological Society of America Bulletin, 106, 571–581.
- Cuong, N. Q., & Zuchiewicz, W. A. (2001). Morphotectonic properties of the Lo River fault near Tam Dao in North Vietnam. Natural Hazards and Earth System Sciences, 1, 15–22.
- Duvall, A., Kirby, E., & Burbank, D. (2004). Tectonic and lithologic controls on bedrock channelprofiles and processes in coastal California. Journal of Geophysical Research, 109, F03002.
- Gayen, S., Bhunia, G. S., & Shi, P. K. (2013). Morphometric analysis of Kangshabati-Darkeswar interfluves area in West Bengal, India using ASTER DEM and GIS techniques. Geology and Geoscience, 2(4), 1–10.
- Gelabert, B., Fornos, J. J., Pardo, J. E., Rosello, V. M., & Segura, F. (2005). Structurally controlleddrainage basin development in the south of Menorca (western Mediterranean, Spain). Geomorphology, 65, 147–170.
- Gottschalk, L. C. (1964). Reservoir sedimentation. In V. T. Chow (Ed.), Handbook of Applied Hydrology (pp. 1–33). New York: McGraw Hill Book Company.
- Gurnell, A. M., & Montgomery, A. R. (1999). Hydrological application of GIS (pp. 176). Chichester: F, Wiley.
- Hare, P. W., & Gardner, T. W. (1985). Geomorphic indicators of vertical neotectonism along converging plate margins, Nicoya Peninsula, Costa Rica. In M. Morisawa & J. T. Hack (Eds.), Tectonic Geomorphology: Proceedings of the 15th Annual Binghamton Geomorphology symposium (pp. 90–104). Boston: Allen @ Unwin.
- Horton, R. E. (1932). Drainage basin characteristics. Transactions American Geophysical Union, 13, 350–361.
- Horton, R. E. (1945). Erosional development of streams and their drainage basins: Hydrophysicalapproach to quantitative morphology. Geological Society of America Bulletin, 56, 275–370.
- John Wilson, J. S., Chandrasekar, N., & Magesh, N. S. (2012). Morphometric analysis of majorsub-watersheds in Aiyar and Karai Pottanar Basin, central Tamil Nadu, India usingremote sensing and GIS techniques. Bonfring International Journal of Industrial Engineering and Management Science, 2(1), 8–15.
- Kanhaiya, S., Singh, B. P., Singh, S., Mittal, P., & Srivastava, V. K. (2018). Morphometric analysis, bed-load sediments, and weathering intensity in the Khurar River Basin, central India. Geological Journal, 1–16. doi:10.1002/gj.3194
- Kaushik, P., & Ghosh, P. (2015a). 3D DEM delineation of Chambal river basin from SRTM data using remote sensing and GIS technology. International Journal of Remote Sensing & Geoscience, 4(4), 1–6.
- Kaushik, P., & Ghosh, P. (2015b). Geomorphic Evolution of Chambal River Origin in Madhya Pradesh using Remote Sensing and GIS. International Journal of Advanced Remote Sensing and GIS, 4(1), 1130–1141.
- Kaushik, P., & Ghosh, P. (2018a). Morphometric Analysis of Mej Sub-Basin, Rajasthan, India, using Remote Sensing & GIS Applications. International Journal of Creative Research Thoughts, 6(1), 1379–1392.
- Kaushik, P., & Ghosh, P. (2018b). Morphometric Analysis of Shipra River Sub-Basin, India, Remote Sensing and GIS Approach. International Journal of Creative Research Thoughts, 6(1), 1536–1546.
- Keller, E. A., & Pinter, N. (2002). Active tectonics. Earthquakes, uplift, and landscape (pp. 362). New Jersey: Prentice Hall.
- Macka, Z. (2001). Determination of texture of topography from large scale contour maps. Geografski Vestnik, 73(2), 53–62.
- Magesh, N. S., & Chandrasekar, N. (2014). GIS model-based morphometric evaluation of Tamiraparani sub-basin, Tirunelveli district, Tamil Nadu, India. Arabian Journal of Geosciences, 7, 131–141.
- Magesh, N. S., Chandrasekar, N., & Soundranayagam, J. P. (2011). Morphometric evaluation of Papanasam and Manimuthar watersheds, parts of Western Ghats, Tirunelveli district, Tamil Nadu, India: A GIS approach. Environmental Earth Science, 64, 373–381.
- Maidment, D. R. (2002). Arc hydro GIS for water resources. California: ESRI Press.
- Manu, M. S., & Anirudhan, S. (2008). Drainage characteristics of Achankovil River basin, Kerala. Journal of Geological Society of India, 71, 841–850.
- Marchi, L., & Fontana, G. D. (2005). GIS morphometric indicators for the analysis of sediment dynamics in mountain basins. Environmental Geology, 48, 218–228.
- Melton, M. A. (1957). An analysis of the relations among the elements of climate, surface properties and geomorphology (Technical Report 11). New York: Department of Geology, Columbia University.
- Melton, M. A. (1965). The geomorphic and paleoclimatic significance of alluvial deposits in southern Arizona. Journal of Geology, 73, 1–38.
- Mesa, L. M. (2006). Morphometric analysis of a subtropical Andean basin (Tucuman, Argentina). Environmental Geology, 50, 1235–1242.
- Miller, V. C. (1953). A quantitative geomorphic study of drainage basin characteristics in the Clinch mountain area, Virginia and Teimessee, Proi NR 389-402 (Technical Report 3). New York: Columbia University.
- Molin, P., Pazzaglia, F. J., & Dramis, F. (2004). Geomorphic expression of the active tectonics in a rapidly-deforming forearc, sila Massif, Calabria, Southern Italy. American Journal of Science, 304, 559–589.
- Morris, D. S., & Heerdegen, R. G. (1988). Automatically derived catchment boundaries and channel networks and their hydrological applications. Geomorphology, 1, 131–141.
- Nag, S. K. (1998). Morphometric analysis using remote sensing techniques in the Chaka sub-basin, Purulia district, West Bengal. Journal of Indian Society of Remote Sensing, 26(1–2), 69–76.
- Nag, S. K., & Chakraborty, S. (2003). Influence of rock type and structure in the development of drainage network in hard rock area. Journal of Indian Society of Remote Sensing, 31(1), 625–635.
- Ozdemir, H., & Brid, D. (2009). Evaluation of morphometric parameters of drainage networks derived from topographic maps and DEM in point of flood. Environmental Geology, 56, 1405–1415.
- Pareta, K., & Pareta, U. (2011). Quantitative morphometric analysis of a watershed of Yamuna Basin, India using ASTER (dem) data and GIS. International Journal of Geomatics Geosciences, 2(1), 248–269.
- Patton, P. C. (1988). Drainage basin morphometry and flood. In V. R. Baker, R. C. Kochel, & P. C. Patton (Eds.), Flood geomorphology (pp. 51–65). USA: Wiley.
- Powar, K. B., & Patil, D. M. (1983). Lineaments, their mapping and analysis. NAGI annuals, 2, 1–17.
- Prakash, K., Chaubey, K., Singh, S., Mohanty, T., & Singh, C. K. (2017a). Morphometric analysis of the Satna River Basin, Central India. Indian Journal of Geomorphology, 22, 41–60.
- Prakash, K., Mohanty, T., Pati, J. K., Singh, S., & Chaubey, K. (2017b). Morphotectonics of the Jamuna River basin, Bundelkhand Craton, Central India; using remote sensing and GIS technique. Applied Water Science, 7, 3767–3782.
- Prakash, K., Mohanty, T., Singh, S., Chaubey, K., & Prakash, P. (2016b). Drainage morphometry of the Dhasan river basin, Bundelkhand craton, central India using remote sensing and GIS techniques. Journal of Geomatics, 10, 21–132.
- Prakash, K., Singh, S., Mohanty, T., Chaubey, K., & Singh, C. K. (2017c). Morphometric assessment of Gomati river basin, middle Ganga plain, Uttar Pradesh, North India. Spatial Information Research, 25, 449–458.
- Prakash, K., Singh, S., & Shukla, U. K. (2016a). Morphometric changes of the Varuna river basin, Varanasi district, Uttar Pradesh. Journal of Geomatics, 10(1), 48–54.
- Rai, P. K., Chandel, R. S., Mishra, V. N., & Singh, P. (2018). Hydrological inferences through morphometric analysis of lower Kosi river basin of India for water resource management based on remote sensing data. Applied Water Science, 8, 1–15.
- Rai, P. K., Mishra, V. N., & Mohan, K. (2017). A study of morphometric evolution of the Son basin, India using geospatial approach. Remote Sensing Applications: Society and Environment, 7, 9–20.
- Reddy, G. P. O., Maji, A. K., & Gajbhiye, K. S. (2004). Drainage morphometry and its influence on landforms characteristics in basaltic terrain, central India: A remote sensing and GIS approach. International Journal ofApplied Earth Observation and Geoinformation, 6, 1–16.
- Ritter, D. F., Kochel, R. C., & Miller, J. R. (1995). In process geomorphology. Dubuque: William C. Brown.
- Ritter, D. F., Kochel, R. C., & Miller, J. R. (2002). Process geomorphology. Long Grove, IL: Wavel and Press.
- Rudraiah, M., Govindaiah, S., & Srinivas, V. S. (2008). Morphometry using remote sensing and GIS techniques in the sub-basins of Kagna river basin, Gulburga district, Karnataka, India. Journal of Indian Society of Remote Sensing, 36, 351–360.
- Schidggar, A. E. (1970). Theoretical geomorphology (2nd ed.). Berlin-Heidelberg: Springer.
- Schumm, S. A. (1956). Evolution of drainage system and slopes in badlands at Perth Amboy, NEW Jessey. Geological Society of America Bulletin, 67, 597–646.
- Senadeera, K. P. G. W., Piyasiri, S., & Nandalal, K. D. W. (2001). The evolution of morphometric characteristics of Kotmale Reservoir catchment using GIS as a tool, Sri Lanka. The International Archives of Photogrammetry, Remote Sensing and Spatial Information Sciences, 34(3), 1–3.
- Singh, C. K. (2014). Active deformations extracted from drainage geomorphology: A case study from Southern Sonbhadra District, Central India. Journal Geological Society of India, 84, 569–578.
- Singh, S., & Kanhaiya, S. (2015). Morphometry of the Barakar River Basin, India: A remote sensing and GIS approach. International Journal of Current Research, 7(7), 17948–17955.
- Singh, S., Kanhaiya, S., Singh, A., & Chaubey, K. (2018a). Drainage network characteristics of the Ghaghghar River Basin (GRB), Son Valley, India. Geology, Ecology & Landscapes, 1–9. doi:10.1080/24749508.2018.1525670
- Singh, S., Kumar, S., Mittal, P., Kanhaiya, S., Prakash, P., & Kumar, R. (2018b). Drainage basin parameters of Bagh River, a sub-basin of Narmada River, Central India: Analysis and implications. Journal of Applied Geochemistry, 20(1), 91–102.
- Snyder, N. P., Whipple, K. X., Tucker, G. E., & Merritts, D. J. (2000). Landscape response to tectonicforcing: DEM analysis of stream profiles in the Mendocino triple junction, Northern California. Geological Society of America Bulletin, 112, 1250–1263.
- Sreedevi, P. D., Subrahmanyam, K., & Ahmed, S. (2004). The significance of morphometry analysis for obtaining groundwater potential zones in a structurally controlled terrain. Environmental Geology, 47, 417–420.
- Sreedevi, P. D., Subrahmanyam, K., & Ahmed, S. (2005). Integrated approach for delineating potential zones to explore for groundwater in the Pageru River basin, Kuddapah District, Andhra Pradesh, India. Hydrogeology Journal, 13, 534–543.
- Stock, J. D., & Montgomery, D. R. (1999). Geologic constraints on bedrock river incision using the stream power law. Journal of Geophysical Research: Solid Earth, 104(B3), 4983–4993.
- Strahler, A. (1957). Quantitative analysis of watershed geomorphology. Transactions, American Geophysical Union, 38, 913–920.
- Strahler, A. N. (1952). Hypsometric (area-altitude) analysis of erosional topography. Bulletin of Geological Society of America, 63, 1117.
- Strahler, A. N. (1958). Dimensional analysis applied to fluvially eroded landforms. Geological Society of America Bulletin, 69, 279–300.
- Strahler, A. N. (1964). Quantitative geomorphology of drainage basin and channel networks. In V. T. Chow (Ed.), Handbook of applied hydrology (pp. 4–76). New York: McGraw Hill Book Company.
- Thomas, J., Joseph, S., & Thrivikramaji, K. P. (2010). Morphometric aspects of the small tropical mountain river system, the southern Western Ghats, India. International Journal of Digital Earth, 3(2), 135–156.
- Tucker, G. E., & Bras, R. L. (1998). Hill slope processes, drainage density and landscape morphology. Water Resources Research, 34(10), 2751–2764.
- Verstappen, H. T. (1983). Applied geomorphology‐geomorphological surveys for environmental development (pp. 57–83). New York: Elsevier.
- Vijith, H., & Satheesh, R. (2006). GIS based morphometric analysis of two major upland sub-watersheds of Meenachil River Kerala. Journal of Indian Society of Remote Sensing, 34(2), 181–185.
- Vittala, S. S., Govindaiah, S., & Honne, G. H. (2004). Morphometric analysis of sub-watersheds in the Pawagada area of Tumkur district South India using remote sensing and GIS techniques. Journal of Indian Society of Remote Sensing, 32, 351–362.
- Vittala, S. S., Govindaiah, S., & Honne, G. H. (2006). Digital Elevation Model (DEM) for identification of ground water prospective zones. Journal of Indian Society of Remote Sensing, 34, 305–310.
- Ward, R. C., & Robinson, M. (2000). Principles of hydrology (4th ed.). Maidenhead: McGraw-Hill.