
ABSTRACT
Lithological mapping using satellite images, particularly the Advanced Spaceborne Thermal Emission and Reflection Radiometer (ASTER) data help in effectively defining the best initial targets for regional exploration. ASTER data allow for the discrimination of rock units in the broader region. This research work is focused on the use of remote sensing techniques for geological mapping using ASTER satellite image and generating a geological map of Sangan region. The study area is located in southeast of Khorasan-e-Razavi province and at the eastern edge of the Khaf-Kashmar-Bardskan Volcano-Plutonic Metallogenic Belt in northeast Iran. Band ratio (BR), spectral angle mapper (SAM) and support vector machines (SVMs) methods were used for classifying the main lithologic units in Sangan region. The results of BR, SAM and SVM techniques were quantitatively compared with geological boundaries mapped in the field showing an accuracy of nearly 79 %. SVMs method, in comparison to conventional methods of classification, was known to provide superior results. As the final result of this research, integration of remote sensing and field investigations led to generating high accuracy geological map in the Sangan region. Application of the methods has invaluable implications for geological mapping and mineral exploration in inaccessible regions.
1. Introduction
The importance of recognizing the spatial patterns of geological mapping makes remote sensing one of the standards and most successful procedures in exploration geology. Remote sensing is a very powerful and essential tool for geologists that can be applied to improve regional geological mapping process (Pour & Hashim, Citation2015). Remote sensing satellite imagery has high potential to provide a solution to overcome the problems and limitations associated with geological field mapping and mineral exploration. Recent development of multi-spectral remote sensing systems such as the Advanced Spaceborne Thermal Emission and Reflection Radiometer (ASTER) have shown the application of remote sensing satellite imagery for geological mapping with various purposes in the world (Di Tommaso & Rubinstein, Citation2007; Liu, Zhou, Jiang, Zhuang, & Mansaray, Citation2014; Masoumi, Eslamkish, Abkar, Honarmand, & Harris, Citation2017; Pour, Hashim, Hong, & Park, Citation2017; Van Ruitenbeek, Cudahy, Van der Meer, & Hale, Citation2012). The interpretation of satellite images for geological mapping is normally based on the indirect evidence that can be visible at the surface (Pour, Hashim, & Marghany, Citation2011). Remote spectral geology images have been processed for enhancing and understanding the geology in a regional scale. Thus, application of ASTER images helps greatly in improving the product when working on regional scale geological maps. Numerous research works have used ASTER data in geological mapping and discrimination of rock units during the last decade mainly due to spectral characteristics of the unique integral bands of ASTER in the visible/near-infrared (VNIR), shortwave infrared (SWIR) and thermal infrared (TIR) parts of the electromagnetic spectrum and the possibility of applying several image processing algorithms (Hewson, Robson, Carlton, & Gilmore, Citation2017).
In the Sangan region, due to harsh conditions and logistic difficulties, many areas remain poorly studied from geological mapping and mineral exploration point of view. Thus, the ASTER multispectral remote sensing data are used for geological mapping objectives and improving the coverage and overall quality of geological information in this region.
In this research, we apply the ASTER remote sensing data because of specific characteristics of ASTER bands along with some other conventional and sophisticated image processing techniques to extract geological information and lithologic units. Different image processing techniques such as band Ratio (BR), spectral angle mapper (SAM) and support vector machines (SVMs) are used to ASTER bands for geological mapping and discrimination of the exposed rock units based on satellite images in the study area. These enhancement techniques combined with the field observations and previous geological maps of the study area, allowed distinguishing between different rock units. This research aims at prediction of geologically significant patterns from ASTER data in support of fieldwork planning and map compilation.
2. Location and geological setting of the study area
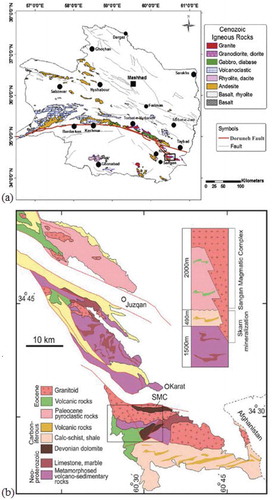
The study area is located in southeast of Khorasan-e-Razavi province in Iran and in the end section of the Khaf-Kashmar-Bardskan Tertiary magmatic belt of Central Iran blocks that lies between longitudes 60° 10′ 00″ to 60° 50′ 00″ E and latitudes 34° 10′ 00″ to 34° 50′ 00″ N, NE Iran. The geology of this belt mainly includes Cenozoic silicic to mafic volcanic rocks, which have been intruded by granitoid units of granitic to dioritic composition ()). There are a number of iron ore deposits with considerable reserve amounts in the study area. The Sangan iron skarn is one of the most important deposits. Information on the regional geology of the Sangan Magmatic Complex (SMC) area has been presented by Golmohammadi, Karimpour, Malekzadeh Shafaroudi, and Mazaheri (Citation2014); Sepidbar, Mirnejad, and Mi (Citation2018). The oldest rocks in the Sangan region include a thick pile (1500 m) of Late Neoproterozoic volcano – sedimentary rocks with limestone – marble interlayers, overlain stratigraphically by Devonian and Carboniferous dolomites, shales and calc–schists in the southern parts of the SMC ()). These sedimentary rocks are unconformably covered by the SMC volcanic and pyroclastic rocks and/or intruded by granitoids. The carbonate rocks of Jurassic consist of crystalline and less dark dolomite limestone that spread all over the area (Mazhari, Malekzadeh Shafaroudi, & Ghaderi, Citation2017). The SMC includes 2000 m of volcanic, pyroclastic rocks cross-cut by plutonic rocks (Sepidbar et al., Citation2018). It is subdivided into two major units, according to the geographical position and rock types: (1) the southern SMC unit, including volcanic and volcanoclastic rocks with minor intrusive rocks; and (2) the northern SMC unit, predominantly comprising granitoid intrusions ()). The depressions between the ranges are filled in by thick Neogene sediments (Fauvelet & Eftekhar-Nezhad, Citation1990). Occurrences of iron mineralization are present in several places in the study area, including small and large bodies of magnetite in relationship with skarn-type rocks (Rezaei, Hassani, Moarefavand, & Golmohammadi, Citation2019). The SMC includes several ore bodies in east-west direction. Based on characteristics of ore deposits this mining region is divided into western (subdivided into A, Aʹ, B, CS (C-South), and CN (C-North)), central (subdivided into Baghak (BA) and Dardvey (D)) anomalies and eastern anomaly (subdivided Senjedak 1, 2, 3; Madanjoo, Som–Ahanai and Ferezneh) (Rezaei et al., Citation2019). The Sangan iron skarn deposits are distributed along the contact zone between the Jurassic clastic rocks or Cretaceous carbonates and the Eocene igneous rocks (Malekzadeh Shafaroudi, Karimpour, & Golmohammadi, Citation2013). The structural features of the region such as faults and foldings, as well as the strike of the formations follow the E–W to NW–SE direction of the major Doruneh fault (Golmohammadi et al., Citation2014).
Figure 1. (a) The Khaf-Kashmar-Bardskan Volcano-Plutonic Belt and Doruneh fault (Malekzadeh Shafaroudi et al., Citation2013); and (b) geological map of the study area and Sangan Magmatic Complex (modified after 1:250,000 geological map of Taybad, Geological Survey of Iran) (Sepidbar et al., Citation2018).
3. Material and methods
Data sources for this study included remote sensing data (ASTER image), regional geological material (geological map at a scale of 1:250,000 and relevant documentation) and ground survey data. Also, Geoscience dataset used in the compilation of a remote predictive geological map of the study area includes SMC geological map at a scale of 1:50,000.
ENVI (Environment for Visualizing Images) version 4.8 and ArcGIS 10.3 software packages were used to process the ASTER imagery and preparation of GIS layers, respectively.
3.1 Satellite remote sensing data
The ASTER data are commonly used in geological application. ASTER is a multispectral imaging sensor that measure reflected and emitted electromagnetic radiation from Earth’s surface and atmosphere in 14 bands. Consisting of three separate instrument subsystems, ASTER provides observation in three different spectral regions of the electromagnetic spectrum, including the VNIR, SWIR and TIR bands (). ASTER swath width is 60 km (each individual scene covers 60 × 60 km2 area of land) making it a useful tool for regional geological mapping (Abrams, Hook, & Ramachandran, Citation2004). ASTER provides more spectral bands in the SWIR, which therefore increases its ability to spectrally discriminate minerals and rocks on the Earth’s surface. Reflectance measurements in the VNIR till the SWIR wavelength region provide diagnostic information that can be used to identify rocks and their constituent minerals (Hunt, Citation1977). These data enhance the capability of lithologic discrimination between different rock units. Spectral bands of ASTER have great ability to map hydrothermal alteration mineral zones and lithologic units (Pour, Hashim, Park, & Hong, Citation2017a, Citation2017b; Safari, Maghsodi, & Pour, Citation2017). In this research, six spectral bands of the SWIR region and three spectral bands of the VNIR region were selected for the processing. As a result and starting from 2000, ASTER data has been successfully used for lithologic mapping in well-exposed areas.
Table 1. ASTER spectral passband characteristics (Di Tommaso & Rubinstein, Citation2007).
3.2 Pre-processing steps of ASTER data
The ASTER images used in this study have been pre-georeferenced to UTM zone 41 North projection using the WGS-84 datum. Pre-processing steps of ASTER data mainly include removing crosstalk effects, re-sampling and stacking, radiometric calibration and atmospheric correction. Crosstalk correction was performed with the ASTER SWIR bands, aimed at removing the effects of energy overspill from band 4 into bands 5 and 9 (Iwasaki & Tonooka, Citation2005; Mars & Rowan, Citation2011). The ASTER SWIR data with a 30-m spatial resolution was re-sampled at 15-m to fit with VNIR data applying a bilinear method. Thus, the VNIR and SWIR bands were combined to form nine bands at 15-m spatial resolution. Afterwards, radiometric calibration and atmospheric correction were executed. At the Radiometric calibration, the digital numbers (DN) in the pixel of the original image were 16-bit integers. Radiometric calibration converted the data of the observed surface into physical radiance. While the wavelength range is an atmospheric window, there is atmospheric influence, including scattering, absorbing, attenuating energy, or changing the spectral distribution, which needs to be compensated for, especially for quantitative applications. Atmospheric correction was applied by Fast- Line-of-sight Atmospheric Analysis of Spectral Hypercubes (FLAASH) algorithm (Cooley et al., Citation2002) to the VNIR and SWIR bands of the ASTER.
3.3 Image processing methods for geological mapping
Geological mapping involves identification of types of rock and geologic structures that can contribute to each type of geological maps through analysis of imagery from one or more systems or instruments. It is useful to map the presence and distribution of rocks in a region for geological purposes. Lithologic units of exposed rocks are mapped using ASTER data, laboratory spectral reflectance measurements of rock samples and field observation in the study area. Four different image processing methods are applied: BR, FCC, SAM and SVMs.
3.3.1 Band ratio method
BR is one of the most important and suitable techniques for lithological mapping, while can be useful for highlighting certain features or materials that cannot be seen in raw bands. In this method, the choice of bands depends on their spectral reflectance and positions of the absorption bands of the mineral being mapped (Rajendran, Thirunavukkarasu, Balamurugan, & Shankar, Citation2012). The false color composites (FCCs) of band combinations and ratios are applied to enhance discriminations between different rock units. The interpretation of FCC images depends on how these bands are assigned to the three principal colors RGB used for the image display which in turn depends on the spectral characteristics of rocks (Ibrahim, Watanabe, & Yonezo, Citation2016). The spectral signature analysis is helpful to select the best bands in the ratio techniques. The choice of the most suitable combination of three bands can be carried out statistically (through an optimum index factor) or by referring to the extensive literature and taking into account lithologies in the region and finally provide an adequate base map (Patel & Kaushal, Citation2011).
BRs (4/7, 3/4, 2/1 as RGB) of ASTER images are selected for mapping metasediments, volcaniclastics and granitoids lithologic units in this research as recommended by Abdeen, Allison, Abdelsalam, and Stern (Citation2001). BRs (7/6, 6/5, 6/4 as RGB) are used for mapping gneiss domes and granites (Wolters, Goldin, Watts, & Harris, Citation2005). BRs (8/5, 5/4, 7/8 as RGB) are used for distinguishing alkali granites (younger granitoids), granodiorites and quartz diorite (old granitoids) (Madani & Emam, Citation2009).
3.3.2 Spectral angle mapper method
The SAM has been widely used for lithological mapping (Chen, Warner, & Campagna, Citation2007; Murphy, Monteiro, & Schneider, Citation2012). SAM algorithm is a supervised approach which identifies the various classes in the image based on the calculation of the spectral angle. The algorithm determines the angle between the spectra and treats them as vectors in n-dimensional space with dimensionality equal to the number of bands (Kruse et al., Citation1993). In the SAM method, image classification is performed based on calculation of the angle between image spectra and reference spectra. Reference spectra can be taken from the available spectral libraries and field observations (Kruse et al., Citation1993). The spectral angle is an average fit over the entire spectral range (or a subset of it) of the dataset used in classification (Hecker, Van der Meijde, Van der Werff, & Van der Meer, Citation2008). The SAM classification enhances the target reflectance characteristics and discriminates rock units. In lithological mapping studies using SAM method, each lithological class is assumed to have a unique spectral signature (Debba, Carranza, van der Meer, & Stein, Citation2006; Rowan, Crowley, Schmidt, & Mars, Citation2000) and the mean spectra of training samples of the class, which is considered as the representative of spectral feature of the class, is used as the reference spectra.
3.3.3 Support vector machine method
The SVM, a supervised classification method, was proposed by Vapnik (Citation1979) as a data-driven technique. One application of SVM in remote sensing field is for processing a specific type of imagery while their ability to successfully handle small training data sets, often producing a higher classification accuracy than the traditional methods (Mantero, Moser, & Serpico, Citation2005). The SVM uses a set of data vectors with known class labels acquired by a-priori knowledge to design a linear hyperplane for separating various classes. The data vectors are used as a training set, and every data vector within the set is characterized by unique features upon which the classification is based (Bishop, Citation2006). The SVM finds the optimal separating hyperplane between classes by focusing on the training cases. Once the optimal classifier is found, new data with unknown class information (test data) can be classified by the trained SVM based on their features (Smirnoff, Boisvert, & Paradis, Citation2008). SVMs have been used successfully in the mapping of similar lithological classes (Sahoo & Jha, Citation2016) mostly due to its ability to generate good classification results. The SVM approach enables us to discriminate between volcanic and sedimentary rocks (Othman & Gloagen, Citation2014). Training data in the study area are defined based on a combination of field observations, geological maps, BR and SAM results.
4. Discussion and results
In this research, lithologic mapping in the study area is carried out using an integrated interpretation of remote sensing data and geological field data. The first stage of image interpretation and mapping included the integrated empirical analysis of ASTER image and geological map data. Using the 1:250,000 scale geological map and image processing, a provisional geological map compilation was prepared before new fieldwork commences as remote predictive mapping. In this section, BR method used for geological mapping and FCC image are created to discriminate the various lithologies in the Sangan region. We applied various BRs that have previously been confirmed as useful ratios for detecting geological mapping. The BR images were integrated into one FCC image and were used to produce a geological map of the study area. Thus, using different combinations of BRs has updated the geological map of the Sangan region.
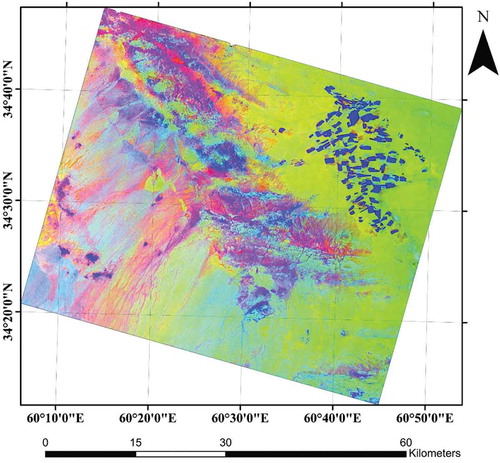
The BR (4/7, 3/4, 2/1 as RGB) results show that the granites are well separated from the adjacent rocks (). As displayed in , BRs (7/6, 6/5, 6/4 as RGB) were used for mapping granites. The 8/5, 5/4 and 8/7 BRs were also used in mapping and discrimination the different rock units in the study area. The metasedimentary rocks and granites are discriminated on ASTER image with 8/5 and 7/8 BRs respectively. Also, the 5/4 BR of ASTER data is useful for discrimination of muscovite granites. depicts the FCC image (8/5, 5/4, 7/8 as RGB) of ASTER data.
Figure 2. FCC image based on band ratios (4/7, 3/4, 2/1 as RGB) of ASTER data.
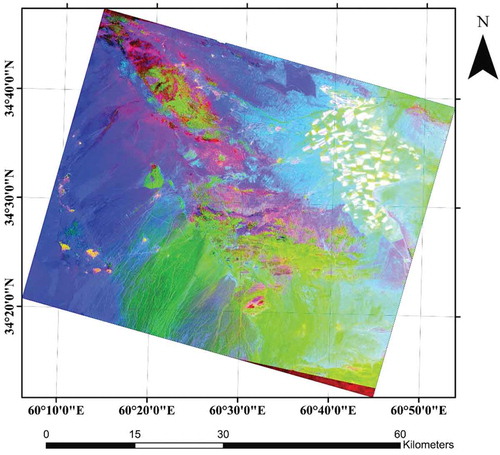
Figure 3. FCC image based on band ratios (7/6, 6/5, 6/4 as RGB) of ASTER data.
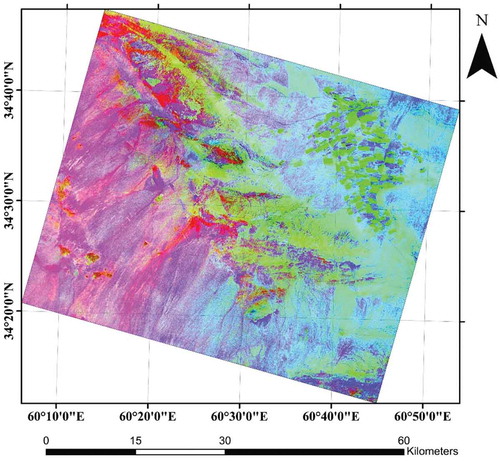
Figure 4. FCC image based on band ratios (8/5, 5/4, 7/8 as RGB) of ASTER data.
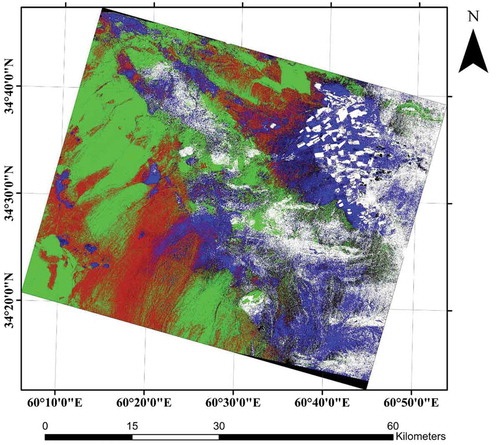
The SAM method was applied to ASTER scene covering in the Sangan region. The United State Geological Survey (USGS) spectral library of rock forming minerals was also used to evaluate the results of ASTER image spectral signature of the lithologic units in the study area. In addition, the mean spectra of all sample spectra of a lithology type was used as the reference spectra. For SAM, the spectra of the training samples of each lithologic unit class were averaged to construct a final class spectrum. The training and test samples were selected according to a published 1:250,000 geological map and SMC geological map. The field data were used together with the results of visual interpretation of different ASTER images to prepare a geological map for the Sangan region. The SAM classification result of lithological mapping is shown in , where four classes are distinguished and represented by blue, white, green and red classes, respectively. Comparison of these classes with the field observation and geological map indicates that the blue class includes dacite, andesite, green tuff, granitic rocks and associated colluvial and alluvial deposits. The intrusive rocks with northwest-southeast trend are often included in this class primarily, which is consistent with their granitic and granodioritic compositions (biotite granite, diorite and granodiorite), whereas they are not easily distinguished from the volcanic category, such as dacite, andesite and green tuff rocks. This class also includes a broad area of colluvial and alluvial material in northeastern and southeastern parts, which is derived from granitic–granodioritic rocks in the study area. The white category, which is the carbonate rocks (limestone, dolomite), matamorphed conglomerate, shale and sandstone classes, complex of meta-volcanosediment rocks and mixtures of carbonate and silicate rock colluvium and alluvium. The green category includes the conglomerate, schist, quartzite rocks and sedimentary/metamorphic rocks. The red class, referred to younger gravel fans and terraces and recent alluvium classes (including debris of granite and volcanic). Several lithologic units of different ages exposed in the study area are composed of similar rocks, such as siltstone, shale and conglomertare, and thus show very similar spectral properties. Also the spectra of limestone and dolomite are closer than other rock types to the shale and sandstone spectrum in the study area. The classification map generated by the SAM method for ASTER data shows that this method could be effectively used for geological mapping and exploration in unexplored areas.
Figure 5. SAM classification result for lithological mapping in the Sangan region.
A local-scale geological map of the SMC, based on the previous geological map and ASTER data by visual interpretation updated with field investigations ( and ).
Figure 6. Geological map at a scale of 1:20,000 of SMC based on ASTER data and field observations
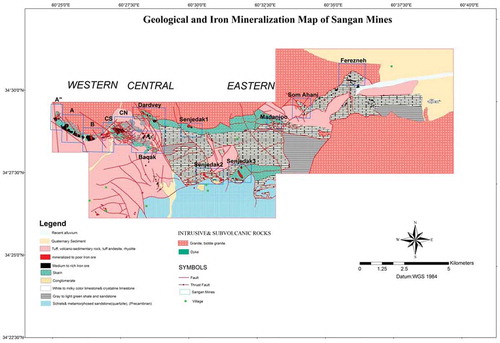
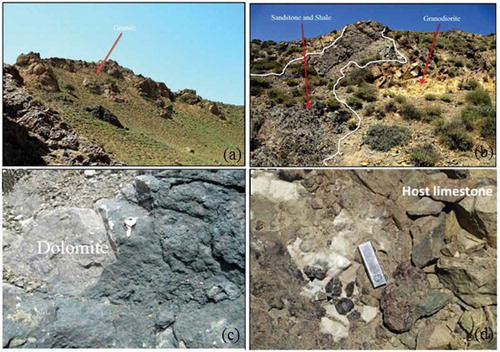
Figure 7. The field photographs of the study area during field investigation. (a) Granite; (b) Sandstone and shale; (c) Dolomite; (d) Limestone.
The preliminary analysis of remote sensing image interpretation, 1:250,000 scale geological map, and SMC geological map of the study area, reveals that the lithologies in this region can be identified on satellite images. The results show that the SWIR bands have higher discrimination power for lithologic identification.
In the second stage, the results of BR and SAM techniques and field observations were used to strategically guide new fieldwork and newly acquired field data were coregistered and jointly interpreted in another stage for compilation of geological maps, which facilitated tracing geological units between the visited field stations and processing images.
We present the application of SVM method in classifying lithology from the ASTER data in the Sangan region in order to update the former lithological map of the study area. Various combinations of surface reflectance were processed using SVM classifications to determine the optimal layers that create the highest classification accuracy. Training and test samples used in classification and accuracy assessment are independently selected with the support of geological map and field observations. Training samples were carefully selected corresponding to 12 lithologic classes. In the SVM classification of the study area, the parameters of radial and polynomial kernels, two commonly used kernel functions in remote sensing applications, are tested. More details are available in the classification result of ASTER data using SVM method (). This figure depicts the distribution of lithologic units in the Sangan region while volcanic rocks are well separated from sedimentary rocks.
Figure 8. Classification results achieved by SVM of ASTER data in the study area.
The classification results were evaluated by a detailed accuracy assessment and visual interpretation. The classification accuracy was quantitatively evaluated by testing samples via a confusion matrix, and the kappa coefficient. Accuracy assessment was performed using overall accuracies and confusion matrices derived the producer’s and user’s accuracies. The kappa coefficient of agreement was derived. indicates that the producer’s accuracy and user’s accuracy for each class using SVM method. The overall accuracy of ASTER data classification is 79% and the kappa coefficient is 0.75. The results show a good accuracy and represents the measurement of agreement between the classified map and the true reference data.
Table 2. Each class producer accuracy, user’ s accuracy and average accuracy of ASTER in the study area.
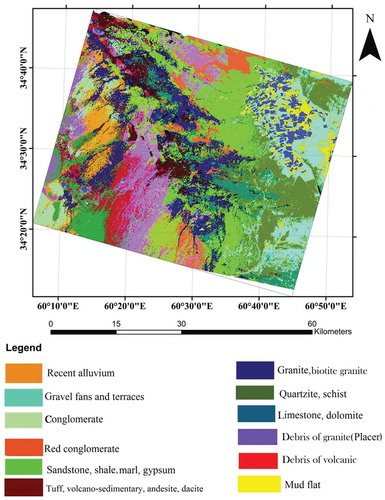
The field observations show that rock units present in the region are consistent with results obtained from the remote sensing techniques. The higher classification accuracy of the main rock units (nearly 79 %) was also confirmed by visual interpretation in the Sangan region against analytical work results. Lithological classification map of ASTER data after the post-classification processing is shown in . The accuracy of the lithological map is evaluated by independent validation samples, fieldwork, and a geological map. It is considerable that former geological maps were used to select the validating and training polygons for drawing and accuracy assessment of output classified map. A visual comparison of the classified integrated results with the geologic map shows an overall good correspondence between predicted occurrences and the map units. The results indicate that is helpful the productivity of ASTER data for lithological mapping and classification of rock units in the study area.
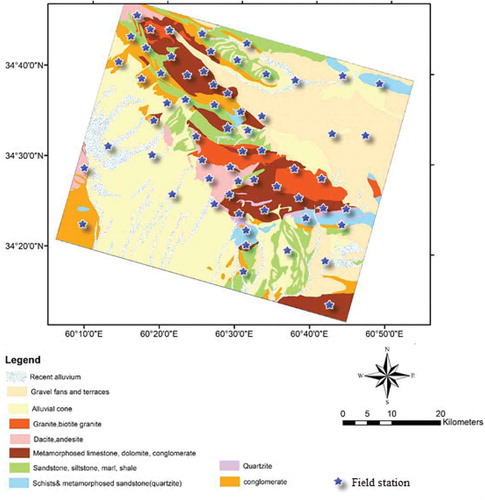
Figure 9. The final geological map with field survey points distribution of the study area.
5. Conclusions
The purpose of this study was to use ASTER data and integrated interpretation of remote sensing techniques to map the lithologic units in Sangan region and to confirm the results through a series of field investigations and former lithological maps. Various image processing techniques such as BR, SAM and SVM were applied to produce derivative data sets that contained enhanced information according to lithologic discrimination. FCCs images were used based on different BRs for mapping metasediments, volcaniclastics and granitoids lithologic units. Using different combinations of BRs has prepared the preliminary geological map of the Sangan region. In this research work, SAM method did not consider the spectral illumination and only consider the spectral similarity between the reference and image spectra, therefore it introduces potential commission errors in the results. The results obtained from the application of the SVM method showed the producer’s accuracy and user’s accuracy of classification were 78.24% and 79.8%, respectively. The kappa coefficient was computed as 0.75, showing high overall and categorical accuracies. The results showed the geological map deriving from SVM classification has an overall accuracy of nearly 80%. Field investigations confirmed with the highest classification accuracy of the main rock units in the Sangan region. Results also indicated that the image processing methods can provide detailed information for discriminating the different rock types using ASTER data. Combining the spectral discrimination via remote sensing data resulted in speeding up the survey in the Sangan region with sparse detailed geological mapping. The final lithological map derived from image analysis can be helpful to identify the economic deposits, such as skarn types in the study area.
Correction Statement
This article has been republished with minor changes. These changes do not impact the academic content of the article.
Acknowledgments
This paper is a part of the first author’s Ph.D. thesis at Amirkabir University of Technology (AUT), Tehran, Iran. The authors would like to thank the Amirkabir University of Technology (Polytechnic Tehran), Iranian Mines and Mining Industries Development and Renovation Organization (IMIDRO), and Sangan Iron Ore Mines Complex (SIOMC) for supporting this research (Project NO.95-3-9372). The contributions of Nima Jabbari, Adonis Fard Mousavi and Samira Rezaei are highly appreciated. The authors would like to thank the reviewers for their very helpful and constructive reviews of this manuscript.
Disclosure statement
No potential conflict of interest was reported by the authors.
Additional information
Funding
References
- Abdeen, M. M., Allison, T. K., Abdelsalam, M. G., & Stern, R. J. (2001). Application of ASTER band-ratio images for geological mapping in arid regions; the neoproterozoic Allaqi Suture, Egypt. Abstracts with Programs - Geological Society of America, 3, 289.
- Abrams, M., Hook, S., & Ramachandran, B. (2004). ASTER Users Guide V2. NASA JPL. Accessed on 10 July 2015. https://asterweb.jpl.nasa.gov/content/03data/04_Documents/aster_user_guide_v2.pdf.
- Bishop, C. M. (2006). Pattern recognition and machine learning (pp. 738). Singapore, Malaysia: Springer Science.
- Chen, X., Warner, T. A., & Campagna, D. J. (2007). Integrating visible, near-infrared and shortwave infrared hyperspectral and multispectral thermal imagery for geological mapping at Cuprite, Nevada. Remote Sensing of Environment, 110, 344–356.
- Cooley, T., Anderson, G. P., Felde, G. W., Hoke, M. L., Ratkowski, A. J., Chetwynd, J. H., … Bernstein, L. S. (2002). FLAASH, a MODTRAN4-based atmospheric correction algorithm, its application and validation. Geoscience and Remote Sensing Symposium IEEE International, 3, 1414–1418.
- Debba, P., Carranza, E. J. M., van der Meer, F. D., & Stein, A. (2006). Abundance estimation of spectrally similar minerals by using derivative spectra in simulated annealing. Geoscience and Remote Sensing, IEEE Transactions on, 44, 3649–3658.
- Di Tommaso, I., & Rubinstein, N. (2007). Hydrothermal alteration mapping using ASTER data in the infiernillo porphyry deposit, Argentina. Ore Geology Reviews, 32, 275–290.
- Fauvelet, E., & Eftekhar-Nezhad, J. (1990). Explanatory text of the taybad quadrangle map1:250000, Geological Survey of Iran, Tehran, Iran.
- Golmohammadi, A., Karimpour, M. H., Malekzadeh Shafaroudi, A., & Mazaheri, S. A. (2014). Alteration-mineralization, and radiometric ages of the source pluton at the sangan iron skarn deposit, northeastern Iran. Ore Geology Reviews, 65(2), 545–563.
- Hecker, C., Van der Meijde, M., Van der Werff, H., & Van der Meer, F. D. (2008). Assessing the influence of reference spectra on synthetic SAM classification results,” IEEE trans. Geosci. Remote Sens., 46(12), 4162–4172.
- Hewson, R. D., Robson, D., Carlton, A., & Gilmore, P. (2017). Geological application of ASTER remote sensing within sparsely outcropping terrain, Central New South Wales, Australia. Cogent Geoscience, 3, 1319259.
- Hunt, G. (1977). Spectral signatures of particulate minerals in the visible and near infrared. Geophysics, 42, 501–513.
- Ibrahim, W. S., Watanabe, K., & Yonezo, K. (2016). Structural and litho-tectonic controls on neoproterozoic base metal sulfide and gold mineralization in North Hamisana shear zone, South Eastern Desert, Egypt: The integrated field, structural, landsat 7 ETM+and ASTER data approach. Journal of Ore Geology Reviews, 79, 62–77.
- Iwasaki, A., & Tonooka, H. (2005). Validation of a crosstalk correction algorithm for ASTER/SWIR. IEEE Transactions on Geoscience and Remote Sensing, 43(12), 2747–2751.
- Kruse, F. A., Lefkoff, A. B., Boardman, J. B., Heidebrecht, K. B., Shapiro, A. T., Barloon, P. J., & Goetz, A. F. H. (1993). The Spectral Image Processing System (SIPS)-interactive visualization and analysis of imaging spectrometer data, remote sens. Environtal, 44, 145–163.
- Liu, L., Zhou, J., Jiang, D., Zhuang, D., & Mansaray, L. (2014). Lithological discrimination of the mafic-ultramafic complex, Huitongshan, Beishan, China: Using ASTER data. Journal of Earth Science, 25, 529–536.
- Madani, A., & Emam, A. A. (2009). SWIR ASTER band ratios for lithological mapping and mineral exploration: A case study from El Hudi area, southeastern desert, Egypt. Arabian Journal of Geosciences, 4, 45–52.
- Malekzadeh Shafaroudi, A., Karimpour, M. H., & Golmohammadi, A. (2013). Zircon U–Pb geochronology and petrology of intrusive rocks in the C-North and Baghak districts, Sangan iron mine, NE Iran. Journal of Asian Earth Sciences, 64, 256–271.
- Mantero, P., Moser, G., & Serpico, S. B. (2005). Partially supervised classification of remote sensing imges through SVM-based probability density estimation. IEEE Transactions on Geoscience and Remote Sensing, 43(3), 559–570.
- Mars, J. C., & Rowan, L. C. (2011). ASTER spectral analysis and lithologic mapping of the Khanneshin carbonate volcano, Afghanistan. Geosphere, 7, 276–289.
- Masoumi, F., Eslamkish, T., Abkar, A. A., Honarmand, M., & Harris, J. (2017). Integration of spectral, thermal, and textural features o f ASTER data using random forests classification for lithological mapping. Journal of African Earth Science, 129, 445–457.
- Mazhari, N., Malekzadeh Shafaroudi, A., & Ghaderi, M. (2017). Detecting and mapping different types of iron mineralization in Sangan mining region, NE Iran, using satellite image and airborne geophysical data. Geosciences Journal, 21(1), 137–148.
- Murphy, R. J., Monteiro, S. T., & Schneider, S. (2012). Evaluating classification techniques for mapping vertical geology using field-based hyperspectral sensors. IEEE trans. Geoscience and Remote Sensing, 50, 3066–3080.
- Othman, A. A., & Gloagen, R. (2014). Improving lithological mapping by SVM classification of spectral and morphological features: The discovery of a new chromite body in the Mawat ophiHolite complex (Kurdistan, NE Iraq). Remote Sensing, 6(8), 6867–6896.
- Patel, N., & Kaushal, B. (2011). Classification of features selected through Optimum Index Factor (OIF) for improving classification accuracy. Journal of Forestry Research, 22, 99–105.
- Pour, A. B., Hashim, M., Park, Y., & Hong, J. K. (2017a). Mapping alteration mineral zones and lithological units in Antarctic regions using spectral bands of ASTER remote sensing data. Geocarto International. doi:10.1080/10106049.2017.1347207
- Pour, A. B., Hashim, M., Park, Y., & Hong, J. K. (2017b). Lithological and alteration mineral mapping in poorly exposed lithologies using Landsat-8 and ASTER satellite data: North-eastern Graham Land, Antarctic Peninsula. Ore Geology Reviews. doi:10.1016/j.oregeorev.2017.07.018
- Pour, A. B., & Hashim, M. (2015). Structural mapping using PALSAR data in the central gold belt peninsular Malaysia. Ore Geology Reviews, 64, 13–22.
- Pour, A. B., Hashim, M., Hong, J. K., & Park, Y. (2017). Lithological and alteration mineral mapping in poorly exposed lithologies using landsat-8 and ASTER satellite data: North-eastern Graham Land, Antarctic Peninsula. Journal of Ore Geology Reviews. doi:10.1016/j.oregeorev.2017.07.018
- Pour, B., Hashim, M., & Marghany, M. (2011). Using spectral mapping techniques on short wave infrared bands of ASTER remote sensing data for alteration mineral mapping in SE Iran. International Journal of the Physical Sciences, 6, 917–929.
- Rajendran, S., Thirunavukkarasu, A., Balamurugan, G., & Shankar, K. (2012). Discrimination of iron ore deposits of granulite terrain of Southern Peninsular India using ASTER data. Journal of Asian Earth Sciences, 41, 99–106.
- Rezaei, A., Hassani, H., Moarefavand, P., & Golmohammadi, A. (2019). Determination of unstable tectonic zones in C–North deposit, Sangan, NE Iran using GPR method: Importance of structural geology. Journal of Mining and Environment, 10(1), 177–195.
- Rowan, L. C., Crowley, J. K., Schmidt, R. G., & Mars, J. C. (2000). Mapping hydrothermally altered rocks by analyzing hyperspectral image (AVIRIS) data of forested areas in the Southeastern United States. Journal of Geochemical Exploration, 68(3), 145–166.
- Safari, M., Maghsodi, A., & Pour, A. B. (2017). Application of landsat-8 and ASTER satellite remote sensing data for porphyry copper exploration: A case study from Shahr-e Babak, Kerman, south of Iran. Geocarto International. doi:10.1080/10106049.2017.1334834
- Sahoo, S., & Jha, M. K. (2016). Pattern recognition in lithology classification: Modeling using neural networks, self-organizing maps and genetic algorithms. Hydrogeology Journal, 25, 311–330.
- Sepidbar, F., Mirnejad, H., & Mi, C. (2018). Mineral chemistry and Ti in zircon thermometry: Insights into magmatic evolution of the Sangan igneous rocks, NE Iran. Journal of Chemie Der Erde.
- Smirnoff, A., Boisvert, E., & Paradis, S. J. (2008). Support vector machine for 3D modeling from sparse geological information of various origins. Computers & Geosciences, 34, 127–143.
- Van Ruitenbeek, F. J. A., Cudahy, T. J., Van der Meer, F. D., & Hale, M. (2012). Characterization of the hydrothermal systems associated with archean VMS- mineralization at Panorama, Western Australia, using hyperspectral, geochemical and geothermometric data. Ore Geology Reviews, 45, 33–46.
- Vapnik, V. (1979). Estimation of dependences based on empirical data (pp. 5165–5184). Moscow: Nauka. 27 (in Russian) (English translation: Springer Verlag, New York, 1982).
- Wolters, J. M., Goldin, L., Watts, D. R., & Harris, N. B. W. (2005). Remote sensing of gneiss and granite in southern Tibet. Abstracts with programs. Geological Society of America, 37, 93.