
ABSTRACT
The present study was conducted in the upper river Satluj basin of district Kinnaur, Himachal Pradesh, India. The vulnerability assessment was done on the basis of selected parameters like slope, slope profile, slope aspects, relative relief, curvature, soil texture, lithology, river morphometric, precipitation, land use and land cover, mass movement, flood, geological elements, earthquake occurrences, and anthropogenic activity (hydroelectric projects). Here, a quantitative and qualitative approach was used to generate physical vulnerability assessment index and vulnerability-based maps. Vulnerability assessment of the landscape was done to highlight the risks and sensitivity of the region due to prevailing hazards and anthropogenic activities.
1. Introduction
The vulnerability is a multidimensional (i.e., physical, social, economic, environmental, institutional, and human), dynamic (changes over time), scale dependent (from individuals to countries), and site specific (each location might need its own approach) (Bankoff, Citation2003). Vulnerability assessment of landscape includes that how much system is vulnerable as internally and externally due to the risk of climate change, hazards, and human intervention (Kanwar, Kuniyal, & Kumar, Citation2017). During the last two decades, vulnerability assessment has become essential mainly in the regions where developmental activities for energy or any other activities are continued. Yet, the Hyogo framework recognizes as a key activity to develop a “system of indicators of disaster risk and vulnerability at national and subnational scales” (UNEP, Citation1992). The term vulnerability is used diversely; therefore, scientists with various disciplines have an ongoing debate regarding its definition. Vulnerability assessment generates the fruitful results and provides a base for decision-making process (Bogardi & Birkmann, Citation2004). Physical aspect also covered the basic parameters such as slope, slope aspect, slope profile, curvature, land use, soil texture, lithology, and river morphometry (Birkmann, Citation2006). A slope is a dominant and controlling factor for the incidences of mass movement. The slope aspect also affects settlements, vegetation, agriculture, and geo-hazards processes. The understanding of aspect is important for forest management and planning because it affects the growth and productivity of forest. The slope profile basically influences the soil erosion and mass movement of the area (Tseng, Lin, & Hsieh, Citation2015). In the Himalayan region, the summital concavity or convexity of a slope is very common (Savinder, Citation2004). High relative relief indicates the high vulnerability as a geo-hazards point of views. The high relative relief indicates the region as complex and unstable topography (Gansser, Citation1964). High deviation of curvature influences the surface run-off and soil erosion. Land-use land cover also indicates the region’s ecological status and distribution of the resources and their balances in the region (Anderson et al., Citation1976). Soil texture and lithology of the area affect the human settlement, agriculture, vegetation, soil erosion, and mass movement of the area. All exogenes is processes are controlled by the particular climatic condition of that region. Indicators are dependent on each other and also influence each other. But some time, human interference affects the indicators and also changes the possible impacts of these indicators.
In the Satluj basin, constructions of hydroelectric projects have been increased after the 1990s in Satluj basin (Gupta & Sah, Citation2008a). The physical and social environment of the Satluj valley has been adversely affected by hydroelectric projects. Degradation of a physical environment and natural resources of this high-altitude valley is due to haphazard development, which exploits the Agenda 21 (UNEP, Citation1992). The Satluj valley is also known for its multi-facet hazards, namely, landslides, flood, avalanches, and earthquakes (Gupta & Sah, Citation2008b). The vulnerability of landscape is high in this valley due to its vulnerable parameters such as steep slope, high relative relief, structural discontinuities, lithology, and unhealthy land cover (Birkmann, Citation2006; Papathoma, Kappes, & Keiler, Citation2011).
2. Study area
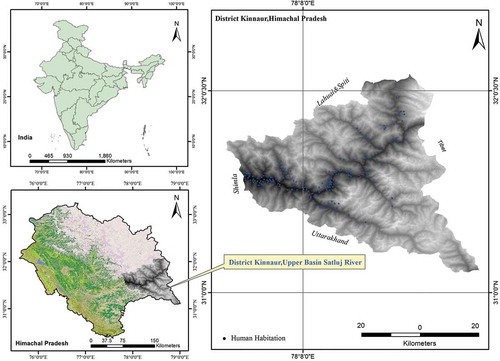
The study area of the upper Sutlej basin in district Kinnaur, Himachal Pradesh, India, extended from 31° 19′ 04″N to 32° 05′ 59″N latitudes and 77° 82′ 01″E to 78° 83′ 05″E longitudes. Its altitude varies from 455 to 6735 m. The total area of the district is 6401 km2 (). Zanskar and Himalayas are high mountain ranges that enclose valleys of Sutlej, Spiti, Baspa, and their tributaries. The slopes of the region are covered with thick wood, orchards, fields, and picturesque hamlets. Temperate climate is common due to its high elevation (455–6735 m), with long winters from October to May, and short summers from June to September. The lower part (Satluj and Baspa valley) of the district receives monsoon rain. The upper areas above the Reckong Peo of the valleys fall mainly in the rain shadow area and considered as arid region similar to the Tibet. Alpine species such as juniper, pine, fir, cypress, and rhododendron can be found at the elevations between 3500 and 5000 m. Oak, chestnut, maple, birch, alder, magnolia, apple, and apricot are temperate trees found at lower altitude. According to the 2011 census, Kinnaur district has a population of 84,298, roughly equal to the nation of Andorra and population density was only 13 person/km2.
Figure 1. Study area district Kinnaur, Upper Satluj Basin, Himachal Pradesh.
3. Methodology
It was a selective indicator’s assessment-based approach in which we score every indicator on the basis of its characteristics and visible counted impact in terms of physical loss on selected indicators. The physical loss (affected area) was calculated in terms of landslides, floods, and construction activities, which was extracted from the satellite images and validated through ground survey (). Total 13 indicators (hydropower project types, slope, aspect, slope profile, relative relief, land use land cover, curvature, channel morphology, lithology, landslide, flood, earthquakes, and soil texture) were selected; the selective indicators have high importance in study region. The presence of these indicators also determined the vulnerability and risk of a landscape. However, these indicators have heterogeneity, but their evaluation decided the degree of vulnerability and risk. The vulnerability assessments were done in terms of low, moderate, high, and very high. Finally, the low vulnerability is explained as a less affected area between 0 and 0.05 km2, investigation hydroelectric projects (no construction activities), gentle slope, summital convexity, high relative relief >4000 m (in-habitant area), low curvature value, flat slope aspect, low channel gradient, low stream frequency, low bifurcation ratio, hard rock strata: quartzite, grey shale, and hard rock. Moderate vulnerability of region is explained as a affected area between 1 and 5 km2, moderate slope, slope profile of rectilinear section, high relative relief >4000 m, affected land use of barren land and waterbodies, moderate curvature value, less affected slope aspect of north, north east, east, northwest, moderate channel gradient, moderate stream frequency, moderate drainage density, moderate frequency earthquake magnitude (5.0), hard rock strata: quartzite, basic volcanic, sandstone, and less affected soil texture of medium type. High vulnerability was explained as where affected area varies 5–10 km2, under construction type hydroelectric projects, moderate curvature, steep slope, basal convexity of slope profile, high relative relief of 2000–4000 m, high degradation of land use such as settlements, agricultural, and forestland. The high curvature value, highly affected slope aspect of south east, high bifurcation ratio, high stream frequency, weak lithology, poor soil texture, and high earthquake magnitude >6 were some responsible factors for high vulnerability. The very high vulnerability was explained on the basis of some observed parameters: very highly affected/degraded area of <10 km2, very steep slope to vertical slope, free face, RR of 1244–2000 m, highly valuable land use land cover such as settlements, agricultural land, forest cover, high curvature value, south and southeast aspect of slope, high channel slope gradient, (Sf) high stream frequency, drainage density (Dd), high bifurcation ratio (Rb), very weak lithology of limestone, siltstone, shale rocky/bad land, and soil of coarse texture. The geographic information system (GIS) and remote sensing were the major tools, which were used to highlight the vulnerability through digital map and index. Finally, all indicators’ impacts were recorded and observed during field visit and impact marked as value “1” and no impact marked as “0.” The landscape vulnerability area is also explained on the basis of parameters characteristics. Finally value means (x−) were taken and hazards vulnerability and high value of indicators classes were identified in terms of comprehensive vulnerability. All selected indicators were analysed and geo-processed in GIS environment. The overlay analysis was done and final physical landscape map was prepared, which indicated a highly vulnerable area () ( and ). Indicators analysis process and their data sources were well explained in .
Table 1. Parameters selection, data sources, and analysis.
Table 2. Vulnerability assessment on the physical landscape on the basis of selective indicators.
4. Results and discussion
4.1. Vulnerability due to physical aspects
4.1.1. Relative relief (RR)
Melton (Citation1958) relative relief is used for the overall assessment of morphological characteristics of terrain and degree of dissection. The relative relief of study area varies from RR = 1244 to 6755 m. The dissection value varies between 0 to 1 and increasing value from 0 to 1 indicates the high degree of dissection/erosion of basin. Dissection index (DI = RR/AR) has high value (0.64–0.87) which made cleared that basin has high vulnerability as a mass movement, soil erosion, and flood (Savindra, 2004). The hazards incidences such as landslides, floods, earthquakes, avalanches, and maximum human habitation were recorded under the elevation of 1244–2000 m. The maximum counted loss (56.17 km2) was recorded under the relative relief of 1244–2000 m, which indicates high vulnerability and risk. The probability of landscape and human settlement loss was very high from 2000 to 4000 m. The landscape vulnerability recorded low above 4000 m () and ).
Figure 2. Relative relief and slope-based vulnerability.
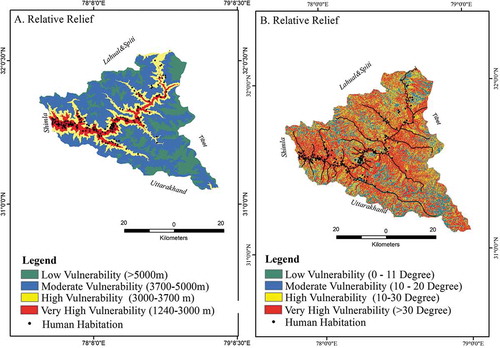
4.1.2. Slope
Slope is one of the most important parameters from stability consideration viewpoint (Lee, Choi, & Min, Citation2004; Webb, Yin, & Harrison, Citation2011). The highest affected area (18.56 km2) of physical landscape was recorded under the slope types of moderate steep slope (100–180) (Young, Citation1964). The landslide impact was highly observed on moderate slope to vertical slope in terms of slump, slide, subsidence, fall, and crap. Flood impact was high on different segments of slope like gentle slope to moderate steep slope. The vulnerability of physical landscape is very high on slope segments of steep slope to vertical slope. Very less affected area (6.24 km2) was recorded under the gentle slope (00–50). Maximum settlement concentrations were found on the gentle to moderate type of slope. Tangling, Apka, Lippa, Asrang, Chakra, Spillo, Poo, Khab, and Nako village areas had very steep slope, which had poor soil texture, less vegetation covered, high gully erosion, and dry climate condition. People of the study region also revealed that the loss of vegetation due to anthropogenic activities (road and dam construction) was common. Slope stability was also affected due to the anthropogenic activities (road and dam construction) in the area of Karcham Wangtoo. Gentle slope to moderate slope was found in the region of Chaura, burang, and Wangtu. Above the region of Yashang Dhar, Punag Khas, Urni, Chooling, Merru Khas, Rurag, Kibla, Karcham, and Rali have moderate steep to steep slope where forest cover is moderately sparse above the Rali Ranrang, Shongtong, Barang, Tangling, Kalpa, Pangi, Khadura, Akpa, Khab having very steep slope with sparse vegetation. The highest vulnerability was obtained by the moderate steep slope, high vulnerability on steep slope, while gentle having low vulnerability ( and ).
4.1.3. Slope profile
The distinctive segments such as profile are called slope elements or slope segments (Savindra, 2004a). These types of slopes profile (summital convexity, basal concavity, rectilinear section, and free face of slope profile) are commonly found in the Satluj valley (Melton, Citation1958a). Free face slope profile cliff bare rock vertical slope profile was commonly observed in the basin Reckong Peo to Khab. The concave segments of the slope profile were commonly affected by the mass movement. Talus accumulation was commonly observed at this segment of the slope profile. The moderate-to-high vulnerability was found on all segments of the slope profile. Forest area losses were very commonly observed on the free face segments of the slope. The loss of river morphology was found on basal concavity. Human property’s loss was found on summital concavity, rectilinear, and basal concavity. The flood and soil erosion highly affected the basal concavity segments of the slope profile. High and very high vulnerability was found under the basal concavity ().
4.1.4. Slope aspect
The slope aspect category of north (901.88 km2) has high area, followed by southwest (896.14 km2), east (889.68 km2), and northeast (889.29 km2). The lowest area was recorded under the slope aspect of northwest (820.44 km2). The slope aspect is affected by the sunray angle and all geomorphic processes controlled by solar energy, which is the main driving force (Dearman & Fookes, Citation1974). In general, the slope aspect influenced the distribution and density of mass movement by controlling the concentration of soil moisture or orientation of tectonic fracture. In northern hemisphere above 33 latitudes, the maximum sunny area was found under the south, southwest, and southeast aspects of a slope. The south (17.08 km2), southeast (15.03 km2), and southwest (3.72 km2) slope aspects have the highest area under the landslide, soil erosion, barren and wasteland; southeast (15.03 km2) and south (17.08 km2) have very high vulnerability and risk; northeast, flat, north, northwest have a low vulnerability ().
4.1.5. Curvature
The profile curvature affects the acceleration and deceleration of flow across the surface. A negative value (−10.415) indicates that the surface was upwardly convex at that cell, and flow will be decelerated. A positive profile (10.415) indicates that the surface was upwardly concave at that cell, and the flow will be accelerated (Rautelal & Lakhera, Citation2000). Talus accumulation was very common in the concave segments of the slope. Concavity indicates the superiority of concavity and rugged surface. The convexity of the slope has a highly affected area under the mass movement/soil erosion/avalanches, which indicates high vulnerability. The convexity surface area had highly affected area of 59.11 km2. The risk factor of human settlements was very high at the convexity segments of the slope ().
4.1.6. Lithology
This was generalized and modified after preparing the geological map of the Himalaya at 1:1000,000 (Plate-1) by Geological Survey of India, Government of India (1989) (Melton, Citation1958). In Satluj basin of district Kinnaur, the maximum area 1866.13 km2 (29%) was covered under the geology types of Pt3e: greenish grey sandstone, quartzite, grey and dark shale–sandstone, a band of limestone, and phosphorite. The affected area (3.98 km2) was recorded under the lithology type of Pt1 (regionally metamorphosed katazonalmeta sediments), while the lowest area (0.12 km2) was observed under the Pg3o (boulder conglomerate, sandstone, shale, clay, soft sandstone, and shale reddish and sandstone), occupying total 0.01 km2 under the Pt23 lithology categories (slate, phyllite, quartzite, grey shale, siltstone, limestone, gypsum, metamorphosed in proximity of granite) which have area 0.36 km2 and Pt3e had highest affected area (18.84 km2) of greenish grey sandstone, highly degraded under the process of landslides and avalanches. The Pt1, Pt23, Pt2, and Pg3 have a low vulnerability (Kumar, Gupta, Jamir, & Chattoraj, Citation2018). The forest area of lithology type limestone, siltstone, shale was highly affected due to the landslide, flood, and soil erosion (Gupta, Citation2003) ( and ).
Figure 3. Vulnerability of soil texture and lithology.
4.1.7. Soil texture
Coarse, medium fine, and very fine categories of soil texture were found in the study zones. The study region had maximum area under the very fine texture (5135.4 km2) 81%, followed by fine texture (579.71 km2) 9%, medium texture (455.71 km2) 7%, coarse texture (158.16 km2) 2%, and rocky land had (36.12 km2) 1%. The very fine texture area was highly vulnerable for the soil erosion and mass movements in dry temperate (Jenny, Citation1941). The sandy soil had low infiltration of water, above the Karcham Wangtoo area which was barren having less vegetation cover. The soil was sandy clay and sandy loamy. The water retention capacity was very low and soil erosion was high due to wind, where an area was well covered with the vegetation and water infiltration rate was very high (NRSA, Citation1997). But in the lower zone, the climate is humid; this region has sandy loamy soil and good moist salty soil. The highest vulnerable area 36.47 km2 was found under the rocky/bad land type topography and vulnerability was recorded high. However, fine texture type soil had high degraded area (14.35 km2) due to landslides and avalanches which had a very high vulnerability ( and ).
4.1.8. Morphometric
The erosion work of the river depends on a channel gradient, a volume of water, velocity, water discharge, and river load (Horton, Citation1945). The high channel slope gradient has an adverse and supportive impact on the river morphology, soil erosion, and flood (). The channel sinuosity was tortuous, irregular, and slope gradient was high. Exposed bedrock were commonly seen in the upper basin of Satluj. The stream frequency was moderate (Sf = 4). Horton (Citation1945) defined drainage as the ratio of total length of all stream segments in a given drainage basin to the total area of that basin as follows: Dd = Lk/Ak, where Lk indicates total length of all stream segments of the basin and Ak indicates the total area of the basin. Drainage density was found moderate (Dd); the bifurcation ratio (Rb) relates to the branching pattern of the drainage network which is defined as the ratio of a number of streams of a given order (Nu) to the number of streams of the next order (Nu+1). It is expressed with the equation as Rb = Nu/Nu+1 (Giusti & Schneider, Citation1965; Horton, Citation1945). Bifurcation ratio within the present region tends to decrease with increasing stream orders (Horton, Citation1945). A high value (1.79) of bifurcation ratio indicates that the region was very much dissected and very sensitive to physical loss (Singh, Citation2004). The low values of bifurcation ratio indicate that the Satluj basin had very controlled bedrock strata. Trellised drainage pattern was found because here stream pattern was well adjusted to the regional slope and geological structure (folds, faults) (Smith & Pain, Citation2009). Many streams were developed on both the flanks of the ridges. Few parts of region have hard exposed bedrocks, which control the development of the drainage network. High drainage density, high drainage frequency, and high bifurcation ratio indicate high vulnerability in terms of physical landscape loss in the upper basin of Satluj in district Kinnaur ().
Figure 4. Channel slope gradient of river upper Satluj basin in district Kinnaur.
5. Land use and land cover
Land-use land cover (LULC) is also considered to be the major factor in influencing the mass movement. Barren and sparsely vegetated areas are prone to weathering and slope instability (Anbalagan, Citation1992; Raghuvanshi, Ibrahim, & Ayalew, Citation2014; Raghuvanshi, Negassa, & Kala, Citation2015). The topo-sheet 2010 survey of India, at the scale of 1:50,000 data, were used to know the general status of land use in the Satluj basin of district Kinnaur (open series). The maximum area was found under the categories of snow-cover 2490 km2 (39%) and wasteland 2030.63 km2 (31%). However, waterbodies (5.3 km2), built up (1.54 km2), and agriculture (52.8 km2) land had very low area. Forest cover was only 484.63 km2 (8%) area and grassland cover was 1383.1 km2 (20.58%) of total area. The forest cover was only 8%, according to the forest policy, the minimum 33% area must be covered under the forest for the healthy landscape. The percentage of wasteland and snow-covered land was very high, which stands 70%. The 1.89 km2 of agriculture land was very low about 1.2% which indicates the tuff terrain and low possibility of agriculture. The built-up area covered only 0.31 km2. The landscape has unhealthy land cover and which has high vulnerability of physical loss.
Along the Satluj valley area, Khani Dhar, Burang, Bara Khamba, and Gharsu Nathpa Jhakri areas had better cover of grassland and less recorded landslides. Because the share stress not reduces during the raining season and slope stability was maintained. But in the region of Rarang, Wangtu, Tapri, Chagaon, Cholling, and Karcham area had less vegetation and soil texture/rock strata was commonly exposed in this area. During rainy season, the surface run-off was very high and share stress reduces which triggered the landslides. It was made clear from the field survey that the area of Karcham Wangtoo, Powari, Tangling, Kalpa, Bokta, Pangi, Rarang Khas, Akpa, Rispa, Jangi, Spillo, and Nako had dry condition, very fine soil texture, and broken land topography. The soil compactness was reduced during the snowfall and incidences of landslides increased. About 66.79 km2 area was damaged due to landslides and construction activities, which include 1.89 km2 of agriculture land, 7.52 km2 forestland, 38.37 km2 wasteland, 6.28 km2 grassland, 1.97 km2 scrubland, and 5.97 km2 under the waterbodies. The land degradation was also high due to blasting: road widening and construction activities (hydropower projects). About 0.31 km2 land of human settlements was damaged. High vulnerability was found under the area of agriculture, forest, and barren land. Low vulnerability was found in the area of scrubland, waterbodies, and snow glacier areas ().
5.1. Landslide
The economic and loss of life due to landslides were considerably increased in the last century, and most of the landslides are due to global climate change, such as El Niño and human activities (Runqiu & Weile, Citation2011). There is also high confidence that changes in heavy precipitation will affect landslides in some regions (IPCC, Citation2012). Precipitation pattern was different in the study region which was influenced by the topographic variance (434–6448 m). Isohyets study made it clear that the annual isohyets varied from 100 to 1400 mm (Singh & Jain, Citation2002). Annual rainfall in this basin decreased from the lesser to the Greater Himalayan range (Singh & Kumar, Citation1997). Rotational landslide, transitional, rockfall, topple fall, and debris fall debris flow were commonly found in the noticed places of Nathpa Jhakri, Shongtong, Spillo, Apka Khas. The landslides were due to snowfall which were very common above the Reckong Peo to Khab. Soil creep was common in an upper region because of unconsolidated types of very fine soil texture. Freeze and thaw weathering were very common in the upper areas of Kinnaur districts: Purbani, Ribba, Rarang, Khadura, Apka, Kwangi, Spillo, Nasarg, Samdayan, Puh, Dublin, Chango, and Nako. Slope excavation due to dam construction and road construction was commonly observed in Karcham Wangtoo, Shongtong Reckong Peo, Pangi, Kasang, and Nathpa Jhakri. Total 1541 incidences of landslides were observed out of which 1396 are small (0–0.2 km2), 138 are medium (0.2–0.5 km2), and 7 fall under the category of a large landslide (>0.5 km2). The landslide occurrences were very high on the moderate steep and steep slopes. The highest damaged area (12.13 km2) was found under the small categories of landslides (Gupta, Bartarya, Virdi, Citation2003; Gupta, Sah, Virdi, Citation1993). However, the earthquake average intensity in the upper basin varies from 5.0 to 5.5, which was sufficient to generate small landslides. People also believed that landslides were common at the base concavity and steep slope of the basin. According to the Pacific north seismic network, earthquakes of magnitude 4.0 and greater have been known to trigger landslides. The vulnerabilities of the physical landscape and human property were very high ( and ).
Figure 5. Landslide incidences and flood-based vulnerability.
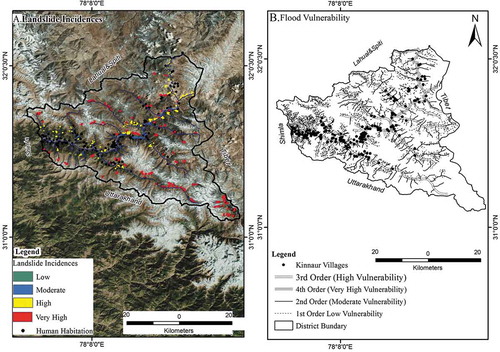
5.2. Flood
Himalayan region due to the construction activities of dams and road-added sediments had adverse impact on the river system (Ligon, Dietrich, & Trush, Citation1995). In Satluj basin, the most disastrous floods were experienced in 1993, 1995, 1997, 2000, 2005, 2007, and 2013 (Gupta & Sah, Citation2008b). The unusual high discharge was observed during the flash floods. The water level in a river had risen to about 15–20 m from normal level and its discharge value was as high as 10–12 times more than a normal discharge during the specified period (Gupta & Sah, Citation2008b). The lowest area is recorded under the first-order stream which affects the lowest area about 9.77 km2. The first-order streams, nallas and khads, have not possible impacts on the risk elements and no direct indirect relation with the hazards like earthquakes and avalanches. But small rill formation and soil erosion were noticed in a field. Second- and third-order streams affect only 12.88 km2 area and flood impacts high during the rainy season. Nallas and khads were responsible for the small landslides and soil erosion. The loss of forest and agriculture land was observed during the field observation in the area of third (like Baspa, Shongtong, Karcham, and Bhaba) and fourth (Satluj river) large stream orders. The very high flood vulnerable areas were found within the buffer of 100 m. The high stream order had a highly vulnerable area under the physical loss because of high cross section and steep channel gradient (150). The vulnerability and risk factor were very high at the mainstream and low at the first-stream orders ( and ).
5.3. Earthquake occurrences
However, the stronger earthquakes with greater magnitudes of MS7 might yield an even more pronounced effect on the overall sediment flux (Hovius, Meunier, & Lin, Citation2011). Several studies have also elaborated the link between earthquakes, landslides, and fluvial sediment transport in the seismically active mountain belts (Dadson, Hovius, & Dade, Citation2003; Meunier, Hovius, & Haines, Citation2008). The magnitude of earthquake incidences in the Kinnaur district magnitude varies from low to moderate in intensity level 4.0–6.1. The average magnitude of the basin in Kinnaur district was 4.5. As per the mention guideline of the Mercalli intensity scale the magnitude of earthquake explain that feel in intensity of IV-V, the tremors of earthquake can felt easily, some awakened, disturb window, door disturb, wall making cracking sound, sensation like heavy truck strictly building, unstable object overturned, Pendulum clock may stop. Earthquake magnitudes affect the physical mass movement behaviour. The incidences of landslides increased at the magnitude of 5.0. The active landslide is commonly observed in the Urni and Shudarang Dhaku villages. People also explained that earthquake impacts (cracks in a wall, landslides) were clearly seen in the study region. People also said that geological setting of the area was affected with blasting and construction activities. Due to the earthquakes, the small landslides were generated and property losses were seen in terms of agriculture land and settlements. The problems of soil erosion and avalanches were noticed due to its indirect causes. But huge loss of landscape was noticed during the time of landslides; these impacts were seen and observed by people in the village Urni and Shudarang Dhaku. Sixty villages with population of 25,317 persons were found under the earthquake vulnerability ( and ).
Figure 6. Earthquake-based vulnerability and project-affected population vulnerability.
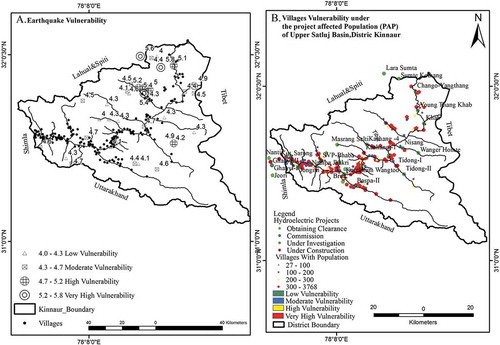
6. Vulnerability due to anthropogenic factor
6.1. Hydroelectric projects
In the Satluj basin, a hydroelectric project is one of the main construction activities, which is responsible for landscape destruction. Slope instability was common in and surrounding area of hydropower projects (CEIA, Citation2014). The topsoil, forestland, threatened faunal species, wildlife sanctuary eco-sensitive zone, and 228 villages were influenced under the hydroelectric projects. Increase in landslide incidences, flash floods, river morphological changes, and water quality deterioration and reduction in agricultural horticultural production, forest degradation, land degradations, inadequate compensation due to construction activities, damage to human health due to dust during construction activities, damage to houses due to blasting and tunnelling activities, and some adverse impacts were noticed within the project-affected area (Lata, Herojeet, & Dolma, Citation2017; Wang, Du, & Chen, Citation2012). The four types of hydroelectric projects (Under construction, Obtaining clearance, Commissioned and Under investigation) were identified in the upper Satluj basin of the district Kinnaur. It was made clear that maximum affected areas of landslides were found under the categories of under construction type (13.87 km2). Commissioned type hydroelectrics were less affected. It was observed that under construction hydroelectric project has high vulnerability and risk. Due to these construction activities, the incidences of landslide and flood have been increased. According to the people of the study area, the loss of river morphology and forest (7.82 km2) had been observed ( and ). Land degradation (75.75 km2) and loss of agriculture land (1.89 km2) were found under the type of construction hydroelectric projects. High vulnerability was found within the buffer of under construction hydroelectric projects.
7. People perception on geophysical setting and sustainable planning of landscape
The questionnaire survey was conducted in the study region to know the status of the physical landscape (Annexure 1). During this survey, the people perception were taken on the different selected parameters. Total 51 people told that hydropower were a major contributor to the loss of physical landscape. 63 respondents believed that high degree of the slope, high local relief are supporting factor for the landslides and soil erosion. 59 respondents were asserted that the maximum area wasfall under the barren land. The forest cover was low. However, 33 respondents also believed that the incidences of earthquakes were high, but actual losses were not observed. During the interview of 61 respondents, it was found that the incidences of flood were very common and people also told that River Satluj was known for its worst floods in 1993, 1995, 1997, 2000, 2005, 2007, 2013, and 2018. The channel morphology was also affected with the construction activities of hydroelectric projects; 57 people also told that there was not proper dumping site and excavated material was directly dumped into the river, which had a adverse impact on the river morphology. Some old experienced group of people (66) believed that siltstone, dolomite topography-based region had incidences of creep and subsidence. People also told that the soil of the region was easily eroded because of less vegetation where soil texture was very fine, loss of soil was very common, and dust problem was very common, which have a serious impact on the vegetation and horticulture. During the rainy season, the mudflow and rock slides were very common from the region Tapri to Reckong Peo ().
Figure 7. (a) Lose unconsolidated soil texture near to Akpa village, (b) large landslide in Bara Khamba, (c) muck dumping at the river Satluj side of Karcham Wangtoo HEP, (d) drilling the hill at 100 mw Tidong Hydro., (e) Urni landslide, (f) large landslide at Rekong Peo, (g) questionnaire survey at village Kwangi, (h) houses affected by the landslide at village Nigulseri, (i) strategic environmental assessment meeting at deputy commissioner office Rekong Peo, Kinnaur, on November 2014, (j) construction site of Tidong project, (k) dumping of muck along the river Sainj by Parbati HEP, (l) house cracks in Yulla village because of the tunnel construction of Karcham Wangtoo HEP.
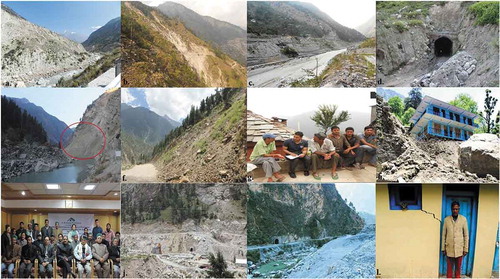
Figure 8. Comprehensive vulnerability.
7.1. Comprehensive vulnerability
Physical landscape losses were highly recorded under the construction type hydroelectric projects (13.87 km2). The high degree of slope >30 had high vulnerability (17.62 km2). Landscape degradation was high on free face profile and basal convexity because gravity pull was very high. The loss of settlements (0.31 km2), agriculture land (1.89 km2), forestland (7.52 km2), and barren land (38.7 km2) was high. The impact intensity of hazards (landslide, flood, anthropogenic activities, and earthquakes) was high. The LULC status plays a major effect on large floods catchment areas of river because the ratio of barren and forestland was very low. High convexity triggered more soil erosion in valley (14.16 km2). A slope aspect affects the density of slides, southeast and south slope aspects received more physical losses (32.11 km2). High channel slope gradient area has high soil erosion. Medium drainage density, medium frequency, and high bifurcation ratio indicate high degree of physical loss and high risk. In the case of limestone, dolomite, and slate, terrain type lithology was highly affected by weathering. Coarse texture and fine texture soil types had high erosional capacity in such cool temperate region. Overlay analysis was done on the basis of different raster and vector dataset layers. The vulnerability area was identified on every parameter such as slope, slope aspect, slope profile, soil texture, land use land cover, morphometric, lithology, geology, and hazards (earthquakes, flood, and landslide). To sum up all the parameters, finally the physical landscape vulnerability map was generated ( and ). Very high vulnerability areas (268.07 km2) of the Satluj basin basically fall under the main valley of Satluj. The maximum concentrations (91.1%) of rural settlements were found in the main valley. The 346.45 km2 area was found under the very high vulnerability. The high vulnerability area was 268.07 km2, moderate vulnerable area was 922.83 km2, and 4833.13 km2 falls under the low vulnerability. According to the vulnerability index, the highest mean values were found under the hazards of landslides 0.67 and anthropogenic activities had 0.55. The lowest impact value was found under the earthquake 0.30 and flood 0.36 (). Hydropower development was one of the major concerns in the region, which is responsible for huge physical landscape and human property losses. The vulnerability of 60 villages of population 25,317 was found under the very high vulnerability area of 346.45 km2.
8. Conclusion
In the whole study, one thing was found out that the region has high vulnerability, because of its complex geophysical setting. For future development, it is very necessary to keep in mind the complex geophysical setting. High degree of slope area must be avoided from excessive construction activities. Slope profile of free face is highly damaged due to blasting activities. High relative relief, weak soil texture, and high morphometric parameters indicate its high vulnerability. The unhealthy land use land cover is more prone to soil erosion, floods, and landslides. The hydropower development should be in sustainable and control manner. The maximum losses of hydropower project and social issues were counted in the main Satluj valley. For the future study, it is very necessary and important that the detailed study on landslides and slope stabilization should be undertaken by well-known research institute or concerned departments. The incidences of hazards (landslides, flood, earthquakes, and anthropogenic) and their impact were highly observed in main Satluj valley. The main valley patch of 346.45 km2 along river Satluj from Rampur to Khab received maximum losses. This area has high indicator value, and 90% district population resides and has high pressure of construction activities. It is made clear from the analysis that the excessive and haphazard developmental activities are increasing the risk for local communities over this sensitive landscape.
Acknowledgments
The authors are heartily thankful to the “Director, G.B. Pant National Institute of Himalayan Environment and Sustainable Development, Kosi-Katarmal, Almora, Uttarakhand – 263 647, India” for providing facilities at Himachal Regional Centre of the Institute. Thanks are also due to different stakeholders (local communities, project authorities, and local government) for their constant support and cooperation during field study. We are also thankful to Dr. Kaser (Scientist C, G.B. Pant National Institute of Himalayan Environment and Sustainable Development Vivek Vihar, Itanagar – 791 113, Arunachal Pradesh, India) for providing constructive suggestion.
Disclosure statement
No potential conflict of interest was reported by the authors.
Additional information
Funding
References
- Anbalagan, R. (1992). Landslide hazard evaluation and zonation mapping in mountainous terrain. Engineering Geology, 32(4), 269–277.
- Anderson, J. R., Hardy, E. E., & Roach, J. T. (1976). A land use land cover classification System for use with remote sensor data. US Geological Survey Professional Paper, 964, 28.
- Bankoff, G. (2003). Vulnerability as a measure of change in society. International Journal of Mass Emergencies and Disasters, 21(2), 5–30.
- Birkmann, J. (2006). Indicators and criteria for measuring vulnerability: Theoretical bases and requirements. In J. Birkmann (Ed.), Measuring vulnerability to natural disasters (pp. 55–77). Tokyo: United Nations University Press.
- Bogardi, J., & Birkmann, J. (2004). Vulnerability assessment: The first step towards sustainable risk reduction. In D. Malzahn & T. Plapp (Eds.), Disaster and society from hazard assessment to risk reduction (pp. 75–82). Berlin: Logos Verlag.
- CEIA. (2014). Directorate of energy, government of Himachal Pradesh, cumulative environmental impact assessment of hydroelectric projects in Sutlej River basin, Himachal Pradesh,India. MaindraftReport: Volume 1. Retrieved from http://admis.hp.nic.in/doe/Citizen/openfile.aspx?id=93&etype=MNotice.pdf
- Dadson, S. J., Hovius, N. C., & Dade, W. B. (2003). Links between erosion, runoff variability and seismicity in the Taiwan orogeny. Nature, 426, 648–651.
- Dearman, W. R., & Fookes, P. G. (1974). Engineering geological mapping for civil engineering practice in the United Kingdom. Quarterly Journal of Engineering Geology, 7, 223–256.
- Disse, M., & Engel, H. (2001). Flood events in the Rhine basin: Genesis, influences and mitigation. Natural Hazards, 23, 271–290.
- Gansser, A. (1964). The geology of the Himalayas. New York: Wiley Interscience.
- Giusti, E. V., & Schneider, W. J. (1965).The distribution of branches in river network. USGS Professional Paper, 422G, 45–47.
- Gupta, R. P. (2003). Remote sensing of geology (pp. 498–524). Germany: Springer,Verlag publication.
- Gupta, V., Bartarya, S. K., & Virdi, N. S. (2003). Landslide activity along the Satluj valley in the higher and lesser Himalaya of Himachal Pradesh. Proceedings of ISRS,Silver Jubilee Symposium, 994, 80–86.
- Gupta, V., & Sah, M. P. (2008a). Spatial variability of mass movements in the Satluj Valley, Himachal Pradesh during 1990-2006. Journal of Mountain Science, 5(1), 38–51.
- Gupta, V., Sah, M. P., & Virdi, N. S. (1993). Landslide hazard zonation in the upper Satluj Valley, district Kinnaur, Himachal Pradesh. Journal of Himalayan Geology, 4(1), 81–93.
- Gupta, V., & Sah, P. M. (2008b). Impact of the Trans-Himalayan Landslide Lake Outburst Flood (LLOF) in the Satluj Catchment, Himachal Pradesh, India. Natural Hazards, 45(3), 379–390.
- Hooijer, A., Klijn, F., Pedroli, G. B. M., & Van Os, A. G. (2004). Towards sustainable flood risk management in the Rhine and Meuse river basins: Synopsis of the findings of IRMA-SPONGE. River Research and Applications, 20, 343–357.
- Horton, R. E. (1945). Erosional development of streams and their drainage basins- Hydro-physical approach to quantitative morphology. Geological Society of American Bulletin, 56, 275–370.
- Hovius, N., Meunier, P., & Lin, C. W. (2011). Prolonged seismically induced erosion and the mass balance of a large earthquake. Earth and Planetary Science Letters, 304, 347–355.
- IPCC. (2012). Managing the risks of extreme events and disasters to advance climate change adaptation. A Special Report of Working Groups I and II of the Intergovernmental Panel on Climate Change [Field C.B., V., Barros, T.F., Stocker, D., Qin, D.J., Dokken, K.L., Ebi, M.D., Mastrandrea, K.J., Mach, G.K., Plattner, S.K., Allen, M., Tignor, P.M., &Midgley, (eds.) (pp. 582) Cambridge, UK: Cambridge University Press.
- Jenny, H. (1941). Factors of soil formation. New York: McGraw-Hill.
- Kanwar, N., Kuniyal, J. C., & Kumar, A. (2017). Understanding climatic variability and forest vulnerability due to hazards and anthropogenic activities: A study from the Northwestern Himalaya. Journal of Himalayan Ecology Sustainable Development, 12, 44–56.
- Kowalski, W. C. (1991). Engineering geological aspects of different types of karst corrosion and fracture generation in karst masses. Bulletin International Association Engineering Geology, 44, 35–46.
- Kumar, V., Gupta, V., Jamir, I., & Chattoraj, S. L. (2018). Evaluation of potential landslide damming: Case study of Urni landslide, Kinnaur, Satluj Valley, India. Geoscience Frontiers, 30, 1–15. Retrieved from doi:10.1016/j.gsf.2018.05.004
- Lata, R., Herojeet, R., & Dolma, K. (2017). Environmental and social impact assessment: A study of hydroelectric power projects in Satluj Basin in District Kinnaur, Himachal Pradesh, India. International Journal of Earth Science and Engineering, 10(02), 270–280.
- Lee, S., Choi, J., & Min, K. (2004). Probabilistic landslide hazard mapping using GIS and remote sensing data at Boun, Korea. International Journal of Remote Sensing, 25(11), 2037–2052.
- Ligon, F. K., Dietrich, W. E., & Trush, W. J. (1995). Downstream ecological effects of dams: A geomorphic perspective. Bioscience, 45, 183–192.
- MacMillan, R., Pettapiece, W., Nolan, S., & Goddard, T. (2000). A generic procedure for automatically segmenting landforms into landform elements using DEMs, heuristic rules and fuzzy logic. Fuzzy Sets and Systems, 113, 81–109.
- Melton, M. A. (1958a). Geometric properties of mature drainage basin system and their representation in an E4 phase space. Journal of Geology, 66, 35–56.
- Meunier, P., Hovius, N., & Haines, A. J. (2008). Topographic site effects and the location of earthquake induced landslides. Earth and Planetary Science Letters, 275, 221–232.
- NRSA. (1997). Evaluation of IRS-1C data for mapping soil resources and degraded lands. Project report.
- Palmstrom, A. (1995). A rock mass characterization system for rock engineering purposes. Ph.D. thesis Univ. of Oslo, pp. 1–400.
- Papathoma, K., Kappes, M., & Keiler, M. (2011). Physical vulnerability assessment for Alpine hazards: State of the art and future needs. Natural Hazards, 58, 645–680.
- Pinter, N., Van der Ploeg, R. R., Schweigert, P., & Hoefer, G. (2006). Floodmagnification on the RiverRhine. Hydrological Processes, 20, 147–164.
- Raghuvanshi, T. K., Ibrahim, J., & Ayalew, D. (2014). Slope stability susceptibility evaluation parameter (SSEP) rating scheme – An approach for landslide hazard zonation. Journal of African Earth Sciences, 99, 595–612.
- Raghuvanshi, T. K., Negassa, L., & Kala, M. P. (2015). GIS based grid overlay method versus modeling approach: A comparative study for landslide hazard zonation (LHZ) in Meta Robi district of West Showa zone in Ethiopia. The Egyptian Journal of Remote Sensing and Space Sciences, 18, 235–250. doi:10.1016/j.jafrearsci.2014.05.004
- Rautelal, P., & Lakhera, R. C. (2000). Landslide risk analysis between Giri and Tons Rivers in Himachal Himalaya, India. International Journal of Applied Earth Observationand Geo-Information, 2, 153–160.
- Runqiu, H., & Weile, L. (2011). Formationdistribution and risk control of landslides in China. Journal of Rock Mechanics and Geotechnical Engineering, 3(2), 97–116.
- Savinder, S. (2004). Geomorphology (4th ed., pp. 381–382). Allahabad: Kalyan Publication.
- Schoeneberger, P. J., Wysocki, D. A., & Benham, E. C. (2012). Soil survey staff, field book for describing and sampling soils.Version 3.0.U.S. Lincoln, NE: Department of Agriculture, Natural Resource Conservation Service.
- Selmer-Olsen, R. (1971). Engineering geology. Part 1 (in Norwegian) (pp. 32). Trondheim, Norway: Tapir publishers.
- Singh, P., & Jain, S. K. (2002). Snow and glacier melt in the Satluj River at Bhakra Dam in the Western Himalayan region. Hydrological Sciences/Journal-des Sciences Hydrologiques, 47(1), 93–104.
- Singh, P., & Kumar, N. (1997). Effect of orography on precipitation in the Western Himalayan region. Journal of Hydrology, 199, 183–206.
- Slosson, J. E., & Krohn, J. P. (1982).Southern California landslides of 1978 and 1980. Storms, Floods, and Debris Flows in Southern California and Arizona, 1978 and 1980. Proceedings of a Symposium, National Research Council, and Environmental Quality Laboratory, California Institute of Technology, Pasadena, CA, 17–18 September 1980. National Academy Press, Washington, pp. 291–319.
- Smith, M. J., & Pain, C. (2009). Applications of remote sensing in geomorphology. Progress in Physical Geography, 33(4), 568–582.
- Tseng, C. M., Lin, C. W., & Hsieh, W. D. (2015). Landslide susceptibility analysis by means of event-based multi-temporal landslide inventories. Natural Hazards Earth System Science Discussion, 3, 1137–1173.
- UNEP. (1992). Agenda 21 Technical report, United Nations environment program, Hyogo framework for action 2005-1015: Building the resilience of nations and communities to disasters. In: World conference on Disaster reduction, Kobe, Hyogo, Japan
- Wang, Q. G., Du, Y. H., & Chen, K. Q. (2012). The 18th Biennial conference of international society for ecological modeling environmental impact post-assessment of dam and reservoir projects: A review appraisal center for environment and engineering, Ministry of Environmental Protection, Beijing, China. Proceeding Environmental Sciences, 13, 1439–1443.
- Webb, A., Yin, A. G., & Harrison, A. (2011). Cenozoic tectonic history of the Himachal Himalaya (northwestern India) and its constraints on the formation mechanism of the Himalayan Orogen. Geosphere, 7, 1013–1061.
- Wood, A. (1942). The development of hillside slopes. Proceedings of the Geologists’ Association, 53, 128–138.
- Young, A. (1964). Deductive model of slope evolution. Slope Commission Rep., 66(3), 45–66.
- Zellmer, J. T. (1987). The unexpected rockfall hazard. Bulletin Association Enging Geologists, 24(2), 281–283.
Annexure 1. Villages under survey in the Satluj basin of district Kinnaur (H.P).