
 ?Mathematical formulae have been encoded as MathML and are displayed in this HTML version using MathJax in order to improve their display. Uncheck the box to turn MathJax off. This feature requires Javascript. Click on a formula to zoom.
ABSTRACT
Indian Sundarban Biosphere Reserve (SBR), a fragile ecosystem, is susceptible to frequent cyclones, floods, and storm surge. The study impeccably analyzed the socio-economic vulnerability in SBR using pragmatic approach. Average storm surge height, slope amount, flood inundation, drainage proximity, and drainage density were used for assessing exposure while sensitivity and adaptation were examined from the data derived through a comprehensive field survey of 570 households in SBR. The revelation of the study manifested very high vulnerability in Basanti, Gosaba, Kultali, Namkhana, and Patharpratima blocks and high vulnerability in Kakdwip, Sagar, and Hingalganj blocks of SBR. Constant exposure to cyclones and storm surges, frivolous infrastructural setup, impoverish social structure, and lamentation of losses are major barriers to overall socio-economic upliftment of communities. Consolidated infrastructural setup, proper early warning system, disaster monitoring centres, better transport connectivity within remote islands, better livelihood opportunities, education, and awareness may help in improving the socio-economic conditions of the communities. Pragmatic approach assisted in the cogent understanding of climate change impacts and indicated adaptive and mitigation measures to improve coastal society in SBR. Thus, the approach has proven to be effective for analyzing the impact of climate change-induced hazards on socio-economic condition on the communities in coastal areas.
1. Introduction
IPCC (Citation2007) has remarkably stated that “scientific evidence for warming of the climate system is unequivocal.”
Rising concerns over climate change impacts have led to the realization of intrinsic variability in climatic regimes on the planet Earth. Researchers across the globe are concerned about understanding of climate change and exploring its relative impacts on the ecosystem (Moss et al., Citation2010). The temperature has increased up to 1°C, and the last five years recorded the highest temperature globally (UNDP: United Nations Development Programme, Citation2019). If the temperature continues to rise at the current rate, it is plausible that it may reach 1.5°C globally between 2030 and 2052. The mean global temperature is also anticipated to reach around 4°C by the end of the century (IPCC, Citation2018). Climate-induced disasters have also become evident in many parts of the world. Nearly 1.3 million deaths and 1.4 billion injuries were reported due to geophysical and climatic disasters (storms, floods, tsunamis, heatwaves, drought, earthquake, etc.) during 1998–2017. These vicious disasters have caused displacement and rendered homeless of many people in disaster-affected nations. Losses from the extreme disaster events inclusively have risen around 151% during the last 20 years (UNISDR, Citation2018). Developing nations are the most vulnerable to the destructions and damages caused by abrupt disaster events. Studies demonstrated that impoverish groups are more vulnerable to disasters and suffer most from their consequences (Twigg, Citation2004; UNISDR, Citation2018; Wisner, Gaillard, & Kelman, Citation2012).
Vulnerability can be assessed through analyzing the relationship between physical and social systems using a range of techniques. Selection of suitable site-specific indicators is required to address multifaceted issues for vulnerability assessment (Hahn, Riederer, & Foster, Citation2009). Various scholars have utilized appropriate methods to assess vulnerability, e.g., gap method (Sullivan, Meigh, & Fediw, Citation2002), human development index (Bray, Jemal, Grey, Ferlay, & Forman, Citation2012), composite vulnerability index (Rygel, O’sullivan, & Yarnal, Citation2006), sustainable livelihood security index (Sajjad & Nasreen, Citation2016), and fuzzy logic (Ahmed et al., Citation2018). Index-based vulnerability analysis helps in explicit vulnerability assessment by integrating various indicators manifesting different vulnerability scenarios. Scholars have widely used these indices as effective policy tools (Kelkar, Balachandra, & Gurtoo, Citation2011; Malakar & Mishra, Citation2017). Vulnerability assessment in a hazard-affected region depends on its social and economic conditions (Malakar & Mishra, Citation2017). Such an assessment is very essential for determining the degree of suffering of the relied population and economic structure due to disasters. It can be accomplished using both the data sources, i.e.,, primary (Challinor, Simelton, Fraser, Hemming, & Collins, Citation2010) and secondary (Sahana & Sajjad, Citation2019). Vulnerability assessment and adaptation to climate change have inculcated cogitation among the scientific community (Tian & Lemos, Citation2018). Successively, various case studies were carried out to examine the vulnerability to natural hazards (Bohle, Downing, & Watts, Citation1994; Dumenu & Obeng, Citation2016; Fischer, Shah, Tubiello, & Van Velhuizen, Citation2005; Owusu & Nursey-Bray, Citation2019). Abid, Schilling, Scheffran, and Zulfiqar (Citation2016) examined the farm-level vulnerability to changing climate and extreme weather events using vulnerability components and farmers’ affirmation. Climate change impacts on the socio-ecological system are complex and dynamic due to inherent heterogeneity and uncertainty and require precise assessment. Pandey and Bardsley (Citation2015) examined socio-ecological vulnerability to climate change and unscrupulous resource distribution in the Himalayan region. Vulnerability assessment aims to distinguish the implications of changing climate and adaptation strategies in a given system.
Scientific engineering and technical measures were prominent for vulnerability assessment during the 1970s (Brooks, Citation2003), while social science-oriented approaches were carried out for vulnerability assessment during the 1980s. Vulnerability was partially analyzed using the earlier approach which was later replaced by a human-oriented approach involving environmental, social, economic, institutional, and economic parameters (Blaikie, Cannon, Davis, & Wisner, Citation2005; Ciurean, Schroter, & Glade, Citation2013). Vulnerability assessment varies with the people, place, and type of disaster implications (Dintwa, Letamo, & Navaneetham, Citation2019). Vulnerability assessment in large areas requires a more holistic and interdisciplinary approach (Ciurean et al., Citation2013). Most of the studies on social vulnerability assessment have followed a semi-quantitative approach based on spatial, socio-economic, demographic, and field-derived indicators (Fekete, Citation2019). The index-based disaster resilience assessment is an integral part of the management and planning of natural hazards. Indices are helpful in ascertaining the changes driven by hazards and priority areas of concern which may be based on inductive, deductive, qualitative, and quantitative approaches (Ogie & Pradhan, Citation2019). Composite indices are informative, analytical, and collaborative. They facilitate effective decision-making, help in planning, and assist in raising the concerns for policy incentives by recognizing the complexity of varied problems. These indices are more critical for climate change assessment (Sathyan, Funk, Aenis, Winker, & Breuer, Citation2018). Various antecedent approaches were adopted to predict the future consequences of global climate change. One such approach popularly known as pragmatism claimed wide acknowledgment in various disciplines. Pragmatistic thinking was evolved in the United States during the late nineteenth and the advent of the twentieth centuries. This approach consisted of method and seeking truth behind the theory (Hammersley,Citation2018). A practical approach to climate mitigation and adaptation is essential for efficacious hazard preparedness and indelible management. Thus, the pragmatic approach calls for the practical implementation of actions to identify the best practices for solving the problem (Miettinen, Samra-Fredericks, & Yanow, Citation2009).
Indian Sundarban Biosphere Reserve (SBR) sets an example of a dynamic ecosystem having the largest mangrove stretch among the important biodiversity reserves in the world. Impacts of cyclones, floods, and storm surge are being evident since its existence (Mukhopadhyay, Citation2009). Climate change has also contributed to increasing the frequency of extreme weather events (Raha, Das, Banerjee, & Mitra, Citation2012). The frequent onset of climate change-induced disasters has always been detrimental to the local community. Thus, a social and economic vulnerability assessment is imperative for understanding the smack of disasters and the formulation of efficient management strategies. However, a scientific assertion on this problem is scant (Slettebak, Citation2013). In this backcloth, this paper intends a cogent examination of socio-economic vulnerability using pragmatic approach in the Reserve. The main focus has been given to the increasing vulnerability of the local community to evident disaster events and changing climate scenarios. Sea-level rise, cyclonic depressions, floods, and rising temperature have significantly contributed to induce vulnerability in the region (Ghosh, Schmidt, Fickert, & Nüsser, Citation2015; Mahadevia Ghimire & Vikas, Citation2012). Climate change has also threatened the health of mangroves (Manna & Raychaudhuri, Citation2018). Thus, socio-economic vulnerability assessment has important consideration in the Indian SBR. We used a bootstrap methodology for identifying and selecting site-specific indicators for constructing a vulnerability index. The vulnerability analysis through this framework can be useful for assessing relative regional vulnerability and identifying priority regions for lessening the impact of climate change-induced vulnerability.
2. Study area
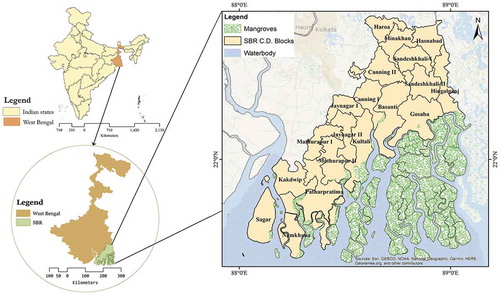
With immense heterogeneity in biodiversity, SBR is situated at the vertex of Bay of Bengal between 21°40ʹ to 22°40ʹ north latitudes and 88°03ʹ to 89°07ʹ east longitudes (Mitra, Banerjee, Sengupta, & Gangopadhyay, Citation2009). Of the total area of the Reserve (9630 km2), 4264 km2 is under mangrove forest, 2195 km2 is under wetlands cover, and 5,366 km2 is under built up. SBR consists of 19 blocks (administrative divisions of the district) spreading over north and south Twenty-Four Parganas districts of West Bengal (Hazra, Ghosh, DasGupta, & Sen, Citation2002). This magnificent deltaic ecosystem sustains a large variety of mangrove species (Excoecaria agallochaLinn., Porteresia coarctata Roxb., Phoenix paludosa Roxb., etc.) and beasts (Royal Bengal Tiger, various reptiles, spotted dear, marine turtles, and Gangetic dolphins). Having 102 islands (48 inhabited and 54 being uninhabited), SBR enjoys a tropical wet climate with a short dry spell between November and April. The Reserve experiences high relative humidity and temperature throughout the year with heavy rainfall during monsoon season. The minimum temperature ranges between 2° and 4°C, while the maximum reaches to 43°C in March. Mean annual precipitation ranges between 150 and 200 cm. Tropical cyclones, storm surges, and floods are the common phenomena during monsoon (). Hooghly, Ganga, Muriganga, and Ichamati are the significant rivers in the study area. SBR owes recent geological origin (6000–7000 years before present) as an outcome of long depositional work of River Ganga and Bay of Bengal (Banerjee, Senthilkumar, Purvaja, & Ramesh, Citation2012; Gopal & Chauhan, Citation2006). This fragile delta is a home of 4.37 million people and provides immense resources for their sustenance. Agriculture is the mainstay of the economy, while prawn cultivation, fishing, and honey collection are the other important economic activities in SBR (Mahadevia Ghimire & Vikas, Citation2012).
Figure 1. (a) Location of West Bengal in India, (b) location of SBR in West Bengal state, and (c) location of community development blocks in SBR
3. Database and methodology
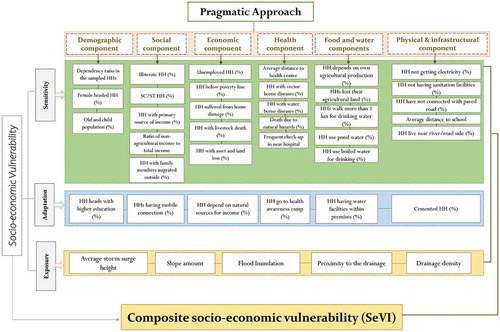
The composite socio-economic index was constructed as a function of exposure, sensitivity, and adaptation. Average storm surge height, slope amount, flood inundation, drainage proximity, and drainage density were used for assessing exposure. Flood inundation layer was prepared using a shuttle radar topographic mission digital elevation model (SRTM DEM-1 arc second) through spatial modeling. Proximity to the drainage layer was prepared by digitizing the rivers from topographical sheet (1:50,000) and Google earth and using buffer analysis in ArcGIS. Euclidean distance function in ArcGIS was used to prepare the drainage density layer. The slope was calculated from SRTM DEM data using spatial analysis tool in ArcGIS, while data of average storm surge height were obtained from Indian Meteorological Department (IMD) and converted into raster format using the IDW function in ArcGIS. The data regarding indicators of sensitivity and adaptation were collected at the household level using multi-stage cluster sampling method. We first selected villages from the study area. Each block was divided into two strata (nearer to waterbody and one situated in the mainland). From each of these strata, one village was selected randomly. From each block (the study area is divided into 19 blocks), two villages were selected randomly. In this way, 38 villages were selected from the study area. In the second stage, the selection of households was made on the basis of a stratified random sampling technique. In this stage, the strata considered were occupation of the community (cultivators, fishermen, daily wage labourers, businessmen, and government servants). From each occupation class, three households were selected. In this way, 15 households were selected from each village. Thus, a total 570 households were selected for in-depth study. A questionnaire was designed to collect the relevant information related to socio-economic vulnerability. The questionnaire contained questions on household profile, demographic, social, economic, health, food and water, and physical and infrastructural indicators. Sufficient care was taken to make the questionnaire communicable to the respondents. One of the authors belonged to the study area and worked as a major source of help in asking questions. IPCC pragmatic approach was used to construct a composite socio-economic vulnerability index (SeVI) using six major socio-economic components and their sub-indicators (, Appendix 1).
Figure 2. Methodological framework of the study
The sub-components were standardized between 0 and 1. Each sub-component has an equal contribution to the SeVI index, and a balanced weighted approach was used for calculating the SeVI (Hahn et al., Citation2009):
Component vulnerability score was then calculated by averaging the weighted score of all sub-components for each domain category:
where COVi is the component score of the vulnerability index of each block; WISk is the weighted index score of each sub-component.
Composite socio-economic vulnerability with its three components of adaptation capacity, sensitivity, and exposure following IPCC pragmatic approach was calculated:
where j, l, and m denote the number of components under exposure, sensitivity, and adaptive capacity (), and “i” denotes the blocks. Finally, the block-level composite socio-economic vulnerability (SeVI) was obtained:
3.1 Rationale for the selection of indicators
Vulnerability demands assessment and policy measure, and thus, scholars have used various indicators to quantify the degree of vulnerability (Abuodha & Woodroffe, Citation2010; Hahn et al., Citation2009; Luers, Lobell, Sklar, Addams, & Matson, Citation2003; Orencio, Citation2014; Sam, Kumar, Kächele, & Müller, Citation2017; Szlafsztein & Sterr, Citation2007). In the present study, we have examined socio-economic vulnerability in SBR using its major components and their site-specific sub-indicators. Major components, namely, demographic, social, economic, food and water, and infrastructural components were used to examine the degree of sensitivity and adaptation. Exposure was analyzed using average storm surge height, slope amount, flood inundation, drainage proximity, and drainage density indicators. Slope amount is an important factor in highlighting the coastal susceptibility to floods and storm surges. The lower slope is more affected by seawater penetration and inundation (Kumar, Mahendra, Nayak, Radhakrishnan, & Sahu, Citation2010). The coastal areas of SBR are adversely affected by flood inundation and storm surge; thus, these indicators were chosen to analyze the vulnerability of the coastal blocks. Higher stream density results in a higher probability of spread and inundation (Golladay & Battle, Citation2002). Mean stream density, stream frequency, and morphology of the basin determine the fluvial dynamics such as flood occurrence, frequency, and size of the affected region (Bhattacharjee, Citation2016). The demographic vulnerability was assessed by using six important sub-components, namely, dependency ratio in the sampled households (HHs), percentage of illiterate household heads, percentage of female-headed households, percentage of household heads with higher education, percentage of households with basic housing structure, and percentage of old and child population. Age, gender, class, and economic status assume greater significance in analyzing disaster risk reduction (Ayeb‐Karlsson et al., Citation2019).
The social characteristics such as level of education, income, and disabled population are significant indicators for the risk mitigation process (Papathoma-Köhle, Cristofari, Wenk, & Fuchs, Citation2019). Six sub-components, namely, percentage of illiterate households, percentage of landless households, percentage of scheduled castes/scheduled tribes (SC/ST) households, percentage of households with family members migrated outside, percentage of households with primary source of income, and ratio of non-agricultural income to total income were chosen for assessing social vulnerability in SBR. Percentage of households depending on natural sources for income, percentage of unemployed households, percentage of households below poverty line, percentage of households with asset and land losses, percentage of households with livestock death, and percentage of households suffered from home damage were chosen for assessing economic conditions of surveyed households in SBR. Distance to health centre, percentage of households affected from vector-borne diseases, percentage of households affected with waterborne diseases, percentage of households with death caused due to natural hazards, and percentage of households attending health awareness camp and frequent check-up in the near hospital were chosen as sub-components for assessing health vulnerability.
Socio-economic vulnerability assessment incapacitates the analysis of the direction of socio-economic implications caused by climate change-induced disasters. Income, type of housing structures, health status, level of education, family structure, disabled population, and occupation have been identified as the essential components for vulnerability assessment (Demel, Udayanga, Gajanayake, Hapuarachchi, & Perera, Citation2019). Percentage of the sampled households with own agricultural production, percentage of households which have lost their agricultural land, percentage of households fetching water from >1 km distance, percentage of households using pond water as drinking water, percentage of households using boiled water for drinking, and percentage of households having water facilities within premises sub-components were chosen to assess the food and water vulnerability. Percentage of households without electricity facility, percentage of households without toilet facility, percentage of households with no accessibility to paved road, percentage of households having cemented house, distance to school, and percentage of households located along the river/road side sub-components were used for assessing the physical and infrastructural vulnerability.
4. Results
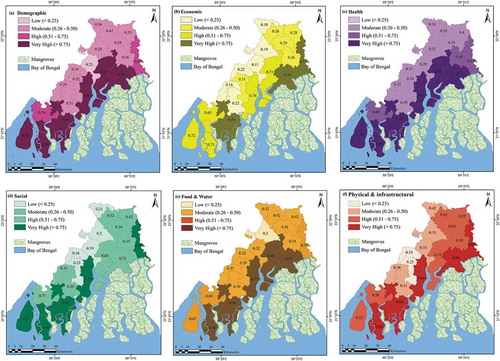
Most of the coastal blocks of SBR have experienced high and very high vulnerability. High degree of exposure and sensitivity while low level of adaptation has substantially contributed to very high to high vulnerability of these blocks. Demographic, social, economic, food and water, and infrastructure components contributed to varying degrees of vulnerability in these blocks. Coastal blocks were found more exposed to coastal disasters and sensitive to the damages driven by them. Low level of adaptation attributed to very high and high vulnerability in the coastal blocks of SBR. Most of the sampled households of coastal islands were badly affected by asset loss and home damages. Soil erosion and coastal inundation are major causes of vector-borne and waterborne diseases among the sampled households. The composite socio-economic vulnerability revealed that low health status and less access to food and water, low economic condition, and low provision of infrastructure are causes for high and very highsocio-economic vulnerability of the sampled households in SBR. The components of the SeVI are presented in .
Figure 3. Components of socio-economic vulnerability index: (a) demographic, (b) economic, (c) health, (d) social, (e) food and water, and (f) physical and infrastructure
4.1 Relative performance of vulnerability components
Very high exposure was found in Patharpratima, Namkhana, Kultali, and Gosaba blocks. All the factors of exposure were found inducing very high exposure in these blocks. Basanti, Kakdwip, Sagar, Sandeshkhali II, and Hasnabad blocks experienced high exposure. High drainage density, drainage proximity, and high storm surge height were identified the main factors for increasing the exposure in these blocks. Only two blocks, namely, Sandeshkhali I and Minakhan blocks were found under moderate exposure. Low exposure was found in Mathurapur I, Mathurapur II, Haroa, Jaynagar I, Jaynagar II, Canning I, and Canning II blocks ( and ). These blocks being located away from the coast are less affected by flood inundation and storm surge.
Figure 4. Degree of household exposure in SBR
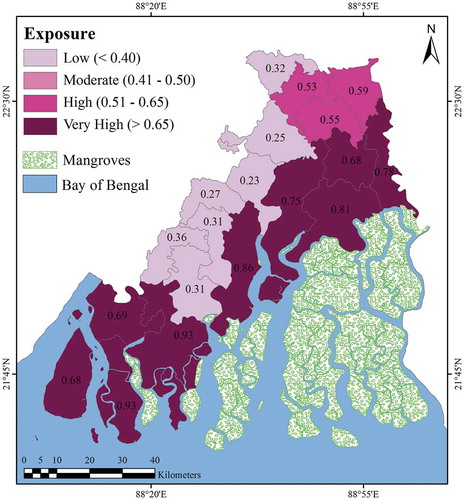
Table 1. Index values of exposure indicators in SBR
Sensitivity analysis revealed that Patharpratima, Namkhana, Kultali, Gosaba, and Basanti blocks were very highly sensitive in SBR. Demographic, social, economic, health, food and water, and physical and infrastructural factors increased the sensitivity of these blocks. The high dependency ratio, unemployment, high proportion of child and women, unavailability of electricity, sanitation facilities, high vector and waterborne diseases, and unavailability of paved roads were identified significant sub-indicators for raising the degree of sensitivity of these blocks. Hingalganj, Sagar, and Kakdwip blocks experienced high sensitivity due to low social, demographic, and economic structure. Most of the households in these blocks were illiterate, largely affected by disaster damages, and located along the rivers. Moderate sensitivity prevailed in Sandeshkhali II, Hasnabad, and Sandeshkhali II blocks. Demographic, health, and food and water components contributed moderate sensitivity in these blocks ( and ). Minakhan, Mathurapur I, Mathurapur II, Jaynagar II, Haroa, Canning II, Jaynagar I, and Canning I blocks were experienced low sensitivity. These blocks have a good socio-economic status than the rest of the blocks in SBR.
Figure 5. Degree of household sensitivity in SBR
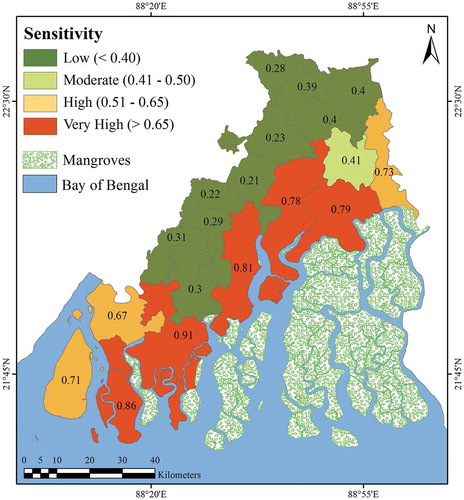
Table 2. Index values of sensitivity indicators in SBR
In the case of adaptation, Jaynagar II, Haroa, Canning II, Jaynagar I, Canning I, and Mathurapur II blocks registered very high adaptation. The high adaptation was identified in Minakhan, Mathurapur I, Kakdwip, and Sandeshkhali I blocks. These blocks have performed well in higher education, have a good health condition, have a high percentage of cemented houses, and have sources of water within their premises. Only two blocks, namely, Sagar and Basanti experienced moderate adaptation, while Hasnabad, Sandeshkhali II, Namkhana, Gosaba, Patharpratima, Hingalganj, and Kultali blocks were found under low adaptation ( and ). These blocks registered low level of higher education, lack of amenities and facilities, and prevalence of muddy structures. Effective adaptation measures are required to increase the level of adaptation in these blocks.
Figure 6. Degree of household adaptation in SBR
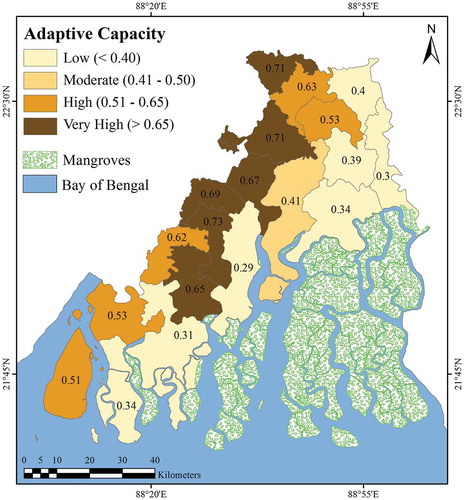
Table 3. Index values of adaptation indicators in SBR
4.2 Composite socio-economic vulnerability (SeVI)
The vulnerability scores are presented in . Analysis of composite socio-economic vulnerability (SeVI) revealed a very high vulnerability in Patharpratima, Namkhana, Kultali, Gosaba, and Basanti blocks. These blocks registered a high degree of exposure and sensitivity. The frequent onset of disasters, lack of early warning system, and unscrupulous health facilities are also responsible for increasing the vulnerability of these blocks. Thus, adaptation must be increased to lessen the impact of vulnerability in these blocks. High vulnerability prevailed in Sagar, Kakdwip, and Hingalganj blocks of SBR. High degree of exposure and sensitivity while low adaptation contributed high vulnerability in these blocks. Minakhan, Sandeshkhali I, Sandeshkhali II, and Hasnabad blocks were found under moderate vulnerability, while Jaynagar II, Haroa, Mathurapur I, Mathurapur II, Canning II, Jaynagar I, and Canning I blocks found under low vulnerability ( and ). These blocks are situated inland areas and have a high degree of adaptation than the coastal blocks.
Figure 7. IPCC-dimension-wise vulnerability scores for the blocks of SBR
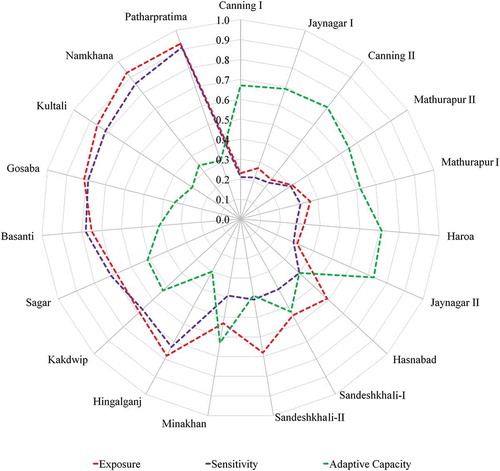
Figure 8. Composite socio-economic vulnerability index (SeVI) of the sampled households in various blocks of SBR
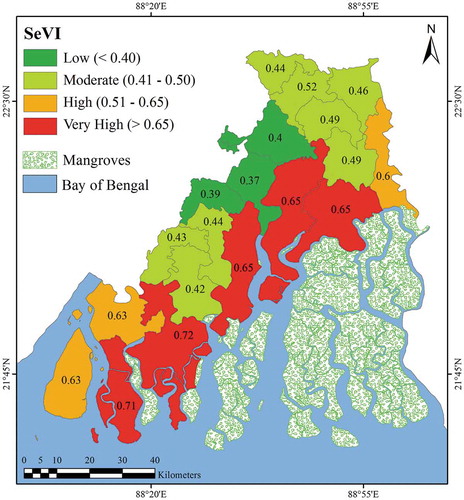
Table 4. SeVI and its component indices in SBR
5. Discussion and policy implication
The overall analysis of socio-economic vulnerability to climate change revealed that the majority of the sampled households in SBR was highly affected by flood and cyclone hazards. Decrease in fish production and salinization of agricultural land are the major threats to coastal communities. Water- and vector-borne diseases and inadequacy of medical facilities are also affecting the health of the people. Many agricultural lands in coastal blocks were severely affected by salinity intrusion and thus rendered without cultivations aftermath of Aila cyclone in 2009. Moreover, due to huge losses of mangrove forests, there are several restrictions from the government for the collection of forest products. Consequently, large-scale migration has occurred from these coastal blocks. This has affected the socio-economic conditions of SBR to a larger extent.
SeVI has been identified as an effective tool for analyzing vulnerability at the household level. It enhances disaster management intervention by increasing the knowledge about disaster implication at the households’ level and assist in location-specific vulnerability assessment (Ahsan & Warner, Citation2014; Kontogianni, Damigos, Kyrtzoglou, Tourkolias, & Skourtos, Citation2019; Sorg et al., Citation2018). SeVI analysis revealed that Patharpratima, Namkhana, Kultali, Gosaba, Basanti, Sagar, Kakdwip, Hingalganj, Minakhan, Sandeshkhali II, Sandeshkhali I, and Hasnabad blocks require immediate attention to minimize the level of vulnerability (). These blocks have registered a high degree of exposure and sensitivity with negligible adaptation. These priority blocks are located along the coast and have been experiencing huge devastation due to disasters. Thus, efforts could be made to increase the adaptive capacity in these blocks as improving the early warning system, disaster preparedness, infrastructural development, provision of basic health facilities, and improvement of infrastructure to reduce the socio-economic vulnerability. Jaynagar II, Haroa, Mathurapur I, Mathurapur II, Canning II, Jaynagar I, and Canning I blocks also require attention to minimize the degree of exposure while efforts should be made to minimize the sensitivity in Canning II, Jaynagar I, and Canning I blocks of SBR ().
Table 5. Priority blocks for vulnerability reduction in SBR
Formulation of holistic vulnerability framework, inclusion of coastal communities in suggesting adaptative measures, and effective coastal zone management plan will be helpful in lessening the impact of vulnerability in SBR. However, scientific uncertainty leads to decision paralysis and biasness in policy for local-level adaptation. Cost-effective solutions, increasing knowledge among coastal communities, enhancing resistance capacity, facilitating disaster response, and enhancing coordination among stakeholders, communities, and regional policymakers may help to overcome the policy issues, increase in adaptation, and lessening the vulnerability in coastal areas. Management of natural resources and increasing adaptation among farmers will also help to reduce the vulnerability in SBR.
6. Conclusion
This article has explored the extent of household vulnerability in the tenuous ecosystem of the Indian SBR using pragmatic approach. A total of 6 socio-economic components and 36 sub-components were used to develop the composite SeVI. Spatial analysis of composite socio-economic vulnerability revealed very high vulnerability in Basanti, Gosaba, Kultali, Namkhana, and Patharpratima blocks. These blocks are highly exposed to extreme weather events and socio-economically sensitive. Kakdwip, Sagar, and Hingalganj blocks experienced high socio-economic vulnerability due to deprived social structure, frivolous infrastructure, low economic condition, and meagre healthcare facilities. These blocks also suffered from severe water, food, and health problems. Many of the sampled households were found using pond or river water as drinking water in these blocks. Mathurapur I, Mathurapur II, Haroa, Minakhan, Sandeshkhali I, Sandeshkhali II, and Hasnabad blocks came under moderate socio-economic vulnerability. Mathurapur I, Mathurapur II, and Jaynagar II require immediate attention and efficacious policy measures for socio-economic development in SBR.
Strengthening the social system with provision of economic opportunities is essential for lessening socio-economic vulnerability. Education and awareness among local communities may ameliorate the understanding of the magnitude and implications of severe weather events. Consolidated infrastructural setup, proper early warning system, disaster monitoring centres, and better transport connectivity within remote islands may enhance the mobility and provide long-term sustainability in the development of SBR. Improvement in healthcare facilities, indurate embankment along the rivers and villages located along coastal areas, capturing better livelihood opportunities as tourism, minimizing population pressure on resources, mangrove conservation, and disaster risk management are other measures which if adopted may uplift the physical and social structure of the Reserve. Moreover, enhancing the traditional activities may have a credible positive impact than advancing the new ones. Further, vulnerability studies may include analysis of the magnitude of disaster damages, and more inherent indicators for vulnerability assessment must be incorporated. Use of comprehensive index may also increase the feasibility of climate change-induced vulnerability assessment. Monitoring the spatial pattern of physical changes in landscape and adoption of sustainable approach (ecological, social, and economic components) may be effective in planning and managing the critical natural resources in vulnerable hotspots.
Highlights
Pragmatic approach was utilized for analyzing socio-economic vulnerability in SBR
Components and sub-components of exposure, sensitivity, and adaptation were analyzed
Coastal blocks were highly and very highly vulnerable to disasters
Remoteness, frivolous infrastructural setup, and land losses restricted development
Monitoring centres, early warning system, and awareness mechanism are suggested
Supplemental Material
Download Zip (83.1 KB)Acknowledgments
The authors are incredibly thankful to the anonymous reviewers for their constructive comments and suggestions which helped to improve the overall quality of the work.
Supplemental data
Supplemental data for this article can be accessed here.
Disclosure statement
No potential conflict of interest was reported by the authors.
References
- Abid, M., Schilling, J., Scheffran, J., & Zulfiqar, F. (2016). Climate change vulnerability, adaptation and risk perceptions at farm level in Punjab, Pakistan. Science of the Total Environment, 547, 447–460.
- Abuodha, P. A., & Woodroffe, C. D. (2010). Assessing vulnerability to sea-level rise using a coastal sensitivity index: A case study from southeast Australia. Journal of Coastal Conservation, 14(3), 189–205.
- Ahmed, R., Sajjad, H., & Husain, I. (2018). Morphometric parameters-based prioritization of sub-watersheds using fuzzy analytical hierarchy process: A case study of lower Barpani Watershed, India. Natural Resources Research, 27(1), 67–75.
- Ahsan, M. N., & Warner, J. (2014). The socioeconomic vulnerability index: A pragmatic approach for assessing climate change led risks—A case study in the south-western coastal Bangladesh. International Journal of Disaster Risk Reduction, 8, 32–49.
- Ayeb‐Karlsson, S., Kniveton, D., Cannon, T., van der Geest, K., Ahmed, I., Derrington, E. M., … Opondo, D. O. (2019). I will not go, I cannot go: Cultural and social limitations of disaster preparedness in Asia, Africa, and Oceania. Disasters, 43(4), 752–770.
- Banerjee, K., Senthilkumar, B., Purvaja, R., & Ramesh, R. (2012). Sedimentation and trace metal distribution in selected locations of Sundarbans mangroves and Hooghly estuary, northeast coast of India. Environmental Geochemistry and Health, 34(1), 27–42.
- Bhattacharjee, N. (2016). Links among drainage density, frequency and flooding in Nanoi Rivers Basin, Assam. International Journal of Interdisciplinary Research in Science Society and Culture, 2(1), 43–57.
- Blaikie, P., Cannon, T., Davis, I., & Wisner, B. (2005). At risk: Natural hazards, people’s vulnerability and disasters. Routledge, London and New York.
- Bohle, H. G., Downing, T. E., & Watts, M. J. (1994). Climate change and social vulnerability: Toward a sociology and geography of food insecurity. Global Environmental Change, 4(1), 37–48.
- Bray, F., Jemal, A., Grey, N., Ferlay, J., & Forman, D. (2012). Global cancer transitions according to the Human Development Index (2008–2030): A population-based study. The Lancet Oncology, 13(8), 790–801.
- Brooks, N. (2003). Vulnerability, risk and adaptation: A conceptual framework. Tyndall Centre for Climate Change Research Working Paper, 38(38), 1–16.
- Challinor, A. J., Simelton, E. S., Fraser, E. D. G., Hemming, D., & Collins, M. (2010). Increased crop failure due to climate change: Assessing adaptation options using models and socio-economic data for wheat in China. Environmental Research Letters, 5(3), 034012, (8pp).
- Ciurean, R. L., Schroter, D., & Glade, T. (2013). Conceptual frameworks of vulnerability assessments for natural disasters reduction. In Approaches to disaster management—Examining the implications of hazards, emergencies and disasters. Tiefenbacher, J. (Ed.), (pp. 3-31). London, UK: IntechOpen. doi:10.5772/55538
- Demel, M. S. V., Udayanga, N. W. B. A. L., Gajanayake, B., Hapuarachchi, B., & Perera, D. (2019). Developing a socioeconomic vulnerability index using two agricultural communities exposed to climate change: A case study in Wanathawilluwa in Puttlam District of Sri Lanka. Applied Economics & Business, 3(1), 70–79.
- Dintwa, K. F., Letamo, G., & Navaneetham, K. (2019). Measuring social vulnerability to natural hazards at the district level in Botswana. Jàmbá Journal of Disaster Risk Studies, 11(1). doi:10.4102/jamba.v11i1.447
- Dumenu, W. K., & Obeng, E. A. (2016). Climate change and rural communities in Ghana: Social vulnerability, impacts, adaptations and policy implications. Environmental Science & Policy, 55, 208–217.
- Fekete, A. (2019). Social vulnerability (re-) assessment in context to natural hazards: Review of the usefulness of the spatial indicator approach and investigations of validation demands. International Journal of Disaster Risk Science, 10(2), 1–13.
- Fischer, G., Shah, M. N., Tubiello, F., & Van Velhuizen, H. (2005). Socio-economic and climate change impacts on agriculture: An integrated assessment, 1990–2080. Philosophical Transactions of the Royal Society B: Biological Sciences, 360(1463), 2067–2083.
- Ghosh, A., Schmidt, S., Fickert, T., & Nüsser, M. (2015). The Indian Sundarban mangrove forests: History, utilization, conservation strategies and local perception. Diversity, 7(2), 149–169.
- Golladay, S. W., & Battle, J. (2002). Effects of flooding and drought on water quality in gulf coastal plain streams in Georgia. Journal of Environmental Quality, 31(4), 1266–1272.
- Gopal, B., & Chauhan, M. (2006). Biodiversity and its conservation in the Sundarban mangrove ecosystem. Aquatic Sciences, 68(3), 338–354.
- Hahn, M. B., Riederer, A. M., & Foster, S. O. (2009). The livelihood vulnerability index: A pragmatic approach to assessing risks from climate variability and change—A case study in Mozambique. Global Environmental Change, 19(1), 74–88.
- Hammersley, M. (2018). Routledge revivals: The dilemma of qualitative method (1989): Herbert Blumer and the Chicago tradition. Routledge, London. doi:10.4324/9781351037709
- Hazra, S., Ghosh, T., DasGupta, R., & Sen, G. (2002). Sea level and associated changes in the Sundarbans. Science and Culture, 68(9/12), 309–321.
- IPCC. (2007). Fourth assessment report. Intergovernmental Panel on Climate Change Secretariat. Geneva, Switzerland. Retrieved from https://www.ipcc.ch/pdf/assessment-report/ar4/wg2/ar4_wg2_full_report.pdf
- IPCC. (2018). Summary for policymakers. In V. Masson-Delmotte, P. Zhai, H. O. Pörtner, D. Roberts, J. Skea, P. R. Shukla, … T. Waterfield (Eds.), Global warming of 1.5°C. An IPCC special report on the impacts of global warming of 1.5°C above pre-industrial levels and related global greenhouse gas emission pathways, in the context of strengthening the global response to the threat of climate change, sustainable development, and efforts to eradicate poverty (pp. 32). Geneva, Switzerland: World Meteorological Organization.
- Kelkar, U., Balachandra, P., & Gurtoo, A. (2011). Assessing Indian cities for vulnerability to climate change. In Proceedings of the 2nd international conference on environmental science and development IPCBEE (Vol. 4), IACSIT Press, Singapore.
- Kontogianni, A., Damigos, D., Kyrtzoglou, T., Tourkolias, C., & Skourtos, M. (2019). Development of a composite climate change vulnerability index for small craft harbours. Environmental Hazards, 18(2), 173–190.
- Kumar, T. S., Mahendra, R. S., Nayak, S., Radhakrishnan, K., & Sahu, K. C. (2010). Coastal vulnerability assessment for Orissa State, east coast of India. Journal of Coastal Research, 263, 523–534.
- Luers, A. L., Lobell, D. B., Sklar, L. S., Addams, C. L., & Matson, P. A. (2003). A method for quantifying vulnerability, applied to the agricultural system of the Yaqui Valley, Mexico. Global Environmental Change, 13(4), 255–267.
- Mahadevia Ghimire, K., & Vikas, M. (2012). Climate change—Impact on the Sundarbans, a case study. International Scientific Journal: Environmental Science, 2(1), 7–15.
- Malakar, K., & Mishra, T. (2017). Assessing socio-economic vulnerability to climate change: A city-level index-based approach. Climate and Development, 9(4), 348–363.
- Manna, S., & Raychaudhuri, B. (2018). Mapping distribution of Sundarban mangroves using sentinel-2 data and new spectral metric for detecting their health condition. Geocarto International, 1–19, Accepted manuscript, doi:10.1080/10106049.2018.1520923.
- Miettinen, R., Samra-Fredericks, D., & Yanow, D. (2009). Re-turn to practice: An introductory essay. Organization Studies, 30(12), 1309–1327.
- Mitra, A., Banerjee, K., Sengupta, K., & Gangopadhyay, A. (2009). Pulse of climate change in Indian Sundarbans: A myth or reality? National Academy Science Letters (India), 32(1), 19.
- Moss, R. H., Edmonds, J. A., Hibbard, K. A., Manning, M. R., Rose, S. K., Van Vuuren, D. P., … Meehl, G. A. (2010). The next generation of scenarios for climate change research and assessment. Nature, 463, 747.
- Mukhopadhyay, A. (2009). Cyclone Aila and the Sundarbans: An enquiry into the disaster and politics of aid and relief (pp. 18–20). Kolkata: Mahanirban Calcutta Research Group.
- Ogie, R. I., & Pradhan, B. (2019). Natural hazards and social vulnerability of place: The strength-based approach applied to Wollongong, Australia. International Journal of Disaster Risk Science, 10(3), 404–420.
- Orencio, P. M. (2014). Developing and applying composite indicators for assessing and characterizing vulnerability and resilience of coastal communities to environmental and social change.
- Owusu, M., & Nursey-Bray, M. (2019). Socio-economic and institutional drivers of vulnerability to climate change in urban slums: The case of Accra, Ghana. Climate and Development, 11(8), 687–698.
- Pandey, R., & Bardsley, D. K. (2015). Social-ecological vulnerability to climate change in the Nepali Himalaya. Applied Geography, 64, 74–86.
- Papathoma-Köhle, M., Cristofari, G., Wenk, M., & Fuchs, S. (2019). The importance of indicator weights for vulnerability indices and implications for decision making in disaster management. International Journal of Disaster Risk Reduction, 36, 101103.
- Raha, A., Das, S., Banerjee, K., & Mitra, A. (2012). Climate change impacts on Indian Sunderbans: A time series analysis (1924–2008). Biodiversity and Conservation, 21(5), 1289–1307.
- Rygel, L., O’sullivan, D., & Yarnal, B. (2006). A method for constructing a social vulnerability index: An application to hurricane storm surges in a developed country. Mitigation and Adaptation Strategies for Global Change, 11(3), 741–764.
- Sahana, M., & Sajjad, H. (2019). Vulnerability to storm surge flood using remote sensing and GIS techniques: A study on Sundarban Biosphere Reserve, India. Remote Sensing Applications: Society and Environment, 13, 106–120.
- Sajjad, H., & Nasreen, I. (2016). Assessing farm-level agricultural sustainability using site-specific indicators and sustainable livelihood security index: Evidence from Vaishali district, India. Community Development, 47(5), 602–619.
- Sam, A. S., Kumar, R., Kächele, H., & Müller, K. (2017). Quantifying household vulnerability triggered by drought: Evidence from rural India. Climate and Development, 9(7), 618–633.
- Sathyan, A. R., Funk, C., Aenis, T., Winker, P., & Breuer, L. (2018). Sensitivity analysis of a climate vulnerability index—A case study from Indian watershed development programmes. Climate Change Responses, 5(1), 1.
- Slettebak, R. T. (2013). Climate change, natural disasters, and post-disaster unrest in India. India Review, 12(4), 260–279.
- Sorg, L., Medina, N., Feldmeyer, D., Sanchez, A., Vojinovic, Z., Birkmann, J., & Marchese, A. (2018). Capturing the multifaceted phenomena of socioeconomic vulnerability. Natural Hazards, 92(1), 257–282.
- Sullivan, C. A., Meigh, J. R., & Fediw, T. S. (2002). Derivation and testing of the water poverty index phase 1. Final report may 2002. Retrieved from http://nora.nerc.ac.uk/id/eprint/503246
- Szlafsztein, C., & Sterr, H. (2007). A GIS-based vulnerability assessment of coastal natural hazards, state of Pará, Brazil. Journal of Coastal Conservation, 11(1), 53–66.
- Tian, Q., & Lemos, M. C. (2018). Household livelihood differentiation and vulnerability to climate hazards in rural China. World Development, 108, 321–331.
- Twigg, J. (2004). Disaster risk reduction: Mitigation and preparedness in development and emergency programming, humanitarian practice network. London: Overseas Development Institute. Retrieved from https://www.preventionweb.net/educational/view/8450
- UNDP: United Nations Development Programme. (2019). NDC global outlook report 2019, The Heat Is On: Taking Stock of Global Climate Ambition. Retrieved from https://unfccc.int/news/the-heat-is-on-taking-stock-of-global-climate-ambition
- UNISDR. (2018). Reduction. Economic losses, poverty & disasters: 1998–2017. Retrieved from https://www.unisdr.org/we/inform/publications/61119
- Wisner, B., Gaillard, J. C., & Kelman, I. (2012). Framing disaster: Theories and stories seeking to understand hazards, vulnerability and risk. In Handbook of hazards and disaster risk reduction.Wisner, B., Gaillard, J. C., & Kelman, I. (Eds.), (pp. 47–62). London: Routledge.