
 ?Mathematical formulae have been encoded as MathML and are displayed in this HTML version using MathJax in order to improve their display. Uncheck the box to turn MathJax off. This feature requires Javascript. Click on a formula to zoom.
ABSTRACT
Afforestation/Reforestation and conserving the forests are the low-cost measures to climate change mitigation. However, loss of forest biomass through over-extraction affects the overall carbon concentration in the forests. The present study conducted its attempts in the Hazarikhil forest under the Chittagong North forest division of Bangladesh with the primary objectives of getting a gain and loss quantification of carbon. The total highest biomass density, 348.93 ± 48.00 tha−1, was in the Acacia auriculiformis stands, while it was the lowest, 196.36 ± 32.54 tha−1 in the Senna siamea stands. The total biomass-carbon density was the highest, 174.47 ± 24.00 tCha−1, in the A. auriculiformis stands, while it was the lowest, 98.18 ± 5.45 tCha−1, in the S. siamea stands. The highest biomass loss, 10.65 ± 0.45 tha−1 yr−1, was in the A. auriculiformis stands while it was the lowest, 4.48 ± 0.87 tha−1 yr−1 in Chukrasia tabularis stands. Soil organic carbon stock was the highest, 19.10 ± 0.91 tCha−1 and 57.31 ± 2.72 tCha−1, in the Tectona grandis stands for both 0–10 cm soil depth and 0–30 cm soil depth, respectively. The lowest, 6.66 ± 1.22 tCha−1 and 19.97 ± 3.54 tCha−1, were in the S. siamea stands. However, the total of soil organic carbon and biomass-carbon was the highest, 191.13 ± 23.99 tCha−1 and 224.45 ± 24.13 tCha−1 in the A. auriculiformis stands for both 0–10 cm and 0–30 cm soil depth, respectively. The lowest, 104.84 ± 21.69 tCha−1 and 118.15 ± 24.56 tCha−1, total carbon was in the S. siamea stands for both the soil depths, respectively. The findings of the study can be useful to climate change mitigation practitioners in Bangladesh.
Introduction
Global climate change is occurring relentlessly due to the increasing concentration of the greenhouse gas (GHG) emission. Deforestation and forest degradation are significant causes of the higher concentration of GHG (Karl & Trenberth, Citation2003). Sustainable forest management keeping the natural forest ecosystem intact and afforesting the deforested, degraded forests, and newly accreted lands are the low-cost solutions to climate change mitigation (Canadell & Raupach, Citation2008).
Forest ecosystems sequester a significant amount of carbon in woody tissues and soils (Pugh et al., Citation2019). FAO (Citation2001) proposes three possible strategies for the management of forest carbon. The first is to increase the amount or rate of carbon accumulation by creating or enhancing carbon sinks (carbon sequestration). The second is to prevent or reduce the rate of release of carbon already fixed in existing carbon sinks. The third strategy is to reduce the demand for fossil fuels by increasing the use of wood, either for durable wood products (i.e., the substitution of energy-intensive materials such as steel and concrete) or for biofuel (carbon substitution). According to the decision undertaken in the COP9, industrialized countries will be able to meet a part of their emission reduction commitments under the Kyoto protocol by financing afforestation and reforestation (A/R) activities in developing countries through the Clean Development Mechanism (CDM) (IPCC, Citation2003). The cost-effectiveness in the emission reduction, having high potential rates of carbon uptake in the tropical developing countries, leads to increased attention focuses on tropical forestry to offset carbon emission. The attention on REDD+ (Reducing Emissions from Deforestation and forest Degradation, and enhancement of carbon with sustainable forest management) is one of them (Lederer, Citation2011; Savaresi, Citation2012). REDD+ implies actions to i) reduce emissions by avoiding deforestation and forest degradation, and ii) increase removals, which means enhance carbon stocks through forest restoration, rehabilitation, and conservation (Lederer, Citation2011).
Knowledge of the carbon dynamics and any changes, which take place over time, can contribute significantly to quantify the carbon sequestration by forests. The carbon sequestration potential of forests is specific to the species, site, and management involved, and it is, therefore, very variable. Species and site-specific carbon uptake data are necessary to visualize the actual carbon sequestration in a region/country. Hansen et al. (Citation2004), Cannell (Citation2003), Pussinen et al. (Citation1997), Karjalainen (Citation1996), Ravindranath and Somashekhar (Citation1995), and Ismail (Citation1995) identify carbon sequestration by the national forests and afforestation/reforestation (A/R) projects. Assuming a global land availability of 345 million ha for A/R and agroforestry activities, Brown et al. (Citation1996) estimate that it can offset approximately 38 Gt of carbon over the next 50 years-i.e., 31 Gt by A/R and 7 Gt through the increased adoption of agroforestry practices. Shin et al. (Citation2007) estimate that tree tissues in the forests of Bangladesh, store, on average, 92 tCha−1, more specifically, closed-large-crown forests 110 tCha−1; and disturbed open forests 49 tCha−1.
The forest scientists consider trees as the most crucial carbon sink and biomass source in the world (Camacho et al., Citation2011). The global climate change, along with the other factors, impacts negatively on the biomass in the natural forests of many countries (Kirilenko & Sedjo, Citation2007). In this way, forest biomass degradation will release more carbon to the earth (Rolim et al., Citation2005). Many studies conducted attempts for measuring tree carbon (Brown, Citation1997; Frouz et al., Citation2009; Gibbs & Brown, Citation2007; Hamburg, Citation2000; Haripriya, Citation2000; Kaonga & Bayliss-Smith, Citation2009; Kim Phat et al., Citation2004; Kongsager et al., Citation2013; Lal & Singh, Citation2000; Lasco & Cardinoza, Citation2007; Sharma et al., Citation2015; Shrestha & Singh, Citation2008; Xiao et al., Citation2011). The government forests of Bangladesh are under severe pressure mainly due to the higher demand for forest resources (i.e., timber, fuelwood, bamboo, leaves, medicinal plants, fodder, etc.) and illegal settlement (Iftekhar & Hoque, Citation2005). Both carbon sink and loss happen simultaneously in the forests of Bangladesh. Hill forests of Bangladesh, covering 1.4 million ha, plays a very crucial role in the conservation of biodiversity, supplying forest resources and maintaining the biological process (Khan et al., Citation2007). In the hill forests of Bangladesh, understanding the carbon flux for any recognized forest area is so far absent. Nevertheless, it is an essential piece of information particularly for better management planning and wise forestry decisions in order to reduce the carbon loss. From the available literature review (Haripriya, Citation2000; Shrestha & Singh, Citation2008), it is clear that quantification of tree carbon offset and losses of carbon through pilferage of forest biomass is the critical consideration for identifying ultimate impacts on the climate change. This net quantification will contribute to the accounting of carbon credit through A/R CDM and REDD+. Hazarikhil forest is an ideal representative of the tropical hill forests of Bangladesh. This study monitored both carbon offset and carbon loss in the hilly forest areas in the Hazarikhil forest area which is under the Chittagong North Forest Division, Bangladesh. The present study hypothesizes that Hazarikhil forests offset a considerable quantity of atmospheric carbon along with the loss of carbon due to the pilferages of forest biomass. The research questions were what was the rate of carbon offsets by the tree and soil pool of the Hazarikhil forests? Also, what was the rate of loss of carbon due to the pilferages of forest biomass? The study had the specific objectives to identify the carbon sequestration by the trees in the forests, to quantify the carbon sequestration in the soils of the forests, and to identify the net carbon stock/flow in the forests of Hazarikhil.
Materials and methods
The geographic scope of the study was in the Hazarikhil forest areas lying between 22°40ʹ and 22°46ʹN latitude and between 91°38ʹ and 91°42ʹE longitude under the Chittagong North Forest Division of Bangladesh. The specific study area was in the Hazarikhil forest beat. The study conducted its attempts from August 2018 to May 2019.
Description of the study area
The study area was under the Hazarikhil Wildlife sanctuary (HWS) (). It includes the entire area of Hazarikhil and Rangapani blocks of the Hazarikhil forest beat and Harowalchari block of the Fatikchari forest beat under Hazarikhil Forest Range. The northern boundary of the sanctuary touches Idilpur Badurkhil Block of Balukhali Beat under Narayanhat Range. The eastern boundary touches the Balukhali Beat under Narayanhat Range and Fatikchari Block of Fatikchari Beat under the Hazarikhil Range and Harualcahri canal (Khal). The southern boundary touches the Baromashia Block of Hazarikhil Range. The western boundary touches the ridge of Reserve Forest of Ramghar-Sitakunda under Mirsharai Upazilla, and Kunderhat Block of Bartakia Beat under Baraiyadhala Range, and also Wahedpur Block of Baraiyadhala Beat and Baraiyadhala Block.
Figure 1. Satellite view of the Hazarikhil forest area under the Chittagong North Forest Division of Bangladesh. Used in Hossain (Citation2015)
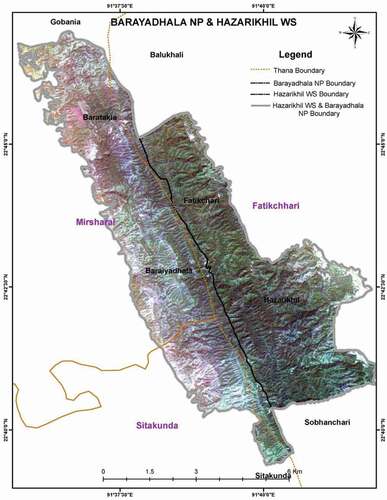
The HWS is formerly a part of the reserved forest of the Chittagong North Forest Division. The Ministry of Environment and Forests declared Hazarikhil reserve forests as Hazarikhil Wildlife Sanctuary (2908.50 ha) on 6 April 2010 by the gazette notification no. MoEF/For-Sec-02/02 Wildlife Sanctuary/11/2010/211 dated 06/04/2010 under the power given under section 23(3) of Bangladesh Wildlife (Preservation) (Amendment) Act 1974 (Hossain, Citation2015). The forest is under the jurisdiction of the Hazarikhil Forest Range of Chittagong North Forest Division. According to Bangladesh Wildlife (Preservation), (Amendment) Act of 1974, any killing, hunting, or trapping of any wildlife, agricultural activities, living, or entering into the sanctuary of any persons or destruction to the sanctuary habitat are strictly prohibited.
The HWS enjoys a tropical monsoon climate, characterized by basically four seasons, e.g., Winter (December-February), summer (March-May), monsoon (June-September), and autumn (October-November). The south-west monsoon provides the majority of the annual rainfall. The average annual rainfall of the area is 3000 mm, with a range of 1,611–3,878 mm. On average, the highest rainfall occurs in July (727 mm), and the lowest rainfall in January (5–6) mm. The temperature range of the area is 12.5°C to 37°C (Hossain, Citation2015). The low hill ranges cover part of the HWS while the rest is in the Bengal flood plain. The soils are clay to clayey loam on level ground and from sandy loam to coarse sand on hilly land. The clayey and sandy loams are fertile, and the sandy soil is rich in iron resulting in red or yellowish tinge. Soils developed in the hills from unconsolidated rocks are moderately well to excessively well-drained, generally deep, and probably the oldest soils in this region.
In contrast, those occurring on hills from consolidated rocks tend to form in weathered sandstone, shale, and siltstones (Hossain, Citation2015). It identified a total of 478 species belonging to 88 dicot families from the flora of the HWS (Rahman, Citation2015). Of these, 189 species are trees, 119 shrubs including 26 climbers/twiners and 170 herbs including 46 climbers and two epiphytes. Among the species, about 86 species are rare and endangered, and 14 species are critically endangered. The Hazarikhil Wildlife Sanctuary (WS) and Baraiyadhala National Park (NP) had a total of 85 birds, 27 mammals, 34 reptiles, and 12 amphibians species (Hossain, Citation2015). Ministry of Environment and Forests established co-management in the HWS in November 2014 under the project, Climate Resilient Ecosystems and Livelihoods (CREL) project (USAID, Citation2018). It formed the Co-management Committee (CMC) which had a critical role in protecting the forests.
Sampling and data collection
The study selected the Hazarikhil forest beat purposively because of its successful plantation practices. It considered only four frequently planted tree species in this study. The Hazarikhil forest range office confirmed about the frequently planted tree species in the Hazarikhil forest beat. The species were Acacia auriculiformis, Chukrasia tabularis, Senna siamea, and Tectona grandis. The department of forests planted all the mentioned species in monoculture in the study area. However, the stand of the species varied in ages. The ages of the stands of A. auriculiformis were 5-, 8-, 13-, 14- and 16-year-old. It was 18 years for both C. tabularis and S. siamea. Whereas, T. grandis were of 6-, 7-, 9-, 10-, 11-, 14-, 15-, and 17-year-old.
The study applied a simple random sampling technique to select 68 sampling plots in the study area for estimating biomass and carbon. The plot was 10 m x 10 m in size. It figured out tree species richness in the representative samples first. From all the plots, it measured the total height and diameter at breast height (dbh). A structured data sheet recorded data on diameter at breast height (dbh) at 1.3 m and the total height of the trees. It only considered the tree dbh measured 5 cm and above, for biomass and carbon study. To measure dbh, it used slide calipers and measuring tapes, and to measure total height, it used Suunto Clinometer.
The study collected three soil samples from 0–10 cm by the soil core of a known volume from each plot of a 1 m radius under the mother plot of vegetation study. Also, then, it compounded the samples into one. Likewise, it collected the other three soil samples from 0–30 cm soil depth. There was a total of 68 vegetation plots wherefrom each of the soil depth range, it collected 204 numbers of soil samples, but finally, the compounding the samples made it 68 numbers. Hence, for the whole study, it brought a total of 136 soil samples to the laboratory for soil organic carbon analysis.
A GPS recorded the centers of the plots as the global coordinates (latitude and longitude) for further monitoring of the same plots. The distribution of the sampled plots ranged from latitude N 22.68903° to N 22.91233° and longitude E 91.07895° to E 91.69096°.
Data analysis
Structure and growing stock of plantation
Firstly, the study figured out a richness of the frequently planted tree species in the representative samples. Secondly, it determined the distribution of the diameter (dbh) class and total height class of the trees species wise. The study classified the tree-data into four dbh and four height classes. For this, it used three cut points in all values to make dbh class and height class based on equal percentile with a width of 25%. Hence it made three height classes as ≤7.50, 7.51–9.50, 9.51–12.00, and 12.01 + m, and three dbh classes as ≤8.91, 8.92–12.18, 12.19–16.87, and 16.88+ cm.
The gain and loss method estimated the net offset of atmospheric carbon by the plantation forests under the Tier 1 approach of the IPCC (Citation2006). It followed the equation below;
Where ΔC = Annual carbon stock change in the pool, tones Cyr−1
ΔCG = Annual gain of carbon, tones Cyr−1
ΔCL = Annual loss of carbon, tones Cyr−1
It estimated the carbon stock due to the afforestation/reforestation/using the present growth data of trees planted. It measured the mean annual increment (MAI) using the age of the tree. It then transformed the biomass to carbon using the standard biomass-carbon conversion factor.
It used tree diameter (dbh) in the allometric equation of aboveground and belowground biomass. As species-specific allometric equation was not available during the analysis for all the species, it used only a general equation. It estimated the aboveground biomass density (ABD) of trees using the allometric model described by Pearson et al. (Citation2013).
Biomass (kg/tree) = exp(−2.289 + 2.649*lndbh-0.021*lndbh2), where ln is the natural logarithm of tree dbh.
The following model, described by Pearson et al. (Citation2013), estimated the belowground biomass density (BBD).
BBD, kg/tree = exp (−1.0587 + 0.8836 × ln ABD), here ln is the natural logarithm.
After that, it converted biomass, ABD and BBD, into carbon, ACD (Aboveground carbon density), and BCD (Belowground carbon density) using the standard biomass-carbon conversion factor, 0.5 (Pearson et al., Citation2013).
Determination of organic carbon in the soil
The study weighed the soil samples collected by the soil core in the field and then brought the samples to the soil laboratory for organic carbon measurement. It used the wet oxidation method for the determination of the soil organic carbon in the laboratory.
For measuring soil organic carbon in the wet oxidation method, the study used the following equation described by McLeod (Citation1973),
OC% = [0.003 g × N × 10 ml×(1- T/S) ×100] ÷ ODW = 3(1- T/S) ÷ ODW
Where, N = Normality of K2Cr2O7 solution
T = Volume of FeSO4 used in sample titration (mL)
S = Volume of FeSO4 used in blank titration (mL)
ODW = Oven-dry sample weight (g)
OM% = 10 [1(S ÷ B)] × 0.67
Where, S = Sample titration
B = Blank titration
The other name of this method is the Walkley-Black method (Walkley & Black, Citation1934).
Calculation of soil carbon
For measuring soil organic carbon, it applied the following equation described by Petersen (Citation1996).
Bulk density (gm/cm3) = mass (gm)/core volume (cm3)
C (t/ha) = [(soil bulk density (gm/cm3) × soil depth (cm) × C)] ×100
(C must express as a decimal fraction, for example, 2.2% expresses as 0.022 in the equation; bulk density must express as gm/cm3)
For determining the loss of biomass from the plantation, the study conducted a social survey of the nearby villages/entry of the forests. For confirming the social data, the study had a focus-group-discussion in the Hazarikhil forest range office.
To show the differences in biomass and its carbon concentration among the species and stands of different ages separately, the study conducted a One-way analysis of variance (ANOVA). It also carried out a linear regression analysis to show the effect of soil and age of the stands on the total biomass-carbon. The study applied IBM SPSS software and MS Excel for all of these analyses.
Results and discussion
Structural composition of the tree species
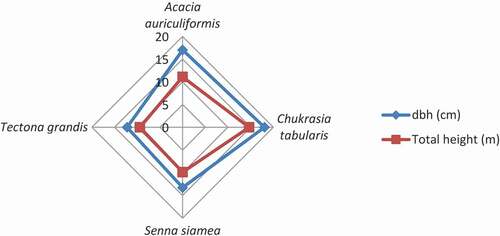
Among the tree species, the individuals of T. grandis had the highest density, 1836.56 ± 60.86 stem ha−1, and C. tabularis had the lowest density, 1166.67 ± 120.19 stem ha−1 (). However, the mean dbh and the total height was the highest in the C. tabularis stand, 18.06 ± 0.85 cm, and 14.66 ± 0.71 m, respectively (). While the lowest dbh was in the T. grandis stand, 12.23 ± 0.19 cm, and the lowest height was in the S. siamea stand, 9.88 ± 0.25 m. The structural composition of the tree species reflects in terms of height and diameter class distribution.
Figure 2. Density (number ha−1) of the individuals of the tree species in the Hazarikhil forest areas under the Chittagong North forest division of Bangladesh.
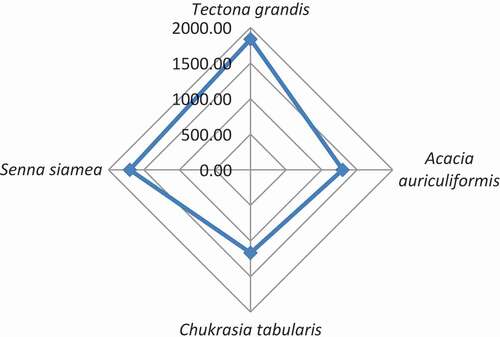
Figure 3. Diameter at breast height (dbh) and the total height of the tree species in the Hazarikhil forest area under the Chittagong North forest division of Bangladesh.
For A. auriculiformis, the dbh classes ≤8.91, 8.92–12.18, 12.19–16.87, and 16.88+ cm were dominant in the ≤7.50, 7.51–9.50, 9.51–12.00, and 12.01 + m, respectively, having 55.3%, 67.3%, 47.1% and 68%, respectively (). For C. tabularis, dbh classes ≤8.91 cm and 8.92–12.18 cm were dominant in the height classes ≤7.50 m and 7.51–9.50 m having almost all the individuals. For S. siamea, all the individuals under the ≤8.91 cm dbh class were present in the 7.51–9.50 m height class. For T. grandis, the dbh classes ≤8.91, 8.92–12.18, 12.19–16.87, and 16.88+ cm were dominant in the ≤7.50, 7.51–9.50, 9.51–12.00, and 12.01 + m, respectively, having 76.1%, 37%, 59% and 71.5%, respectively.
Table 1. Height and diameter at breast height (dbh) class distribution in the Hazarikhil forest area under the Chittagong North forest division of Bangladesh
The highest density per hectare and the lowest dbh of the T. grandis stand mean that the slow growth of this species did not have many human dimensions of biomass loss. The co-management activities in the Hazarikhil Wildlife Sanctuary (HWS) had an impact on protecting the illegal cutting, unlike the other forest areas of Bangladesh (USAID, Citation2018). For all the species, the range of density of the tree species varied from 1166.67 stem ha−1 to 1836.59 stem ha−1, which is promising in comparison to the other hill forests of Bangladesh. The awareness and authentic roles of the Co-management Committee (CMC) made the HWS almost free from illegal pilferage of the growing stock (Rahman et al., Citation2018). The dbh and height class distribution of A. auriculiformis, C. tabularis, and T. grandis show a balanced growth of the species, as the greater dbh dominates in the greater height classes in most of the cases. However, the growth performance of the four species under this study reveals a standard and steady growth (Deb et al., Citation2017; Islam et al., Citation1999). Hossain et al. (Citation2017) showed the distribution of tree individuals into height and diameter classes for Dudhpukuria-Dhopachari Wildlife Sanctuary. In that study, the percentage of tree individuals was progressively decreasing with the higher height and dbh classes, thus depicting a reverse j-shaped curve. The percentage of tree individuals occurring in the 4.5–14.4 m height class was the highest, 72.03%, followed by 14.5.-24.4 m with 22.54% tree individuals. In that study, the smallest dbh class, 10 – <25 cm, was represented with the maximum percentage (73.18%) of tree individuals followed by 25–40 cm dbh class with 17.45% tree individuals. The findings of this study which is similar to that of undisturbed tropical forests presented a different scenario than the present study. The present study considered the prominent plantations species of different ages that influenced the distribution of growth (height and dbh) classes significantly. However, the height-dbh relationship showed by Hossain et al. (Citation2017) indicated a positive relationship that is quite consistent with the findings of the present study representing the change of height with an increment of dbh in .
Figure 4. Total height distribution in the dbh class of the frequently planted tree species in the Hazarikhil forest areas under the Chittagong North forest division of Bangladesh.
Tree biomass growth
The highest aboveground biomass density (ABD), belowground biomass density (BBD), and total biomass density were 297.44 ± 41.67 tha−1, 51.49 ± 6.33 tha−1, and 348.93 ± 48.00 tha−1, respectively, in the A. auriculiformis stands (). Biomass loss was also the highest, 10.65 ± 0.45 tha−1 yr−1 in the same stands of the particular species. However, the stands of S. siamea had the lowest ABD, BBD, and the total biomass density as 163.74 ± 15.63 tha−1, 32.61 ± 3.67 tha−1, and 196.36 ± 32.54 tha−1, respectively. Biomass loss, 4.48 ± 0.66 tha−1 yr−1, also was the lowest in these stands. Considering the biomass loss, the study found that still, the A. auriculiformis had the highest net MAI, 19.13 ± 2.02 tha−1 yr−1 followed by T. grandis, 12.65 ± 1.18 tha−1 yr−1, C. tabularis, 11.40 ± 2.34 tha−1 yr−1 and S. siamea, 6.43 ± 2.31 tha−1 yr−1 ().
Figure 5. Total biomass, MAI of total biomass and net MAI of total biomass in the Hazarikhil forest areas under the Chittagong North forest division of Bangladesh.
Table 2. Tree biomass growth, its MAI and biomass loss in the Hazarikhil forest area under the Chittagong North forest division of Bangladesh
One-way ANOVA showed that total biomass (tha−1) in the stands significantly varied for p < 0.05 in species and different ages of the individuals of trees. The MAI of total biomass (tha−1 yr−1) also varied among the species for p < 0.01. However, the net MAI of total biomass (tha−1 yr−1) varied among the species for p < 0.05.
The total aboveground biomass for 4-5-year-old A. auriculiformis, 8-year-old Dipterocarpus turbinatus, and 4-year-old Pinus caribaea was 76, 51, 32 and 62 tha−1, respectively, in the campus of the Chittagong University (Osman et al., Citation1992). They also found variations in organic carbon among the three hill position. They reported that organic carbon was the highest in the bottom, followed by the middle and top slopes. It is due to the nutrients leaching from top to bottom through the middle slope (Gafur et al., Citation1979; Miah et al., Citation2001). However, the biomass density estimated in this study shows a standard and reasonable scale in comparison to the other study. As reported, massive deforestation is relentlessly occurring in the hill forests of Bangladesh (Reddy et al., Citation2016; Salam & Noguchi, Citation1998; Salam et al., Citation1999). However, the net MAI of the total biomass, estimated in this study, shows a promising trend of biomass growth of the tree species amid the biomass loss. The underlying driver of keeping this plantation in good health can be due to the co-management practice (Mohammad Chowdhury et al., Citation2010; M. S. H. Chowdhury et al., Citation2009).
Carbon in tree biomass
Similar to that of the biomass growth, total biomass carbon was the highest in the A. auriculiformis, 174.47 ± 24.00 tCha−1 followed by C. tabularis, 142.99 ± 21.03 tCha−1, T. grandis, 102.66 ± 8.66 tCha−1, and S. siamea 98.18 ± 5.45 tCha−1, respectively (). The MAI of biomass-carbon and net MAI of biomass-carbon followed the same trend also. The net MAI of biomass-carbon shows a promising carbon stock in the stands considering the carbon loss through biomass collection.
Table 3. Tree biomass-carbon, and its MAI in the Hazarikhil forest area under the Chittagong North forest division, Bangladesh
Shin et al. (Citation2007) estimated that forests of Bangladesh, on average, store 92 tCha−1 by the existing tree tissues in the forests. The specific figures are: closed large-crown forests 121 tCha−1, closed small-crown forests 87 tCha−1, disturbed closed forests 110 tCha−1 and disturbed open 49 tCha−1. In the hill forests zone of Bangladesh, the study found the highest average biomass-carbon content, 145 tCha−1 in the Aphanamixis polystachya stands, and the lowest, 43 tCha−1 was in the Swietenia mahagoni stands (Shin et al., Citation2007). The study found that an 8-year old A. auriculiformis stand had the highest (173 ± 64.82 tCha−1) biomass carbon content followed by the 12-year old A. polystachya stand (166 ± 6.86 tCha−1). The lowest (10 ± 2.31 tCha−1) biomass-carbon content was in the 6-year old D. turbinatus stand (Shin et al., Citation2007). The study of Shin et al. (Citation2007) found a net MAI of biomass-carbon, 4 ± 0.31 tCha−1 yr−1 considering the biomass productivity and loss of litter and fuelwood from the stands. Hence, the present study does not have any strange results of the net MAI of biomass-carbon. In comparison to the previous study in the hilly areas of Chittagong, the present study reveals the reasonable biomass-carbon concentration in the Hazarikhil forests.
Soil organic carbon stock and total carbon
Soil organic carbon stocks were the highest, 19.10 ± 0.91 tCha−1 and 57.31 ± 2.72 tCha−1, in the T. grandis stands for both 0–10 cm soil depth and 0–30 cm soil depth, respectively (). The lowest, 6.66 ± 1.22 tCha−1 and 19.97 ± 3.54 tCha−1, were in the S. siamea stands. However, the total of soil organic carbon and biomass-carbon was the highest, 191.13 ± 23.99 tCha−1 and 224.45 ± 24.13 tCha−1 in the A. auriculiformis stands for both 0–10 cm soil depth and 0–30 cm soil depth, respectively. The lowest, 104.84 ± 21.69 tCha−1 and 118.15 ± 24.56 tCha−1, total carbon was in the S. siamea stand for both the soil depths, respectively.
Table 4. Soil organic carbon and total carbon in the stands of Hazarikhil forests under the Chittagong North forest division of Bangladesh
One-way ANOVA showed that total biomass-carbon (tCha−1), total carbon including biomass-carbon, and soil organic carbon (tCha−1) for both the 0–10 cm and 0–30 cm soil depths varied significantly among the species and stands with different ages for p < 0.05 (). However, the age of the stands for all of the species affected the total biomass-carbon for p < 0.01. However, soil organic carbon concentration at both the 0–10 cm and 0–30 cm soil depths did not have any effect on the total biomass-carbon.
Figure 6. Total biomass-carbon, biomass-carbon including soil organic carbon for both 0–10 cm and 0–30 cm soil depths in the Hazarikhil forest areas under the Chittagong North forest division of Bangladesh.
This study reveals that the biomass-carbon influence the totality of the carbon stock in the stands. The unfavorable human impacts on the forests can decrease forest carbon very shortly (Shin et al., Citation2007). Over extraction and encroachment can create these unfavorable conditions in the forests. Unlike the present study site, the degradation of the hilly forest lands is uncontrolled. Therefore a large tract of forestlands can be vacant shortly in the hilly zone of Bangladesh. The soil organic carbon stocks in both the soil depths in the present study are lower than the average values of organic carbon stocks (ESSD, Citation1998). It assumes that the unfavorable human dimensions could affect the soil properties before getting the plantation on the forestlands of the study sites (Schoenholtz et al., Citation2000). However, there is evidence of adding organic carbon into the soil by plantation activities. Miah et al. (Citation2001) found that three years after the establishment of the plantation in the denuded hills of the Chittagong region, total net carbon was 79.36 tCha−1 in tree tissues and soil. Before the plantation establishment, the carbon stock was 30 tCha−1 and three years after plantation establishment, and it added 20 tCha−1. Following the previous results of the study in the Chittagong hilly areas, the present study can confirm that the reforestation in the Hazarikhil forests areas could add the organic carbon into the soil for sure. The findings prove the positive environmental impacts of afforestation and conservation practices, which were also mentioned by Whitehead (Citation2011).
Conclusion
The results of the study show a promising carbon sequestration rate in the plantations of Hazarikhil forests under the Chittagong North forest division. Before plantation, it was a degraded reserve forest. The study confirmed that plantation activities had an impact on the soil properties by adding organic carbon. Even though the highest organic carbon concentration in the forest soil, 57.31 ± 2.72 tCha−1, was lower than the average forest soil concentration in Asia, it is still a better addition than the other forests in the Chittagong hilly areas of Bangladesh. Moreover, the density of the tree individuals ranged from 1166.67 ± 120.19 to 1836.59 ± 60.86 stem ha−1, which is quite high than other similar forests of Bangladesh. It shows retarded human impacts on the plantations in the study areas. The study comments that this is due to the impact of co-management practice in the Hazarikhil Wildlife sanctuary. The forest conservation institution developed by the co-management committee (CMC) supported by the USAID funded CREL (Climate Resilient Ecosystems and Livelihoods) project can have this credit. The total soil organic carbon and biomass-carbon ranged from 118.15 ± 24.56 tCha−1 to 224.45 ± 24.13 tCha−1 in the 0–30 cm soil depth showing the right candidature of Bangladesh forest department for carbon credits in the international carbon market. The net MAI of biomass-carbon ranging from 3.21 ± 1.24 to 9.57 ± 1.01 tCha−1yr−1 also shows an excellent potential to offset the atmospheric carbon yearly in the forests. The study provides useful pieces of information to the carbon trading and development practitioners in Bangladesh. The findings prove the positive environmental impacts of afforestation and conservation practices. The impacts of plantation and collaborative conservations might be prioritized based on the cost-benefit analysis under the policies of A/R CDM and REDD+ program.
Disclosure statement
No potential conflict of interest was reported by the authors.
Additional information
Funding
References
- Brown, S. (1997). Estimating biomass and biomass change of tropical forests: A primer. Food & Agriculture Organization.
- Brown, S., Sathaye, J., Cannel, M., & Kauppi, P. (1996). Management of forests for mitigation of greenhouse gas emissions. In R. T. Watson, M. C. Zinyowera, & R. H. Moss (Eds.), Climate change 1995: Impacts, adaptations, and mitigation of climate change: Scientific-technical analyses (pp. 773–797). Cambridge University Press.
- Camacho, L. D., Gevaña, D. T., Carandang, A. P., Camacho, S. C., Combalicer, E. A., Rebugio, L. L., & Youn, Y.-C. (2011). Tree biomass and carbon stock of a community‐managed mangrove forest in Bohol, Philippines. Forest Science and Technology, 7(4), 161–167. https://doi.org/https://doi.org/10.1080/21580103.2011.621377
- Canadell, J. G., & Raupach, M. R. (2008). Managing forests for climate change mitigation. Science, 320(5882), 1456–1457. https://doi.org/https://doi.org/10.1126/science.1155458
- Cannell, M. G. R. (2003). Carbon sequestration and biomass energy offset: Theoretical, potential and achievable capacities globally, in Europe and the UK. Biomass and Bioenergy, 24(2), 97–116. https://doi.org/https://doi.org/10.1016/S0961-9534(02)00103-4
- Chowdhury, M., Hossain, S., & Koike, M. (2010). An overview on the protected area system for forest conservation in Bangladesh. Journal of Forestry Research, 21(1), 111–118. https://doi.org/https://doi.org/10.1007/s11676-010-0019-x
- Chowdhury, M. S. H., Koike, M., & Muhammed, N. (2009). Embracing collaborative protected area management for conservation: An analysis of the development of the forest policy of Bangladesh. International For Review, 11(3), 359–374. https://doi.org/https://doi.org/10.1505/ifor.11.3.359
- Deb, J. C., Phinn, S., Butt, N., & McAlpine, C. A. (2017). Climatic-Induced shifts in the distribution of teak (Tectona grandis) in tropical Asia: Implications for forest management and planning. Environmental Management, 60(3), 422–435. https://doi.org/https://doi.org/10.1007/s00267-017-0884-6
- ESSD. (1998). Greenhouse gas assessment handbook- a practical guidance document for the assessment of project-level greenhouse gas emissions. The World Bank.
- FAO. (2001). State of the world’s forests 2001. Food & Agriculture Organization.
- Frouz, J., Pizl, V., Cienciala, E., & Kalcik, J. (2009). Carbon storage in post mining forest soils, the role of tree biomass and soil bioturbation. Biogeochemistry, 94(2), 111–121. https://doi.org/https://doi.org/10.1007/s10533-009-9313-0
- Gafur, A., Karim, A., & Khan, M. A. A. (1979). Phytosociological studies of hills of the Chittagong university campus. Chittagong University Study Part II Science, 3, 11–14.
- Gibbs, H., & Brown, S. (2007). Geographical distribution of biomass carbon in tropical Southeast Asian forests: An updated database for 2000. University of Illinois.
- Hamburg, S. P. (2000). Simple rules for measuring changes in ecosystem carbon in forestry-offset projects. Mitigation and Adaptation Strategies for Global Change, 5(1), 25–37. https://doi.org/https://doi.org/10.1023/A:1009692114618
- Hansen, E. M., Christensen, B. T., Jensen, L. S., & Kristensen, K. (2004). Carbon sequestration in soil beneath long-term Miscanthus plantations as determined by 13C abundance. Biomass and Bioenergy, 26(2), 97–105. https://doi.org/https://doi.org/10.1016/S0961-9534(03)00102-8
- Haripriya, G. S. (2000). Estimates of biomass in Indian forests. Biomass and Bioenergy, 19(4), 245–258. https://doi.org/https://doi.org/10.1016/S0961-9534(00)00040-4
- Hossain, M. A., Hossain, M. K., Alam, M. S., & Abdullah Al Mamun, M. M. (2017). Structural composition and distribution of tree species of dudhpukuria-dhopachori wildlife sanctuary, Chittagong, Bangladesh. Journal of Biodiversity Conservation and Bioresource Management, 3(1), 17–30. https://doi.org/https://doi.org/10.3329/jbcbm.v3i1.36757.
- Hossain, M. K. (2015). Protected area management plan for hazarikhil wildlife sanctuary and baraiyadhala national park: 2015 – 2025. Bangladesh: Forest Department.
- Iftekhar, M. S., & Hoque, A. K. F. (2005). Causes of forest encroachment: An analysis of Bangladesh. Geojournal, 62(1), 95–106. https://doi.org/https://doi.org/10.1007/s10708-005-7917-z
- IPCC. (2003). Good practice guidance for land use, land-use change and forestry. Institute for Global Environmental Strategies (IGES).
- IPCC. (2006). Agriculture, forestry and other land use. Institute for Global Environmental Strategies (IGES).
- Islam, K. R., Kamaluddin, M., Bhuiyan, M. K., & Badruddin, A. (1999). Comparative performance of exotic and indigenous forest species for tropical semievergreen degraded forest land reforestation in Chittagong, Bangladesh. Land Degradation & Development, 10(3), 241–249. https://doi.org/https://doi.org/10.1002/(SICI)1099-145X(199905/06)10:3<241::AID-LDR335>3.0.CO;2-8
- Ismail, R. (1995). An economic evaluation of carbon emission and carbon sequestration for the forestry sector in Malaysia. Biomass & Bioenergy, 8(5), 281–292. https://doi.org/https://doi.org/10.1016/0961-9534(95)00022-4
- Kaonga, M. L., & Bayliss-Smith, T. P. (2009). Carbon pools in tree biomass and the soil in improved fallows in eastern Zambia. Agroforestry Systems, 76(1), 37–51. https://doi.org/https://doi.org/10.1007/s10457-008-9185-7
- Karjalainen, T. (1996). The carbon sequestration potential of unmanaged forest stands in Finland under changing climatic conditions. Biomass and Bioenergy, 10(5–6), 313–329. https://doi.org/https://doi.org/10.1016/0961-9534(95)00123-9
- Karl, T. R., & Trenberth, K. E. (2003). Modern global climate change. Science, 302(5651), 1719–1723. https://doi.org/https://doi.org/10.1126/science.1090228
- Khan, M. A. S. A., Uddin, M. B., Uddin, M. S., Chowdhury, M. S. H., & Mukul, S. A. (2007). Distribution and status of forests in the tropics: Bangladesh perspective. Proceedings-Pakistan Academy of Sciences, 44(2), 145.
- Kirilenko, A. P., & Sedjo, R. A. (2007). Climate change impacts on forestry. Proceedings of the National Academy of Sciences, 104(50), 19697–19702. https://doi.org/https://doi.org/10.1073/pnas.0701424104
- Kongsager, R., Napier, J., & Mertz, O. (2013). The carbon sequestration potential of tree crop plantations. Mitigation and Adaptation Strategies for Global Change, 18(8), 1197–1213. https://doi.org/https://doi.org/10.1007/s11027-012-9417-z
- Lal, M., & Singh, R. (2000). Carbon sequestration potential of Indian forests. Environmental Monitoring and Assessment, 60(3), 315–327. https://doi.org/https://doi.org/10.1023/A:1006139418804
- Lasco, R. D., & Cardinoza, M. M. (2007). Baseline carbon stocks assessment and projection of future carbon benefits of a carbon sequestration project in East Timor. Mitigation and Adaptation Strategies for Global Change, 2(2), 243–257. https://doi.org/https://doi.org/10.1007/s11027-005-9011-8
- Lederer, M. (2011). From CDM to REDD+ what do we know for setting up effective and legitimate carbon governance? Ecological Economics, 70(11), 1900–1907. https://doi.org/https://doi.org/10.1016/j.ecolecon.2011.02.003
- McLeod, S. (1973). Studies on wet oxidation procedures for the determination of organic carbon in soils. Notes on Soil Techniques, 73–79. CSIRO Division of Soils.
- Miah, M. D., Rahman, M. M., & Haque, S. M. S. (2001). Carbon assimilation in three-year old mixed plantations in Chittagong region of Bangladesh. The Chittagong University Journal of Science, 25(1), 11–16.
- Osman, K. T., Islam, M. S., & Haque, S. M. S. (1992). Performance of some fast growing trees in the university of Chittagong campus. Indian Forester, 118(11), 858–859.
- Pearson, T., Walker, S., & Brown, S. (2013). Sourcebook for land use, land-use change and forestry project. Winrock International.
- Petersen, L. (1996). Soil analytical methods. Soil Resource Development Institute, Danida.
- Kim Phat, N., W. Knorr, & Kim, S. (2004). Appropriate measures for conservation of terrestrial carbon stocks: Analysis of trends of forest management in Southeast Asia. Forest Ecology and Management, 191(1), 283–299. https://doi.org/https://doi.org/10.1016/j.foreco.2003.12.019
- Pugh, T. A. M., Lindeskog, M., Smith, B., Poulter, B., Arneth, A., Haverd, V., & Calle, L. (2019). Role of forest regrowth in global carbon sink dynamics. Proceedings of the National Academy of Sciences, 116(10), 4382–4387. https://doi.org/https://doi.org/10.1073/pnas.1810512116
- Pussinen, A., Karjalainen, T., Kellomaki, S., & Makipaa, R. (1997). Potential contribution of the forest sector to carbon sequestration in Finland. Biomass and Bioenergy, 13(6), 377–387. https://doi.org/https://doi.org/10.1016/S0961-9534(97)10048-4
- Rahman, M. A. (2015). Field study (floral survey) in hazarikhil wildlife sanctuary and baraiyadhala national park. (26 April – 25 June, 2015). Forest Department, Bangladesh.
- Rahman, M. S., Miah, S., & Giessen, L. (2018). A new model of development coalition building: USAID achieving legitimate access and dominant information in Bangladesh’s forest policy. World Development, 105, 248–261. https://doi.org/https://doi.org/10.1016/j.worlddev.2017.12.029
- Ravindranath, N. H., & Somashekhar, B. S. (1995). Potential and economics of forestry options for carbon sequestration in India. Biomass and Bioenergy, 8(5), 323–336. https://doi.org/https://doi.org/10.1016/0961-9534(95)00025-9
- Reddy, C. S., Vazeed Pasha, S., Jha, C. S., Diwakar, P. G., & Dadhwal, V. K. (2016). Development of national database on long-term deforestation (1930–2014) in Bangladesh. Global and Planetary Change, 139, 173–182. https://doi.org/https://doi.org/10.1016/j.gloplacha.2016.02.003
- Rolim, S. G., Jesus, R. M., Nascimento, H. E. M., Do Couto, H. T. Z., & Chambers, J. Q. (2005). Biomass change in an Atlantic tropical moist forest: The ENSO effect in permanent sample plots over a 22-year period. Oecologia, 142(2), 238–246. https://doi.org/https://doi.org/10.1007/s00442-004-1717-x
- Salam, M. A., Noguchi, T., & Koike, M. (1999). The causes of forest cover loss in the hill forests in Bangladesh. Geojournal, 47(4), 539–549. https://doi.org/https://doi.org/10.1023/A:1006947203052
- Salam, M. A., & Noguchi, T. (1998). Factors influencing the loss of forest cover in Bangladesh: An analysis from socioeconomic and demographic perspectives. Journal of Forest Research, 3(3), 145–150. https://doi.org/https://doi.org/10.1007/bf02762135
- Savaresi, A. (2012). The role of REDD+ in the harmonisation of overlapping international obligations. In: Hollo E., Kulovesi K., Mehling M. (eds) Climate Change and the Law. pp. 391-418. Ius Gentium: Comparative Perspectives on Law and Justice, vol 21. Springer, Dordrecht.
- Schoenholtz, S. H., Van Miegroet, H., & Burger, J. A. (2000). A review of chemical and physical properties as indicators of forest soil quality: Challenges and opportunities. Forest Ecology and Management, 138(1), 335–356. https://doi.org/https://doi.org/10.1016/S0378-1127(00)00423-0
- Sharma, B. P., Shyamsundar, P., Nepal, M., Pattanayak, S., & Karky, B. S. (2015). Can carbon be sequestered in community forest? Learning how to fulfill a global agenda through local institutions in Nepal. In R. Bellamy (Ed.), Policy brief (pp. 2). South Asian Network for Development and Environmental Economics (SANDEE).
- Shin, M. Y., Miah, M. D., & Lee, K. H. (2007). Potential contribution of the forestry sector in Bangladesh to carbon sequestration. Journal of Environmental Management, 82(2), 260–276. https://doi.org/https://doi.org/10.1016/j.jenvman.2005.12.025
- Shrestha, B. M., & Singh, B. R. (2008). Soil and vegetation carbon pools in a mountainous watershed of Nepal. Nutrient Cycling in Agroecosystems, 81(2), 179–191. https://doi.org/https://doi.org/10.1007/s10705-007-9148-9
- USAID. (2018). Hazarikhil wildlife sanctuary: Sustaining nature, biodiversity, and local communities.
- Walkley, A., & Black, J. A. (1934). An examination of the degtjareff method for determination of soil organic matter and a proposed modification of the chromic acid titration method. Soil Science, 37(1), 29–38. https://doi.org/https://doi.org/10.1097/00010694-193401000-00003
- Whitehead, D. (2011). Forests as carbon sinks—benefits and consequences. Tree Physiology, 31(9), 893–902. https://doi.org/https://doi.org/10.1093/treephys/tpr063
- Xiao, Y., An, K., Xie, G., Lu, C., & Zhang, B. (2011). Carbon sequestration in forest vegetation of Beijing at sublot level. Chinese Geographical Science, 21(3), 279–289. https://doi.org/https://doi.org/10.1007/s11769-011-0469-x