
 ?Mathematical formulae have been encoded as MathML and are displayed in this HTML version using MathJax in order to improve their display. Uncheck the box to turn MathJax off. This feature requires Javascript. Click on a formula to zoom.
ABSTRACT
Confluences are often attributed by abrupt change in the load transport and encompass significant regional differences. Tributary watersheds of the Chotonagpur plateau fringe fans are widely reported to be the source of premier sediment yields causing amplification of sediment load in the trunk river. In this direction this article scrutinizes the role of tributaries on sediment transport at 11 confluence locations along 86.4 km stretched river Bakreshwar. The work revolves around two fundamental questions- How do tributaries contribute sediment load to the main river respective to their catchment size, length, runoff and sediment yield volume? and how do tributaries' interaction with the trunk stream influence the longitudinal continuum of sediment load in the receiving river? The study affirms that the junctions represent locations of abrupt change in the longitudinal gradient of sediment load. Size and length of the tributaries relative to the main stream have explicit controls on the post-confluence change in sediment load. Tributary watershed sediment yield is the foremost factor for amplifications of sediment load and morphological complexities at and downstream of the junctions. This work is a preliminary attempt and can hopefully stimulate ideas for fruitful and coherent scientific inquiry on river confluences particularly for Indian circumstances.
1. Introduction
Within the fluvial networks, confluences are that critical nodes where two or more channels having independent flow and sediment regimes converge in a single channel downstream (Mosley, Citation1976). During the 1950s and 1960s Leopold and his colleagues (Leopold & Maddock, Citation1953; Leopold et al., Citation1964) theorized that a river from its headwaters to the mouth exhibits a continuous gradient of channel form variables and concave longitudinal profile in response to the downstream increase in discharge of water and sediment. According to Vannote et al. (Citation1980), this continuous gradient in physical conditions along the river should result in a continuum of ecology along the river (River Continuum Concept, RCC). McManus (Citation1985) revealed that in a relatively stable stream the volume of sediment flux generally maintains a balanced condition. However, the physical structures of the main stream are not “smooth monotonic function of distance downstream” (Ferguson et al., Citation2006) but exhibit step changes wherever significant tributaries join a channel (Rhoads, Citation1987; Richards, Citation1980) and many physical scientists (e.g., Montgomery, Citation1999) have challenged the “linear perspective” of riverine ecosystems (Benda et al., Citation2004a; Bruns et al., Citation1984). At the tributary junctions there are dramatic changes in discharge and sediment loads (Richards, Citation1980) that force adjustment to the interrelated channel form variables (Leopold et al., Citation1964). Actually at the confluences of a river, tributary influx of water and sediment bring out sudden change/adjustment in the hydro-sedimentological condition of the recipient channel (Biron & Lane, Citation2008; Ferguson et al., Citation2006; Rhoads, Citation1987; Richards, Citation1980) leading to changes in physical conditions (Best, Citation1986; Miller, Citation1958). Therefore, there is a need to evaluate the confluences as discontinuous steps in the longitudinal continuum of the flow and sediment discharge regimes of a river.
The step changes in the physical gradient of a river at the confluences reflect dynamic interaction between tributary and main stream’s water and sediment. As the tributaries have their typical catchment character and their get-together with the main stream lead to the change in the sediment load and consequent hydro-morphological change of the receiving river downstream. These changes have a causal link to the tributary catchment dimensions like – basin size and shape, length of the tributary, catchment runoff, sediment yield, drainage density and pattern, spatial distribution, local geometry and so on (Benda et al., Citation2004b). Remarks such as “streams are the manifestation of the landscapes that they drain” (Hynes, Citation1975); “A river is a report card for its watershed”; etc. affirm this causal link. Despite this ubiquity of catchment influence on water and sediment transport within the confluence hydrodynamic zone it is rather surprising that, only a handful of studies have paid consistent attention to this issue. Study of Mueller (Citation1972), Mesa and Mifflin (Citation1986), Robinson et al. (Citation1995), Benda et al. (Citation2004b), Macnab et al. (Citation2006), and Sklar et al. (Citation2006), Ghosh (Citation2016a, Citation2019a) are some of the important exceptions that have paid attention to the confluence hydro-sediment dynamics viewed from the tributary catchment context. Besides, study of Richards (Citation1980), Bruns et al. (Citation1984), Rhoads (Citation1987), Ward and Stanford (Citation1995), Montgomery (Citation1999), Ferguson et al. (Citation2006), Rice et al. (Citation2006), and Duncan et al. (Citation2009) have highlighted confluences as the point of discontinuity in the hydro-sediment continuum within a fluvial network. Apart from these, study of Best (Citation1985, Citation1986, Citation1987, Citation1988), Biron et al. (Citation1993), Boyer et al. (Citation2006), Ghobadian and Bejestan (Citation2007), Szupiany et al. (Citation2009), Ribeiro et al. (Citation2012), Martin-Vide et al. (Citation2015), and Nazari-Giglou et al. (Citation2016) are also important in this regard to explore the nature of hydro-sediment dynamics and related issues and explanations at the confluence hydro-dynamic zone. Works on the related ground is very few in Indian circumstances.
Small to medium watersheds (10–100 km2 area) of the Chotonagpur plateau fringe fans (eastern counterpart), breed a large amount of runoff during June and September (Ghosh et al., Citation2015). The high intensity seasonally skewed rainfall during the monsoon (Ghosh, Citation2018) is primarily responsible for the sharp increase in seasonal discharge of the rivers (contributing as much as 90% to the annual discharge) unlike other rivers of the gangetic flood plain (Bandyopadhyay et al., Citation2014). Moreover, the undulating lateritic terrain conditions helps to generates some of the premier sediment yields of Eastern India which added to the main river from the tributaries. Such area-specific high sediment yields are primarily due to erosion propensity of the secondary laterite formation in this counterpart (Chakraborty, Citation1970; Jha & Kapat, Citation2003). Subsoil sediments produced by gully incision in Lateric patches of this region provide most of the sediment load to the headwater sub-catchments (Ghosh & Bhattacharya, Citation2012) and supply it to the main stream. For example, the river bed of the lower-middle and lower Bakreshwar River is being aggrading (Ghosh, Citation2015; Ghosh, Citation2016c) owing to the high rates of sediment supply particularly from the tributaries. Such high rates of sediment influx from the tributaries have both on-site effects as well as off-site impacts. Therefore, a comprehensive account concerning addition of sediment from the tributaries, sediment load dynamics of the main river at the confluence hydrodynamic zone and its causal link with the catchment scales river network functions is needful for scaling-up our insight so as to understand the regional spirit.
In view of the above, the present paper concentrates on a few tributary junction sites along 86.4 Km. stretched river Bakreshwar having western extension to the Chotonagpur plateau fringe and eastern extension towards the Gangetic flood plain of eastern India. The work revolves around two fundamental research questions – (1) How do tributaries its interaction with main stream influence the longitudinal gradient in sediment discharge of the main river within riverine settings? and (2) How do tributaries contribute sediment load of the main river respective to their physical settings namely catchment size, basin order, main stream length, catchment runoff, and sediment yield volume?
2. Location and regional settings of the study area
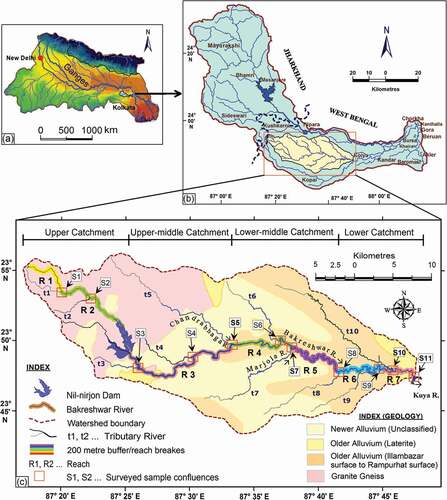
Bakreshwar River is a fifth order tributary of the river Kopai (Kuya) and a part of Mayurakshi river system of eastern India. The catchment area (about 714.56 km2) is a part of lateritic Rarh plain region enclosed between 23°43′23.28″ N. to 23°56′31.16″ N. latitudes and 87°17′1.59” E. to 87°47′16.07″ E. longitudes and lies in between the River Mayurakshi in the North and Kuya in the South. The entire catchment area of the river Bakreshwar entertains 3 fourth order, 13 third order, 54 second order, and 318 first order streams to drain. Total length of the river is 86.36 km of which about 13.87 km is perennial. On considerations of relief (mean elevation is 194.47 m; relative relief is of 142 m [source] to 24 m [confluence]; Average slope [as per Wentworth’s method Wentworth, Citation1930] is 3–5% in the upper catchment whereas <1% in the lower segment), the catchment area can be alienated into five physiographic zones – (i) Plateau-plain transition (142–100 m); (ii). Pedimental plain (100–80 m); (iii) Pedimental break through (80–60 m); (iv) Older alluvium plain (60–40 m); and (v) Newer alluvium plain (40–24 m).
The region bears the imprints of Late Pleistocene ferruginous formations with the remnants of tropical deciduous forest. Hard massive Basalt of Jurassic to Cretaceous age, soft and medium hard laterites of Cenozoic age and China Clay of Late Pleistocene to Early Eocene age are also found in different parts of the basin in different depths where deep percolation is negligible (Saha, Citation1961). Spatially, 35% of the basin area in the upper catchment is composed with granitic gneissic rock of Pleistocene age (50 lakh years old) overlain by coarse grain lateritic soil; 27% and 38% area at the middle and lower catchment respectively are made up with older and newer alluvium of Holocene period over granitic basement (). The catchment area covers mostly with the reddish, loose and friable sterile soil with ferruginous concretion called laterite soil (local name “kankara”). Due to strong infertility of land it is named as “Rarh” or “sterile land” (O’Malley, Citation1914). This secondary laterite formation (Chakraborty, Citation1970) is primarily due to the deposition by the small tributaries coming from Chotonagpur Plateau (Jha & Kapat, Citation2003, Citation2009). The soil catenas consist of plateau fringe and high plain with Laterite Soil (Ultisols), adjacent slopes with sandy and loamy soils and small valley floors with older alluvial soils (Ulfisols). No important lineaments are there but few locally confined aquifer structures are found in this region. The thickness of alluvium (ranges from 12–20 m) increases towards the eastern part of the catchment and groundwater yield potentialities of the aquifers also increases eastward with a rate about 5–15 m3/h (Ray & Shekhar, Citation2009). The water table is moderately deep (5–10 mbgl) with moderate to high seasonal fluctuation (Mukherjee et al., Citation2007). Flood incidence is common particularly in the lower catchment during peak monsoon period. Discharge from Nilnirjon dam and additional influx of water through canals from other river systems encourage flood incidences (Ghosh, Citation2015) and bank erosion (Ghosh et al., Citation2016; K.G. Ghosh, Citation2016c) particularly in the lower part of the river basin.
Figure 1. Reference map of the study area showing (a) Ganga river catchment, (b) Mayurakshi river basin and (c) Bakreshwar river basin.
Agricultural land use (>53%) dominates the region. Permanent forest cover lies exclusively in the lateritic upper catchment area constitutes only about 16% of the basin area and is decaying both qualitatively and quantitatively at a very fast rate. Moderate-maximum chemical weathering, moderate physical weathering, moderate mass wasting, moderate-maximum fluvial processes (sheet wash, rain splash, rill and gully erosion), laterisation, etc. are some major pedo-geomorphic processes. Rolling lateritic uplands, wide planation surface, deep red weathering zone, duricrust of Feoxides (Ferrucrete), badlands in the upper part and low lying flat land in the lower part of the basin characterize the morphological features. The region experiences sub-humid and sub-tropical monsoon type climate with alternative wet and dry period where rainfall (varies with the elevation between 925 and 2178 mm during 1901–2017) shows declining trend and the drought condition is reported to be intensified (Ghosh, Citation2018, Citation2019b). Average potential evaporation of this area from 1901 to 2015 is 73.45 mm/year. Presence of laterite indicates the former existence of tropical wet dry periods (Tertiary). During South-West Monsoon (June to September) advective rainfall yields more than 80% out of the total annual average rainfall (1383.84 mm) and all the rivers (tributary and main) receive copious amounts of rainfall during these months and thereby intensify the problem of soil erosion. It is found that, typical heavy monsoon rainfall intensity of around 23.51 mm/h (WBPCB: West Bengal Pollution Control Board, Citation2009) and median drop diameter of almost 2.2 mm with terminal velocity of about 6 m/s (Hudson, Citation1965) in this area enhancing rainfall erosivity (Ghosh, Citation2016b). In the dry period the western highlands experience excessive dry condition causing physical weathering. Average estimated soil loss of this basin area is about 7 tons/ha/year (Ghosh et al., Citation2015). During the monsoonal months particularly in the undulating western extreme heavy runoff (runoff coefficient in monsoon is as high as 0.705) (Ghosh et al., Citation2015) is the prime cause for adding the eroded sediment to the drainage networks. Owing to these high rates of sediment supply the river bed of the lower-middle and lower Bakreshwar river is aggrading (Ghosh, Citation2015). Hence, attention should be given upon tributary contribution of sediment load to the main river Bakreshwar and associated causal effects.
3. Materials and methods
The present study dealt with the fifth order Bakreshwar river (Area: 714.56 sq. km.; Length: 86.4 km.) and its major tributaries () located in the eastern India. The catchment area is primarily a part of the farthest eastern extension of the Chotonagpur Plateau in the West and Moribund Delta in the East and often referred to Rarh Bengal (Bagchi & Mukerjee, Citation1983; Biswas, Citation1987). The whole study is based on 2 fundamental data types (): Channel dimensions related data which is collected from field survey and the catchment dimensions related data which is secondary in nature and mostly calculated in GIS environment. In order to scale-up our understanding of the catchment level fluvial dimensions, important characters of the tributary catchments ( and ) are examined scientifically.
Figure 2. Location of sample Tributary river and their respective catchments in the Bakreshwar river basin.
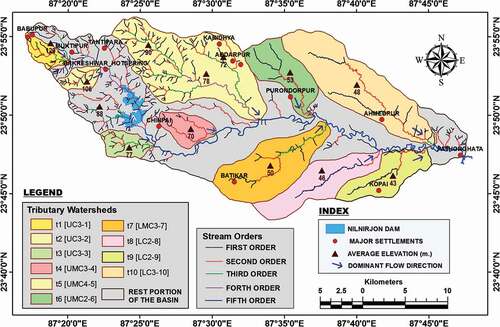
Table 1. Data types and their respective sources
Table 2. Basic characteristics of the tributaries and their respective catchments
Data pertaining to primarily the discharge and sediment transport within the confluence hydrodynamic zone is obtained from subsequent field survey () at regular interval conducted during 2011–2017 under both steady flow conditions in the monsoon (June–September) and dying flow condition during post-monsoon period (October–January) at 11 tributary junctions as indicated in .
Figure 3. Measurement and sampling by the field crews at different confluence segments of the river Bakreshwar during 2011–2017.
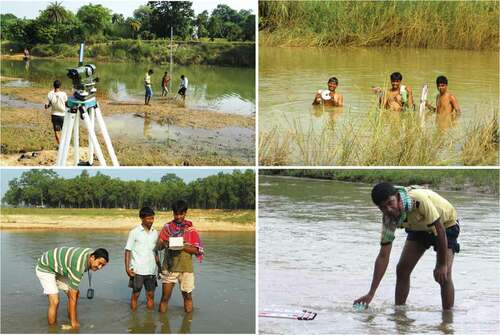
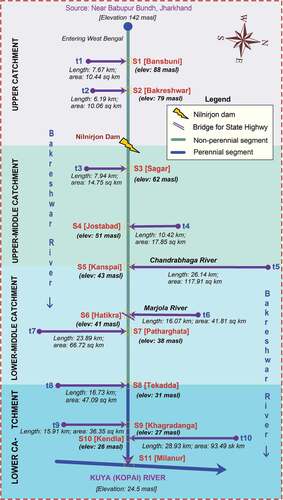
Figure 4. Flow line diagram of the river Bakreshwar and its tributary river system.
3.1. Summarizing the catchment dimensions related data mining methods
Systematic laboratory analyses have been done for each tributary river basin based on SOI Toposheets of the SOI; DPMS map of the NATMO, Geological map of the GSI, SRTM DEM, etc. () wherever necessary. For all the 11 sample tributary watersheds (), the drainage area of the tributary basin and the corresponding drainage area of the main river (i.e., drainage area is used as a surrogate for water discharge) etc. are measured carefully in GIS environment. Main stream drainage areas are measured immediately upstream of the intersecting tributary. Similarly lengths of the tributaries are compared to that of the main river up to the confluence tip.
The other catchment scale variables that are supposed to influence the sediment transport within the confluence hydrodynamic zone are soil erosion and runoff. The Revised Universal Soil Loss Equation, RSULE (Renard et al., Citation1997, Citation1991) and SCS-CN (NEH-4, Citation1954; USDA, Citation1972) methods are used to show the spatial pattern of soil loss and runoff, respectively. The rational method (Goyal, Citation2016, p. 132) and Garde and Kothyari’s equation (Garde & Kothyari, Citation1987) are followed for the calculation of Catchment yield (i.e., runoff) and the volume of sediment yield for the respective tributary catchments and the main river catchment area up to the confluence junctions, respectively.
Catchment yield (runoff) is obtained by assuming a suitable runoff co-efficient.
where C – runoff coefficient A – area of the catchment (in sq. m), P – Precipitation (in m.).
The values of runoff coefficients – C fluctuate depending upon the soil type, vegetation, geology, etc. As the present catchment area is primarily a rural tract (Pal, Citation2016) therefore a uniform C value of 0.4 have taken for the calculation (vide Stephenson, Citation1981, pp. 39; Goyal, Citation2016, p. 132).
Amount of sediment yield is estimated using Garde and Kothyari (Citation1987) equation:
3.2. Mean annual sediment yield/Volume of eroded material (mm3/year)
where A is catchment area (km2), H is catchment slope, Dd is drainage density, P is annual mean precipitation (mm) and Fc is erosion factor (vegetative cover factor). Again FA is the area of arable land in the catchment, FG is the area occupied by grass and scrub, FF is the forested area while Fw is the area of waste land.
The basic characteristics of the tributaries and their respective catchments are forwarded in the following table ().
(Mueller, Citation1968) Where, VL – Valley length and AL – Air length
(Strahler, Citation1957) Where, Bifurcation ratio, Rb = Nu/(Nu+1) and Nu is the Number of stream segment of a given order. Nu+1 is that of the next higher order.
(Strahler, Citation1952) where, Ls – Proportion of uneroded part; Lus – Proportion of eroded part
(Dov, Citation1957)
(Smith, Citation1935)
(Wentworth, Citation1930) Where, N – number of contour cuttings per miles or km, I – contour interval, 636.6 – constant.
3.3. Summarizing the channel dimensions related data collection methods
To have a better insight into the flow and sediment influx at the tributary junctions focus has been given on the stream reach meaning thereby segment of a river with fairly uniform size and shape, water surface slope, channel materials and flow characteristics (Dingman, Citation2009). Apart from these, variables such as underlying geology, perenniality of the river segment, stream confinement (or valley width), stage of channel evolution, dominant channel materials, major human intervention, etc. are (Harmar & Clifford, Citation2007; Montgomery & Buffington, Citation1997; NEH, Citation1988; Paz & Collischonn, Citation2007; Rosgen, Citation1998) considered for reach identification. The entire river stretch from source to outlet is divided into seven total reaches () and the flow line diagram of the river Bakreshwar and its tributaries are shown in . Ten major tributaries are identified with their corresponding 10 junctions with the main river Bakreshwar. At least one sample tributary junction () from each reach is preferred for study. Three cross-sections from each sample confluence segment (two on main river: pre and post-confluence and one on the tributary river) have taken and their corresponding hydraulic (flow), sediment transport and morphological (form) attributes occurring in the confluences are also being investigated. Additionally, we have decided to investigate the confluence segment of the river Bakreshwar with the main river Kuya (up to the confluence tip area: 509.75 sq. km. and length: 110.09 km). Altogether, 7 reaches, 11 confluence segments, and 33 cross-sections are investigated.
Table 3. Sample confluence segments in different reaches along river Bakreshwar and description of major hydro-morphological variables
Rigorous field survey has been carried out with the help of four local field personnel to unveil the changes in the sediment load character at each confluence hydrodynamic zone. As stated earlier cross sections across the river are taken at the immediate upstream and downstream of the confluence points during the post-monsoon period. The sediment influxes at the confluences are measured for both under steady flow conditions in the monsoon (during June–September) and dying flow conditions during post-monsoon (October–January).
From each confluence hydrodynamic zone two water samples (one from upstream, one from downstream of the confluence junction) of handful amount (1 L sample) are taken in each time of surveying (during September 2011 and September 2017) and sediment load concentration (Both suspended i.e., fine sediments that are transported in suspension and dissolved i.e., sediments that are carried in solution) excluding bed load are computed in laboratory setup following standard manual. In this case, precise weight of the collected samples, using a digital weighing machine are measured and compared with that of the equal volume of fresh water. Thereby, mean sediment concentration and standard deviation of the samples are calculated. The velocity (v) is measured in the field using Digital Current Meter. Volumetric flow rates or Discharges (Q, in m3/s) are calculated using formula, Q = A(Cross section area)*v(Velocity). For calculation of suspended sediment discharge the following formula (Gray & Simoes, Citation2008) is used:
where, Qs – Suspended sediment discharge in metric tones; Qw – Water discharge in m3/s; Cs – Mean concentration of suspended sediment in the cross-section in mg/L; K – a coefficient based on the unit of measurement of water discharge which is 0.0864 when discharge is in m3/s.
After combining the water and sediment discharges data collected form subsequent field survey for each tributary junction the power function model of the form Yc = aX b that relates the sediment concentrations to water discharge is estimated. The equation is-
where, QL – Suspended sediment discharge in (mg/L), Qw – Stream discharge in (m3/s), a and b are the coefficients that provide the best relationship between discharge and the sediment load. In this case, a and b are accepted as constant throughout the calculations. After log-transformation to the arithmetic domain and application of the Ferguson (Citation1986) correction factor, the sediment load occurring at a specific discharge is estimated using the following expression:
where, Cf is the log-transformation bias correction factor-
where, exp is the exponential function and s is the standard error of the regression Equationequation[4]
[4] .
4. Results and discussion
4.1. Catchment scale characteristics of the sample tributaries
From and ) it is quite evident that, only in three cases the drainage area of the tributary river is >60% of the drainage area of the main river. The first is at the S1 (Bansbuni) when the river Bakreshwar is receiving the first significant tributary, second is at the S5 (Kanspai) where tributary Chandrabhaga (areal share is maximum in compare to other tributary catchments) and third is at location S11 (Milonpur) where the river Bakreshwar itself became tributary of the master river Kuya. It is interesting to note that the drainage area of the tributary Bakreshwar (714.56 km) is more than that of the river Kuya (Kopai) up to the confluence tip (509.75 sq km) at S11. In case of the relative drainage length ()) the picture remains almost the same for other sample tributary junctions except S11 (Milonpur). At this confluence location (S11) the length of the main river Kuya (110.09 km) is more than that of the tributary river Bakreshwar (86.36 km) although the catchment area of the river Kuya is less than its tributary Bakreshwar.
Figure 5. Relation between the (a) cumulative drainage area or (b) length of the river Bakreshwar up to different tributary confluences and their respective ratios (%) involving the tributaries and the master river for different confluences.
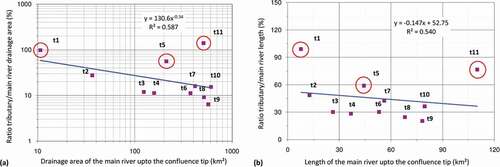
Table 4. Relative status of the tributary and main stream drainage area and length up to the junction point
From the analysis of the drainage areas and length of the tributaries in compare to that of the main river up to the confluence location, it can be seen that the size of the tributary basins and length of the tributaries in compared to that of the main river at up to the confluence nodes decreases downstream, as illustrated in ). This behaviour indicates that downstream tributary river influence on channel hydrolo-sedimentological modification of the main river decreases downstream.
On the basis of previous studies (Rhoads, Citation1987; Roy & Woldenberg, Citation1986) it is postulated that sediment transport within the confluence hydrodynamic zone of main stem channels depends on the size of the tributary relative to the size of the main stream. For instance, larger basins typically produce larger quantities of sediment, so that larger tributaries generally create larger fans (Bull, Citation1964; May & Gresswell, Citation2003). In addition, the length of the tributary channel is supposed to be associated with increase of sediment load and energy downstream that would affect the ability to transport tributary inputs of sediment downstream of the confluences. Since main stream channels increase in size, length and energy downstream, increasingly larger tributaries should also be required to create significant change of the hydro-sedimentological panorama of the main river.
Another two forces that are thought to have significant impact in the confluence hydro-dynamic zone are runoff volume and sediment yield volume of the tributary basins (). The relative contribution of the runoff volume and sediment yield volume for tributary and main river drainage areas up to the confluence tip are shown in the ), respectively.
Figure 6. Relative contribution of the (a) runoff volume (Calculated based on the rational method) and (b) sediment yield volume (calculated based on Garde & Kothyari, Citation1987) for tributary and main river drainage area up to the confluence tip.
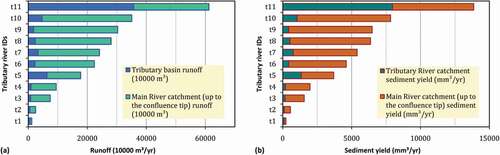
Table 5. Relative status of the tributary and main stream runoff and soil erosion volume
The spatial patterns of runoff and soil erosion as well as relative strength of runoff and sediment yield volume for tributaries and main river catchment areas up to the confluence tip are shown in the .
Figure 7. Annual surface runoff status of the whole watershed (calculated based on SCS-CN method), relative strength of the runoff volume (Calculated based on the rational method) for tributaries and main river catchment areas up to the confluence tip and % increase of velocity and discharge in the post confluence segments.
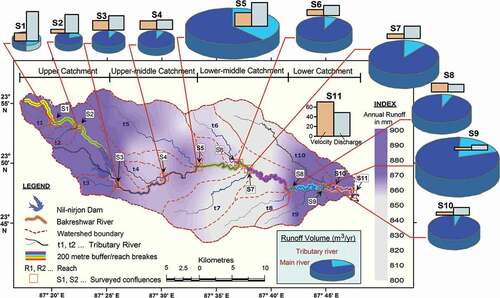
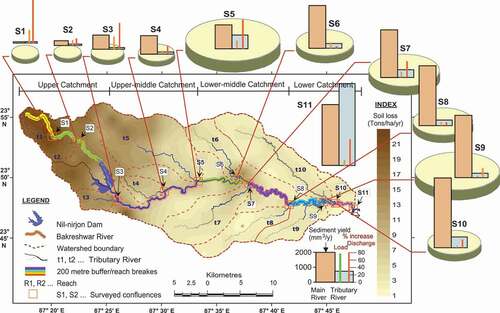
Figure 8. Soil erosion status of the whole watershed (based on RUSLE method) shown through Choropleth map; Sub-basin scale relative strength of sediment yield volume (calculated based on Garde & Kothyari, Citation1987) for tributary and main river catchment area upstream from confluence tip shown in bar and % increase of sediment load and sediment discharge in the post confluence segments.
Two interesting factors to note down both in case of the runoff volume and sediment yield
First: the upper and upper middle catchment tributaries contribute greater share of runoff and sediment yield than that of their areal/length share and the circumstances get reversed in case of the lower and lower middle catchment. It means the tributaries located in the lower middle and lower catchments, particularly the sediment yield volume is relatively less than their areal contribution. This signifies that from upstream to downstream the possibility of addition of water and sediment to the main river from the tributary river respective to their size and length slow down.
Second: The left hand side tributary river and its catchment constitutes relatively more areal share (59%); length share (51%) as well as runoff volume (60%) and sediment yield (58%) (). This signifies that the probability of the addition of water and sediment will be more in case of the left hand side tributaries than that of the right hand side tributaries.
Table 6. Relative area, length, runoff and sediment yielding volume from tributaries located either side of the main river (left hand side and right hand side)
4.2. Nature of Channel flow character and sediment load transport at the confluence hydrodynamic zone
4.2.1. Downstream pattern of channel flow condition: Pre-post confluence dynamism
Calculation or methods of data obtaining have been described earlier. % increase in channel hydraulic parameters have been obtained by calculating the net change in post-confluence segment (simple subtraction of post-pre confluence condition) and thereby converted the change into % in respect of the pre-tributary condition. Simply (pre-post channel values)/pre-confluence condition×100
The field results () show that the velocity is higher in the immediate downstream of the confluence in comparison to the immediate upstream in all the cases (ranges between 02% and 68% increase). The increase of velocity and discharge is maximum in the Kopai-Bakreshwar confluence followed by Chandrabhaga-Bakreshwar confluence and minimum in Khagradanga where an almost dry channel eventually meets the river Bakreshwar (). However, it is interesting to note that, the increase of discharge (ranges between 10.95% and 58.65%) is relatively more to that of the increase in velocity (ranges between 02% and 68% increases) in most of the sample locations (except Milonpur and Tekadda) along the main channel in post-confluence conditions. This anomaly may be due to 15.78% to 23.39% increase in sediment concentration and cross sectional area as well as hydraulic radius after the confluence point. The eventual increase of velocity in comparison to the discharge in Kopai-Bakreshwar confluence and Tekadda may be attributed to the additional supply of water from river Kuya and irrigation canal network (Ghosh, Citation2015), respectively.
Figure 9. Downstream pattern of average surface water velocity (2011–2017) deviation in pre and post-confluence segments.
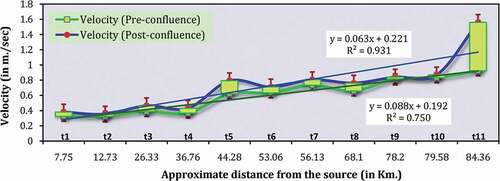
Figure 10. Downstream pattern of mean discharge (2011–2017) deviation in pre- and post-confluence segments.
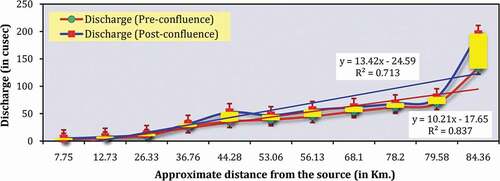
Table 7. Channel hydrological panorama at the tributary-mainstream confluence segments and post confluence change of channel flow condition (velocity and discharge)
4.2.2. Downstream pattern of sediment load and sediment discharge: Pre-post confluence dynamism
Due to successive addition of eroded material from several non point sources, sediment concentration generally increases downstream. However, discontinuities in the fining of sediments are often observed at tributary junctions (Rice, Citation1998). Moreover, due to the anthropogenic restriction in form of dam (e.g., Nilnirjon dam in present case) and bridge culvert (e.g., Hatikra Bridge in present case), some amount of sediment settles down and thereby lowers the load. In some cases large boulders in the bed and minimum slope of the bed eventually helps to settle down the sediment load (). On an average sediment load grossly increases downstream and the tributary confluences show some anomalous change in the sediment load character. This also leads to a sudden change in channel bed morphology.
Figure 11. Sediment load (suspended and dissolved) and Sediment discharge pattern in the pre-confluence and post-confluence segments of different sample sites from source to mouth of the river Bakreshwar.
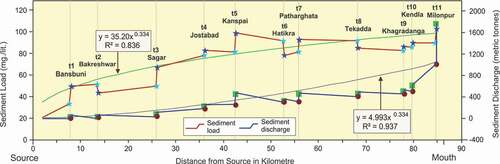
Figure 12. Downstream pattern of sediment load (2011–2016) deviation in pre and post-confluence segments.
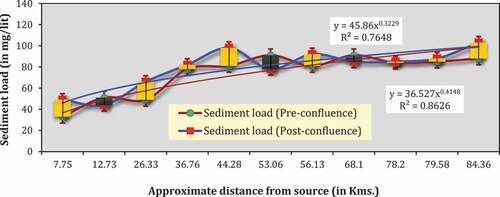
Figure 13. Downstream pattern of sediment discharge (2011–2016) deviation in pre and post-confluence segments.
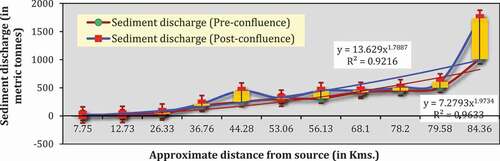
Figure 14. Cross-section at Bakreshwar (Tantipara) [about 13.2 km downstream of the source] across the river Bakreshwar.
![Figure 14. Cross-section at Bakreshwar (Tantipara) [about 13.2 km downstream of the source] across the river Bakreshwar.](/cms/asset/a257401e-fedd-4214-ba88-b7908b4ae21d/tgel_a_1752501_f0014_oc.jpg)
The results () indicate that all the tributaries have their influence in increasing the suspended sediment discharge of the main river by −14% to 48%. Besides, the mean grain size of bed load varies from fine sand to medium sand in each upstream and downstream of tributary junctions, respectively.
Table 8. Channel sedimentological panorama at the tributary-mainstream confluence segments and post confluence change in sediment concentration and discharge
From and it is quite evident that the sediment concentration and sediment discharge of the river Bakreshwar has changed abruptly at most of the tributary junctions. The standard deviation of the sediment load for individual locations at the downstream of the confluence is much higher than that of the upstream. This affirms that tributaries have their impact to break the longitudinal rhythm of the hydro-morphological panorama of the main river. Another two points should be noted: One: where percentage increase of water discharge is high the % increase of sediment load is quite low; Two: in all the cases % increase of sediment discharge is more than the % increase of sediment load.
4.2.3. Downstream pattern of sediment load: some locations with irregularities
There are few confluence zones in the present case where the nature of change in the sediment concentration has shown some abnormality. Out of the 11 sample confluence segment three of such location deserves worth mentioning:
First: In most of the cases velocity is found significantly higher in the immediate downstream of the confluence in comparison to the immediate upstream ( and ) and the percentage increase in velocity ranges from 2.8% (Khagradanga, S9) to 68.6% (Milonpur, S11). However, the insignificant increase in velocity (8.6% increase) and substantial amount of decrease in sediment load (−13.7%) at Bakreshwar (S2) may be attributed to the dissected channel pattern () as a result of positioning of exposed hard rock (Granite and Quartz type) at different alignment in the river bed which virtually helps to settled down the sediment load.
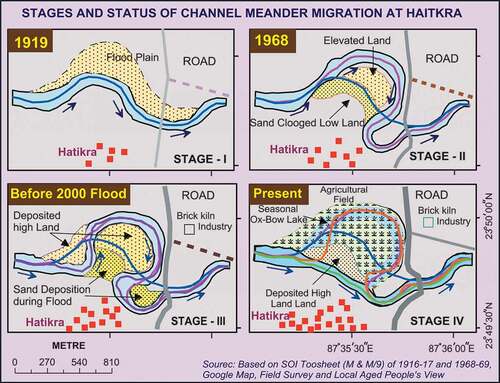
Second: In Hatikra (S6) both the sediment concentration (−14.3% decrease) and suspended sediment discharge (+3.3% increase) is abnormally low in the post confluence section then that of the velocity (+11.9% increase) as well as water discharge (+20.6% increase). The field records show that there is an elevated bridge culvert for the Bolpur-Suri State Highway (SH) which has exerted considerable impact on the free flow of water and some amount of sediments settled down. The nearby brick kiln industry has also caused destruction of riparian areas, sand excavation and associated channel course shifting () which eventually helps to increase the sediment concentration in the pre-confluence section.
Figure 15. Stages and status of channel migration in Hatikra.
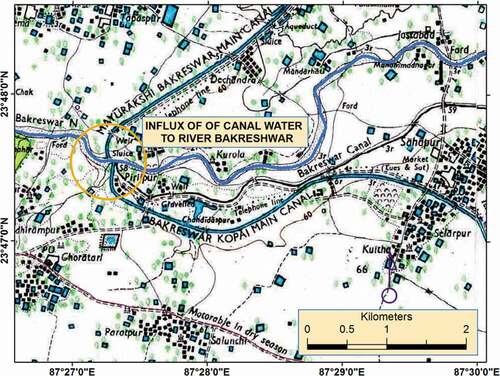
Third: In Tekadda () velocity and water discharge increases to about 15%. However, in comparison to that sediment load counts an abnormal decrease (−6.6%). This is because of the fact that, substantial amount of relatively freshwater is added to this point (S8) through the tributary via Kopai-Bakreshwar irrigation canal network (Ghosh, Citation2015).
Figure 16. Convergence of canal water from Mayurakshi and Kopai river system to Bakreshwar river system.
4.2.4. Downstream trend of sediment concentration: break in the longitudinal continuum
From and it is evident that the sediment load is gradually increasing downstream. Active liquefaction process has made the water more turbid downstream. There is wide variation in the sediment concentration up and downstream of the Nilnirjon Dam. The average sediment load during mid-monsoon at the upstream sites of the dam is 2.27 mg/L. But, it is 3.501 mg/L at the downstream sites. At the upstream up about 5–7 Km. due to the arrest of water sediment concentration is quite more. In Kanspai (S5) and Milonpur (Kuya) (S11) sediment concentration is high due to mixing of water from tributary river Chandrabhaga and Bakreshwar, respectively. At Tekadda (S8) influx of water from Mayurakshi Canal has raised the sediment concentration slightly.
In downstream trends of sediment loads and sediment discharges are synchronized with the theoretical trend.
Table 9. Downstream trend of sediment load
4.3. Influence of catchment scale characteristics of the sample tributaries on reach scale flow character at the confluences
Quantitative statistical relation diagram () may help to determine the role of tributaries, particularly their relative area, length, runoff, and sediment yield volume to the increase/decrease of the sediment load and sediment discharge in the immediate downstream of the confluence segments.
Figure 17. Relationship between the ratio (%) of tributary and main stream drainage area and increase/decrease in (a) sediment load (suspended and dissolved) and (b) sediment discharge in immediate downstream of the confluence segments.
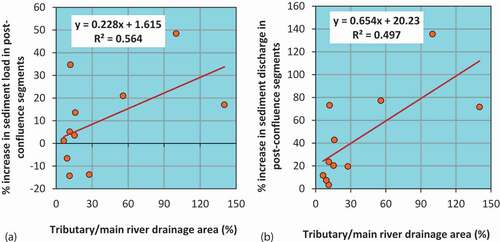
Figure 18. Relationship between the ratio (%) of tributary and main river length and increase/decrease in (a) sediment load (suspended and dissolved) and (b) sediment discharge in immediate downstream of the confluence segments.
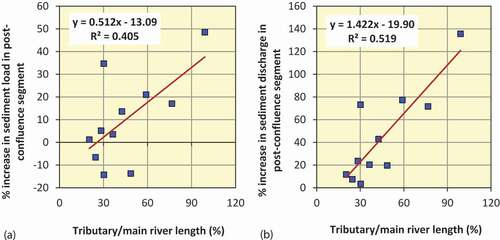
Figure 19. Relationship between the tributary river runoff volume/main river runoff volume (%) to that of the post confluence increase (%) in (a) sediment load (suspended and dissolved) and (b) sediment discharge.
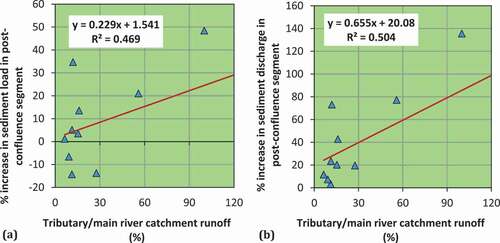
Figure 20. Relationship between the tributary river basin sediment yield volume/main river basin sediment yield volume (%) to that of the post confluence increase (%) in (a) sediment load (suspended and dissolved) and (b) sediment discharge.
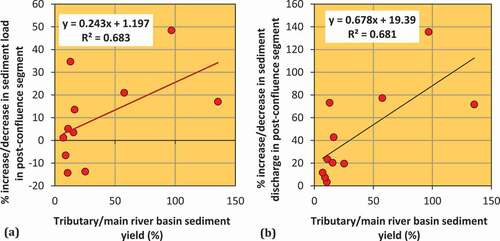
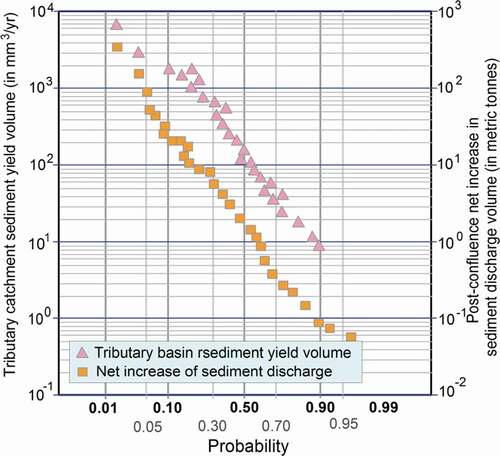
Figure 21. Plotting of tributary watershed estimated sediment yield volume and net increase of sediment discharge in post confluence segment against the Probability [p = r/(n + 1), where r is rank order and n is the total number of events of exceedance.
Marginal positive relation between the tributary river length relative to main stream length up to the confluence tip and sediment load/sediment discharge ()) signifies that greater the length of the tributary higher the amount of sediment load it receives from different non-point sources.
Tributary river runoff volume relative to the main river runoff volume up to the confluence tip positively and significantly controls the sediment load and sediment discharge ()).
The control of tributary basin sediment yield volume () relative to the main river catchment sediment yield volume is found to be the most influential factor (R2 = 0.683 and 0.681) to regulate post-confluence increase in sediment load and sediment discharge.
The linear regression relationship between the tributary drainage area relative to the main stream drainage area up to the confluence tip (in %) and percentage increase in sediment load and sediment discharge in the post confluence segments () shows that the greater the drainage area of the tributary more the possibility of increase sediment load and sediment discharge.
In comparison to the immediate upstream sediment load and discharge to that of the confluence downstream sediment load and discharge there is reasonable differences. The net difference and percentage change in the confluence downstream in compare to the upstream have a good relation with the catchment size, its location, length of the tributary, individual catchment runoff, and sediment yield. However, their functional relations are more prominent in case of the sediment discharge than that of the sediment loading. Their statistical relations are forwarded in the following correlation matrix .
Table 10. Correlation matrix between drainage area, length, runoff volume and channel sediment loads and sediment discharges
4.4. Some other points of concern
Combining all the discharges measured along the main river in pre and post confluence segments during the entire field visit and thereby calculating the sediment discharge of the river in pre- and post-confluence segments and by this means plotting () with the tributary catchment sediment yield volume in respect of their annual expedience probability it is found that, tributary catchment sediment yield volume has a significant good relation with the net increase of sediment discharges in the post confluence segments. Therefore, the underlying fact behind () the tributary catchment sediment yield volume to become the most influential factor to regulate the increase of sediment discharge at the post confluence segments are needed to be explored.
Table 11. Rainfall erosivity measurement based on the records of peak monsoonal month rainfall event during 1980–2013 at Sriniketan Meteorological Station
Light textured lateritic soils of this region having shallow depths are very prone to erosion in case of high intensity rainfall under the undulating terrain conditions. It has been reported that, typical heavy monsoon rainfall intensity is around 23.51 mm/h in this area (Water Resource and its Quality in West Bengal, A State of Environmental Report, WBPCB, Citation2009) and median drop diameter of monsoon rainfall is almost 2.2 mm with terminal velocity of almost 6 m/s (Hudson, Citation1965).
The frequency distribution of different intensity ranges of erosive events show an increasing trend as the number of short durated heavy rainfall events has increased, particularly from the mid-1990s. As soils of the region are shallow and lands are undulating, of considerable concern is that so much surface erosion propensity at the catchment scale and sediment transfer through the tributary can be affected by so small a quantity of water, typically, 6–8 mm. This is an intense landscape response to weather events that reflects the sensitivity and fragility of the sub-tropical plateau fringe environment. Given the degree of erodibility and the efficiency of sediment transfer, hydrologists need to take heed that impounded water resources are at risk from high rates of sediment generation in this region.
5. Conclusion and future research prospects
At a river confluence, an abrupt meeting of two channels each having independent flow and sediment discharge regimes creates unique hydro-sediment and morphological conditions. In the present study, based on field data obtained from 11 confluence locations along 5 order of magnitude river Bakreshwar with the catchment area of about 714.56 sq. km located over the Chotonagpur plateau fringe fans of eastern India there has been an attempts to explore the sediment load dynamicity of those critical nodes with the objectives to anticipate the effect of tributaries to create discontinuities in the longitudinal rhythm of sediment load as a function of spatial scale tributary catchment personality. The analysis of 11 confluence junctions from the 86.4 km stretched river Bakreshwar, constituting 7 channel reaches and 33 cross-sections in total, show that the tributary junctions represent areas of point specific change in the longitudinal gradient of sediment load. The study affirms that the tributaries have played a decisive role to locally alter the main stem sediment load respective with their catchment size relative to the main stem. Tributary attributes such as size and length, relative to the main stream up to the confluence tip found to have specific controls on the post-confluence change in sediment load. Tributary catchment sediment yield and runoff volume is found to be the most influential factor to regulate sediment transport within the confluence hydrodynamic zone. However there are several other vectors in addition to those discussed in this article that could control confluence effects as well. All of these vectors undoubtedly contribute to the variation exhibited in the data.
Assessment of the role of catchment scale character of the tributary river on post confluence change in sediment concentration is thought to be the keystones for scaling-up our understanding of riverine processes to the drainage network scale. The analytical tools and approaches described in this article constitute a preliminary attempt towards understanding the said link using empirical data sets. Several other issues are yet to be explored. For instance, recent modelling work on sediment routing at tributary junctions illustrates that longitudinal discontinuities in physical and biological diversity can be predicted at network scales (Ferguson et al., Citation2006; Rice et al., Citation2006). Such predictive models can be tested against empirical patterns revealed in this work. Moreover, spatial analysis of river networks is currently a major focus of environmental monitoring and assessment at local and regional scales and can provide useful tools for understanding and modelling tributary impacts in a network context (Peterson & Urban, Citation2006; Theobald et al., Citation2006; Ver Hoef et al., Citation2006). Additionally some other issues like changes in hydrological and morphological condition at the confluences are yet to be explored. The author is working in this aspect and will be reported in the subsequent study. The step-like changes in discharge and sediment load as outlined in the present piece of writing may be accompanied by discontinuities in longitudinal profile (Hanks & Webb, Citation2006; Rice & Church, Citation2001), changes in planform style (e.g., Galay et al., Citation1998; Mosley & Schumm, Citation2001; Russell, Citation1954), the growth of tributary fans (e.g., May & Gresswell, Citation2004), shifts in fish and insect community composition (e.g., Fernandes et al., Citation2004; Kiffney et al., Citation2006; Rice et al., Citation2001) and other geomorphological and ecological impacts (Ferguson & Hoey, Citation2008; Rice et al., Citation2008) are also needed to be examined for this particular geographical region. Present analysis of the effects of spatial scale tributary catchment character could also be applied to other riverine landscapes of the Gangetic floodplain to unveil the true regional character.
Furthermore, viewing confluences as the discontinuous steps in the longitudinal continuum of flow and sediment discharge regimes of a river and critical nodes of complex hydraulics, routing of water, sediments, pollutants as well as ecology have apparent implications for the management and restoration of rivers. For instance, sediment fluxes what Rice and Church (Citation1998) called “sedimentary links” from tributaries which become particularly dramatic during significant flooding episodes causes abrupt change of the main-channel form (river bed aggradation/degradation, bank erosion, etc.) and therefore has obvious implications for the assessment of bank erosion and channel stability above and below significant tributary junctions. These main stream river problems are possible to manage by the careful manipulation of tributary characteristics. Moreover, identification and mapping of geomorphically significant confluences based on relative strength of the tributaries and significant flow-related changes could contribute to identify probable ecological “hot spots” by identifying particularly vulnerable aquatic resources which in turn could guide for restoration efforts. The work reported here is thus will hopefully bring forward valuable knowledge base and stimulating ideas for fruitful and coherent future work on river confluences particularly in Indian circumstances and thence future efforts could be directed for management and restoration of the confluences.
Acknowledgments
An earlier version of this article has been presented at the 30th National Conference of ‘The Indian Institute of Geomorphologists (IGI)’ on ‘Geomorphology, Environment and Society’, held at the Department of Geography, Jamia Millia Islamia, New Delhi, India during October 2018 and the author likes to express his sincere thanks to Prof Sutapa Mukhopadhyay of the Visva-Bharati University and Dr Swades Pal of the University of Gour Banga, West Bengal, India for their reasonable suggestion during initial draft of the manuscript. In addition, the author is also thankful to all the dedicated field crews, especially Dr Abhishek Bhattacharya of Kalna BEd. College; Dr Surojit Let of Hetampur College; Dr Priyanka Das of Wada Women’s College; Dr Sunil Saha of the University of Gour Banga and Dr Kaustuv Mukherjee of Chandidas Mahavidyalaya who spent long hours walking kilometres to collect the data that were necessary to develop the ideas, concepts and analyses in this article. Thanks should also go to the local field personnel, for their fair and priceless field assistance. Lastly my heartfelt thanks go to the anonymous reviewers for their constructive comments and suggestions to improve the manuscript.
Disclosure statement
No potential conflict of interest was reported by the author.
References
- Bagchi, K., & Mukerjee, K. N. (1983). Diagnostic survey of West Bengal(s) (pp. 17–19, 42–58). Department of Geography, Calcutta University.
- Bandyopadhyay, S., Kar, N. S., Das, S., & Sen, J. (2014). River systems and water resources of West Bengal: A review. Geological Society of India Special Publications, 3, 63–84. https://doi.org/https://doi.org/10.17491/cgsi%2F2014%2F62893
- Benda, L., Andras, K., Miller, D., & Bigelow, P. (2004b). Confluence effects in rivers: Interactions of basin scale, network geometry, and disturbance regimes. Water Resources Research, 40(5), W05402. https://doi.org/https://doi.org/10.1029/2003WR002583
- Benda, L., Poff, L., Miller, D., Dunne, T., Reeves, G., Pess, G., & Pollock, M. (2004a). The network dynamics hypothesis: How channel networks structure riverine habitats. BioScience, 54(5), 413–427. https://doi.org/https://doi.org/10.1641/0006-3568(2004)054[0413:TNDHHC]2.0.CO;2
- Best, J. L. (1985). Flow dynamics and sediment transport at river channel confluence. Ph.D. dissertation, Birbeck College, University of London pp. 393.
- Best, J. L. (1986). The morphology of river channel confluences. Progress in Physical Geography: Earth Earth and Environment, 10(2), 157–174. https://doi.org/https://doi.org/10.1177/030913338601000201
- Best, J. L. (1987). Flow dynamics at river channel confluences: Implications for sediment transport and bed morphology. In F. G. Ethridge, R. M. Flores, & M. D. Harvey (Eds.), Recent developments in fluvial sedimentology. Special publication (Vol. 39, pp. 27–35). Society of Economic Palaeontologists and Mineralogists.
- Best, J. L. (1988). Sediment transport and bed morphology at river channel confluences. Sedimentology, 35(3), 481–498. https://doi.org/https://doi.org/10.1111/j.1365-3091.1988.tb00999.x
- Biron, P., Roy, A. G., Best, J. L., & Boyer, C. J. (1993). Bed morphology and sedimentology at the confluence of unequal depth channels. Geomorphology, 8(2–3), 115–129. https://doi.org/https://doi.org/10.1016/0169-555X(93)90032-W
- Biron, P. M., & Lane, S. N. (2008). Modelling hydraulics and sediment transport at river confluences. In S. P. Rice, A. G. Roy, & B. L. Rhoads (Eds.), River confluences, tributaries and the fluvial network (pp. 17–43). John Wiley & Sons, Ltd.
- Biswas, A. (1987). Laterites and lateritoids of Rarh Bengal. In V. S. Datye (Ed.), Explorations in the tropics (pp. 48–54). Prof. K.D. Dikshit felicitation volume committee.
- Boyer, C., Roy, A. G., & Best, J. L. (2006). Dynamics of a river channel confluence with discordant beds: Flow turbulence, bed load sediment transport, and bed morphology. Journal of Geophysical Research, 111(F4), 1–22. https://doi.org/https://doi.org/10.1029/2005JF000458
- Bruns, D. A., Minshall, G. W., Cushing, C. E., Cummins, K. W., Brock, J. T., & Vannote, R. C. (1984). Tributaries as modifiers of the river continuum concept: Analysis by polar ordination and regression models. Archiv Fur Hydrobiologie, 99(2), 208–220.
- Bull, W. B. (1964). Geomorphology of segmented alluvial fans in western Fresno County, California. Geological Survey Professional Paper, 352–E. https://pdfs.semanticscholar.org/89c8/065a1450f5f0d1356f9a65b32a4ba907eff9.pdf
- Chakraborty, S. C. (1970). Some consideration on the evolution of physiography of Bengal (pp. 16–290). Geographical Institute, Presidency College.
- Das, P. (2014). Hydro–geomorphic characteristics of Kuya River Basin in Eastern India and their impact on agriculture and settlement (Unpublished Doctoral Dissertation). Visva–Bharati University.
- Dingman, S. L. (2009). Fluvial hydraulics. Oxford University Press Inc.
- Dov, N. (1957). The ratio of relative and absolute altitudes of Mt. Carmel: A contribution to the problem of relief analysis and relief classification. Geographical Review (Journal of American Geographical Society), 47(4), 564–569. https://doi.org/https://doi.org/10.2307/211866
- Duncan, W. W., Poole, G. C., & Meyer, J. L. (2009). Large channel confluences influence geomorphic heterogeneity of a southeastern United States river. Water Resources Research, 45(10), W10405. https://doi.org/https://doi.org/10.1029/2008WR007454
- Ferguson, R., & Hoey, T. (2008). Effects of tributaries on main-channel geomorphology. In S. P. Rice, A. G. Roy, & B. L. Rhoads (Eds.), River confluences, tributaries, and the fluvial network (pp. 183–206). John Wiley & Sons Ltd.
- Ferguson, R. I. (1986). Hydraulics and hydraulic geometry. Progress in Physical Geography, 10(1), 1–31. https://doi.org/https://doi.org/10.1177/030913338601000101
- Ferguson, R. I., Cudden, J. R., Hoey, T. B., & Rice, S. P. (2006). River system discontinuities due to lateral inputs: Generic styles and controls. Earth Surface Processes and Landforms, 31(9), 1149–1166. https://doi.org/https://doi.org/10.1002/esp.1309
- Fernandes, C. C., Podos, J., & Lundberg, J. G. (2004). Amazonian ecology: Tributaries enhance the diversity of electric fishes. Science, 305(5692), 1960–1962. https://doi.org/https://doi.org/10.1126/science.1101240
- Fournier, F. (1960). Climat et érosion. La relation entre l’érosiondu sol par l’eau et les précipitations atmosphériques [Relationship between soil erosion by water and rainfall]. Presses Universitaires de France. (In French.).
- Galay, V. J., Rood, K. M., & Miller, S. (1998). Human interference with braided gravel-bed rivers. In P. C. Klingeman, R. L. Beschta, P. D. Komar, & J. B. Bradley (Eds.), Gravel bed rivers in the environment (pp. 471–506). Water Resources Publications.
- Garde, R. J., & Kothyari, U. C. (1987). Sediment yield estimation. Journal of Irrigation and Drainage Engineering, 44(3), 97–123.
- Ghobadian, R., & Bejestan, M. S. (2007). Investigation of sediment patterns at river confluence. Journal of Applied Science, 7(10), 1372–1380. https://doi.org/https://doi.org/10.3923/jas.2007.1372.1380
- Ghosh, K. G. (2015). Hydro–geomorphological appraisal of Bakreshwar river basin, eastern India (Unpublished Doctoral dissertation). Visva–Bharati University.
- Ghosh, K. G. (2016a). Spatial heterogeneity of catchment morphology and channel responses: A study on Bakreshwar River Basin, Eastern India. Journal of Indian Geomorphology, 4, 47–64. http://indiageomorph.org/uploads/pdf/JoIG-v4-(2016)-p047-064_Ghosh—Catchment-morphology-and-channel-responses-of-Bakreshwar-basin.pdf
- Ghosh, K. G. (2016b). Long range climatic variability over Birbhum District, West Bengal and their Impact on rainfed aman crop in the context of climate change: Adoption and mitigation. In P. K. Chattopadhyay & D. S. Kushwaha (Eds.), Rural health, women empowerment and agriculture: Issues and challenges (1st ed., pp. 277–298). New Delhi Publishers.
- Ghosh, K. G. (2016c). Channel stability assessment of Bakreshwar River, Eastern India. In M. Mukhopadhyay, U. S. Malik, & M. Sutapa (Eds.), Man-nature interface. (1st ed., pp. 147–168). Sopan Publisher.
- Ghosh, K. G. (2018). Analysis of rainfall trends and its spatial patterns during the last century over the Gangetic West Bengal, Eastern India. Journal of Geovisualization and Spatial Analysis, 2(2), 15. https://doi.org/https://doi.org/10.1007/s41651-018-0022-x
- Ghosh, K. G. (2019a). Flow dynamics at channel confluences: Few observations from a sub-tropical plateau fringe river of Eastern India. Arab. J. Geosci, 12(14), 425. https://doi.org/https://doi.org/10.1007/s12517-019-4576-9
- Ghosh, K. G. (2019b). 2019b Spatial and temporal appraisal of drought jeopardy over the Gangetic West Bengal, eastern India. Geoenvironmental Disasters, 6(1), 1. https://doi.org/https://doi.org/10.1186/s40677-018-0117-1
- Ghosh, K. G., Mukhopadhyay, S., & Pal, S. (2015). Surface runoff and soil erosion dynamics: A case study on Bakreshwar river basin, eastern India. International Research Journal of Earth Sciences, 3(7), 11–22. www.isca.in/EARTH_SCI/Archive/v3/i7/2.ISCA-IRJES-2015-032.pdf
- Ghosh, K. G., Pal, S., & Mukhopadhyay, S. (2016). Validation of BANCS model for assessing stream bank erosion hazard potential (SBEHP) in Bakreshwar River of Rarh region, Eastern India. Modeling Earth Systems and Environment, 2(2), 95. https://doi.org/https://doi.org/10.1007/s40808-016-0172-0
- Ghosh, S., & Bhattacharya, K. (2012). Multivariate erosion risk assessment of lateritic badlands of Birbhum (West Bengal, India): A case study. Journal of Earth System Science, 121(6), 1441–1454. https://doi.org/https://doi.org/10.1007/s12040-012-0243-1
- Goyal, M. K. (2016). Engineering Hydrology. Prentice–Hall Pvt. Ltd.
- Gray, J. R., & Simoes, F. J. M. 2008. Estimating sediment discharge, in sedimentation engineering. In Ed. M. H. Garcia, American society of civil engineering manuals and reports on engineering practice, Reston, Va., 1067–1088. Accessed 25 September 2011. https://water.usgs.gov/osw/techniques/Gray_Simoes.pdf
- Hanks, T. C., & Webb, R. H. (2006). Effects of tributary debris on the longitudinal profile of the Colorado River in Grand Canyon. Journal of Geophysical Research-Earth Surface, 111(F2), F02020. https://doi.org/https://doi.org/10.1029/2004JF000257
- Harmar, O. P., & Clifford, N. J. (2007). Geomorphological explanation of the long profile of the lower Mississippi River. Geomorphology, 84(3–4), 222–240. https://doi.org/https://doi.org/10.1016/j.geomorph.2006.01.045
- Hudson, N. W. (1965). The influence of rainfall on the mechanics of soil erosion (MSc Thesis). University of Cape Town.
- Hynes, H. B. N. (1975). The stream and its valley. Internationale Vereinigung für theoretische und angewandte Limnologie Verhandlungen, 19(1), 1–15. https://doi.org/https://doi.org/10.1080/03680770.1974.11896033
- Jha, V. C., & Kapat, S. (2003). Gully erosion and its implications on land use, a case study. Land degradation and desertification (pp.). New Delhi Publ.
- Jha, V. C., & Kapat, S. (2009). Rill and gully erosion risk of lateritic terrain in South–Western Birbhum District, West Bengal, India. Sociedade & Natureza, 21(2), 141–158. https://doi.org/https://doi.org/10.1590/S1982-45132009000200010
- Kiffney, P. M., Greene, C., Hall, J., & Davies, J. (2006). Gradients in habitat heterogeneity, productivity, and diversity at tributary junctions. Canadian Journal of Fisheries and Aquatic Sciences, 63(11), 2518–2530. https://doi.org/https://doi.org/10.1139/f06-138
- Leopold, L. B., & Maddock, T. (1953). The hydraulic geometry of stream channels and some physiographic implications (United States Geological Survey Professional Paper 252). https://doi.org/https://doi.org/10.3133/pp252
- Leopold, L. B., Wolman, M. G., & Miller, J. P. (1964). Fluvial processes in geomorphology. Freeman and Co. San Francisco, California.
- Macnab, K., Jacobson, C., & Brierley, G. (2006). Spatial variability of controls on downstream patterns of sediment storage: A case study in the Lane Cove catchment, New South Wales, Australia. Geographical Research, 44(3), 255–271. https://doi.org/https://doi.org/10.1111/j.1745-5871.2006.00388.x
- Martin-Vide, J. P., Plana-Casado, A., Sambola, A., & Capape, S. (2015). Bedload transport in a river confluence. Geomorphology, 250, 15–28. https://doi.org/https://doi.org/10.1016/j.geomorph.2015.07.050
- May, C. L., & Gresswell, R. E. (2003). Processes and rates of sediment and wood accumulation in headwater streams of the Oregon Coast Range, USA. Earth Surface Processes and Landforms, 28(4), 409–424. https://doi.org/https://doi.org/10.1002/esp.450
- May, C. L., & Gresswell, R. E. (2004). Spatial and temporal patterns of debris-flow deposition in the Oregon Coast Range, USA. Geomorphology, 57(3–4), 135–149. https://doi.org/https://doi.org/10.1016/S0169-555X(03)00086-2
- McManus, J. (1985). Grain size determination and interpretation. In M. Tucker (Ed.), Techniques in sedimentology (pp. 63–85). Blackwell Scientific Publication.
- Mesa, O. J., & Mifflin, E. R. (1986). On the relative role of hillslope and network hydraulic geometry in hydrologic response. In V. K. Gupta, I. Rodriguez–Iturbe, & E. F. Wood (Eds.), Scale problems in hydrology (pp. 1–17). Springer.
- Miller, J. P. (1958). High mountain streams: Effects of geology on channel characteristics and bed material (Memoir 4, State Bureau of Mines and Mineral Resources). New Mexico Institute of Mines and Mining Technology.
- Montgomery, D. M. (1999). Process domains and the river continuum. Journal of the American Water Resources Association, 35(2), 397–410. https://doi.org/https://doi.org/10.1111/j.1752-1688.1999.tb03598.x
- Montgomery, D. R., & Buffington, J. M. (1997). Channel-reach morphology in mountain drainage basins. Geological Society of America Bulletin, 109(5), 596–611. https://doi.org/https://doi.org/10.1130/0016-7606(1997)109<0596:CRMIMD>2.3.CO;2
- Mosley, M. P. (1976). An experimental study of channel confluences. Journal of Geology, 84(5), 535–562. https://doi.org/https://doi.org/10.1086/628230
- Mosley, M. P., & Schumm, S. A. (2001). Gravel-bed rivers-the view from the hills. In M. P. Mosley (Ed.), Gravel bed rivers (pp. 479–505). New Zealand Hydrological Society.
- Mueller, J. E. (1968). An introduction to the hydraulic and topographic sinuosity indexes. Annals of the Association of American Geographers, 58(2), 371–385. https://doi.org/https://doi.org/10.1111/j.1467-8306.1968.tb00650.x
- Mueller, J. E. (1972). Re-evaluation of the relationship of master streams to drainage basins. Geological Society of America Bulletin, 83(11), 3471–3474. https://doi.org/https://doi.org/10.1130/0016-7606(1972)83[3471:ROTROM]2.0.CO;2
- Mukherjee, A., Fryar, A. E., & Howell, P. D. (2007). Regional hydrostratigraphy and groundwater flow modeling in the arsenic–affected areas of the western Bengal basin, West Bengal, India. Hydrogeology Journal, 15(7), 1397–1418. https://doi.org/https://doi.org/10.1007/s10040-007-0208-7
- Nazari-Giglou, A., Jabbari-Sahebari, A., Shakibaeinia, A., & Borghei, S. M. (2016). An experimental study of sediment transport in channel confluences. International Journal of Sediment Research, 31(1), 87–96. https://doi.org/https://doi.org/10.1016/j.ijsrc.2014.08.001
- NEH. (1988). National engineering handbook, US department of agriculture, natural resources conservation service, Part 630 hydrology, Chapter 6, stream reaches and hydrologic units. Retrieved August 12, 2012, from. http://www.hydrocad.net/neh/630ch6.pdf
- NEH-4. (1954). Hydrology guide for use in watershed planning (Soil Conservation Service). USDA.
- O’Malley, L. S. S. (1914). Rivers of Bengal (p. 116–121). Bengal District Gazetteers, Govt of West Bengal. [Reprint 1996].
- Pal, S. (2016). Identification of soil erosion vulnerable areas in Chandrabhaga River Basin: A multi-criteria decision approach. Modeling Earth Systems and Environment, 2(5), 1–11. https://doi.org/https://doi.org/10.1007/s40808-015-0052-z
- Paz, A. R., & Collischonn, W. (2007). River reach length and slope estimates for large-scale hydrological models based on a relatively high resolution digital elevation model. Journal of Hydrology, 343(3–4), 127–139. https://doi.org/https://doi.org/10.1016/j.jhydrol.2007.06.006
- Peterson, E., & Urban, D. L. (2006). Predicting water quality-impaired stream segments using landscape scale data and a regional geo-statistical model: A case study in Maryland. Environmental Monitoring and Assessment, 121(1–3), 613–636. https://doi.org/https://doi.org/10.1007/s10661-005-9163-8
- Ray, A., & Shekhar, S. (2009). Groundwater issues and development strategies in West Bengal. Bhu-Jal News, Quaterly Journal of Central Ground Water Board, 24(1), 1–17. http://cgwb.gov.in/documents/Bhujal_news_24_1.pdf
- Renard, K. G., Foster, G. R., Weesies, G. A., McCool, D. K., & Yoder, D. C. (1997). Predicting soil erosion by water-a guide to conservation planning with the Revised Universal Soil Loss Equation (RUSLE) (United States Department of Agriculture, Agricultural Research Service (USDA-ARS) Handbook No. 703). United States Government Printing Office.
- Renard, K. G., Foster, G. R., Weesies, G. A., & Porter, J. P. (1991). RUSLE: Revised universal soil loss equation. Journal of Soil and Water Conservation, 46(1), 30–33. https://www.tucson.ars.ag.gov/unit/publications/PDFfiles/775.pdf
- Rhoads, B. L. (1987). Changes in stream channel characteristics at tributary junctions. Physical Geography, 8(4), 346–361. https://doi.org/https://doi.org/10.1080/02723646.1987.10642333
- Ribeiro, L. M., Blanckaert, K., Roy, A. G., & Schleiss, A. J. (2012). Flow and sediment dynamics in channel confluences. Journal of Geophysical Research: Earth Surface, 117(f1), 1–19. https://doi.org/https://doi.org/10.1029/2011JF002171
- Rice, S. P. (1998). Which tributaries disrupt downstream fining along gravel-bed rivers? Geomorphology, 22(1), 39–56. https://doi.org/https://doi.org/10.1016/S0169-555X(97)00052-4
- Rice, S. P., & Church, M. (1998). Grain size along two gravel-bed rivers: Statistical variation, spatial pattern and sedimentary links. Earth Surface Processes and Landforms, 23(4), 345–363. https://doi.org/https://doi.org/10.1002/(SICI)1096-9837(199804)23:4<345::AID-ESP850>3.0.CO;2- B
- Rice, S. P., & Church, M. (2001). Longitudinal profiles in simple alluvial systems. Water Resources Research, 37(2), 417–426. https://doi.org/https://doi.org/10.1029/2000WR900266
- Rice, S. P., Ferguson, R. I., & Hoey, T. B. (2006). Tributary control of physical heterogeneity and biological diversity at river confluences. Canadian Journal of Fisheries and Aquatic Sciences, 63(11), 2553–2566. https://doi.org/https://doi.org/10.1139/f06-145
- Rice, S. P., Greenwood, M. T., & Joyce, C. B. (2001). Tributaries, sediment sources, and the longitudinal organization of macro-invertebrate fauna along river systems. Canadian Journal of Fisheries and Aquatic Sciences, 58(4), 824–840. https://doi.org/https://doi.org/10.1139/f01-022
- Rice, S. P., Kiffney, P., Greene, C., & Pess, G. R. (2008). The ecological importance of tributaries and confluences. In S. P. Rice, A. G. Roy, & B. L. Rhoads (Eds.), River confluences, tributaries, and the fluvial network (pp. 209–237). John Wiley & Sons Ltd.
- Richards, K. S. (1980). A note on changes in channel geometry at tributary junctions. Water Resources Research, 16(1), 241–244. https://doi.org/https://doi.org/10.1029/WR016i001p00241
- Robinson, J. S., Sivapalan, M., & Snell, J. D. (1995). On the relative roles of hillslope processes, channel routing, network geomorphology in the hydrologic response of natural catchments. Water Resources Research, 31(12), 3089–3101. https://doi.org/https://doi.org/10.1029/95WR01948
- Rosgen, D. L. (1998). The reference reach—a blueprint for natural channel design. ASCE conference, March 1998. Retrieved June 20, 2010, from. http://www.wildlandhydrology.com/assets/The_Reference_Reach_II.pdf
- Roy, A. G., & Woldenberg, M. J. (1986). A model for changes in channel form at a river confluence. Journal of Geology, 94(3), 402–411. https://doi.org/https://doi.org/10.1086/629038
- Russell, R. J. (1954). Alluvial morphology of Anatolian rivers. Annals of the Association of American Geographers, 44(4), 363–391. https://doi.org/https://doi.org/10.1080/00045605409352142
- Saha, A. K. (1961). Geology of Birbhum. In B. Roy (Ed.), District census (1961). handbook for Birbhum District, West Bengal (pp. 9–10). Govt. of India.
- Sklar, L. S., Dietrich, W. E., Foufoula-Georgiou, E., Lashermes, B., & Bellugi, D. (2006). Do gravel bed river size distributions record channel network structure? Water Resources Research, 42(6), W06D18. https://doi.org/https://doi.org/10.1029/2006WR005035
- Smith, G. H. (1935). Relative relief of Ohio. Geographical Review (Journal of American Geographical Society), 25(2), 272–284. https://doi.org/https://doi.org/10.2307/209602
- Stephenson, D. (1981). Storm water hydrology and drainage. Elsevier Scientific Publishing Company.
- Strahler, A. N. (1952). Hypsometric (Area-Altitude) analysis of erosional topography. Geological Society of America Bulletin, 63(11), 1117–1142. https://doi.org/https://doi.org/10.1130/0016-7606(1952)63[1117:HAAOET]2.0.CO;2
- Strahler, A. N. (1957). Quantitative analysis of watershed geomorphology. Transactions American Geophysical Union, 38(6), 913–920. https://doi.org/https://doi.org/10.1029/TR038i006p00913
- Szupiany, R. N., Amsler, M. L., Parsons, D. R., & Best, J. L. (2009). Morphology, flow structure, and suspended bed sediment transport at two large braid-bar confluences. Water Resources Research, 45(5), W05415. https://doi.org/https://doi.org/10.1029/2008WR007428
- Theobald, D. M., Norman, J. B., Peterson, E., Ferraz, S., Wade, A., & Sherburne, M. R. (2006). Functional linkage of water basins and streams (FLoWS): ArcGIS tools for network-based analysis of freshwater ecosystems, Version 1 (Natural Resource Ecology Lab). Colorado State University:.
- USDA. (1972). The soil conservation service curve number (SCS–CN) method, national engineering handbook. Hydrology Section 4. Chapters 4–10. United States Department of Agriculture.
- Vannote, R. L., Minshall, G. W., Cummins, K. W., Sedell, J. R., & Cushing, C. E. (1980). The River Continuum Concept. Canadian Journal of Fisheries and Aquatic Sciences, 37(1), 130–137. https://doi.org/https://doi.org/10.1139/f80-017
- Ver Hoef, J., Peterson, E., & Theobald, D. M. (2006). Spatial statistical models that use flow and stream distance. Environmental and Ecological Statistics, 13(4), 449–464. https://doi.org/https://doi.org/10.1007/s10651-006-0022-8
- Ward, J. V., & Stanford, J. A. (1995). The serial discontinuity concept: Extending the model to floodplain rivers. Regulated Rivers: Research & Management, 10(2–4), 159–168. https://doi.org/https://doi.org/10.1002/rrr.3450100211
- WBPCB: West Bengal Pollution Control Board (2009). A State of Environment Report: Water Resource and its Quality in West Bengal 352p. Govt. of West Bengal.
- Wentworth, C. K. (1930). A simplified method of determining the average slope of land surfaces. American Journal of Science, 20(117), 184–194. https://doi.org/https://doi.org/10.2475/ajs.s5-20.117.184