
ABSTRACT
This study is composed of assessment of air temperature, rainfall, available water reservoir, and runoff potential. The analysis of air temperature and rainfall (1996–2010) in the Xianning watershed, which was composed of Tongcheng, Chibi, and Jiayu small catchment areas was carried out and various extreme events (for example, floods in Yangtze river) were recorded. The climatic conditions of the watershed were evaluated over a period and the impacts of climatic change were investigated. Then, a forecasting model was developed for the future climatic changes (up to 2025) and the hydrological response due to these climatic changes in the study area was discussed. The results showed increasing temperature and decreasing rainfall, and that the changing climate mostly drifted during the 1990 s and onwards. It is foreseen that the natural extreme events have shifted with the seasons and there is an increase in the frequency and intensity of extreme. The future planning for water resources ought to consider the probable environmental change scenario, which entails an indulgence of both sensitivities to change and recent changeability over time.
1. Introduction
Climate changeability impacts are potential concerns nowadays and the climate system is varying faster than the natural patterns. Climate change impacts the environmental, ecological, and hydrological courses at global, regional, and local levels. These impacts can interrupt the structure and effectiveness of the ecosystem, increase natural disturbances, and change the distribution of water resources and vegetation patterns. Climate change has a substantial impact on the hydrological response that has then affected the available water resources (Zhang et al., Citation2011). The variation in precipitation, droughts, runoff, and evapotranspiration is because of climate change (Dai et al., Citation2018). The Intergovernmental Panel on Climate Change (IPCC) has studied that watersheds are badly affected because of the changing pattern of temperature and precipitation (Simonovic, Citation2017). In a watershed, the streamflow fluctuates non-linearly with changing in precipitation (Zhang et al., Citation2019).
In dry areas, an increase in temperature associated with an increase in evaporation and transpiration which can cause a big variation of runoff and streamflow, however in humid areas, any change in precipitation causes a large variation of streamflow (Wang et al., Citation2017). In recent decades, the significant impact of climate change on water resources and hydrology has attained great attention through several studies in many regions all around the world. Therefore, a hydrological response analysis is very important to evaluate the sensitivity of a watershed to climate change circumstances and to develop better water management structures and climate change adaption tactics. Lirong and Jianyun (Citation2012) investigated hydrological response to climate change in Beijiang River Basin and their results indicate that when precipitation keeps unchanging, temperature increase would increase average annual evaporation and potential evaporation and decrease water yield. Zaheer et al. (Citation2016) reported the hydrological alterations and precipitation assessment within the watershed and to investigate the watershed’s behavior and structural disturbance from various morphological parameters for example, runoff, stream density, bifurcation ration, and stream order.
Many research studies on precipitation changes were done at country or regional levels because of the climate changes at regional level (Brunetti et al., Citation2004; Khan & Zaheer, Citation2018; Thompson, Citation1999) and the analysis of long-term simulated precipitation data by climate models (Coppola & Giorgi, Citation2010; Gregory & Mitchell, Citation1995). Water resources will be improved in some regions of the world and on the other hand, will be degraded in some regions of the world. The ecological, environmental, and hydrological response is more sensitive to anthropogenic climate change than natural climate variability. The climate change variations indicated the decreased water balance components in the Heeia Watershed in Hawaii of the USA (Leta et al., Citation2016). The climate change significantly impacted the watershed runoff and hydrological processes in the Ipswich Watershed in Massachusetts of USA and adaptation strategies were recommended to ease climate effects and increase watershed’s resilience (Dudula & Randhir, Citation2016).
Ahmad et al. (Citation2016) investigated water resources management about environmental changes in the Himalayan watershed region. Xu et al. (Citation2019) reported that the climate change impacts involving temperature and precipitation disturbances at the watershed scale and indicated that streamflow changes and fluvial flood risk in a mixed-use watershed of Michigan of USA. PuPumo et al. (Citation2017) pointed out that climate change significantly affected the hydrological dynamics and processes in the Eldon River Basin in Oklahoma of the USA. Napoli et al. (Citation2017) presented the climate change played a significant role in hydrological dynamics and runoff changes in the Elsa River Basin in Italy there was an increase of freshwater resources under warmer temperatures and increased rainfalls because of the climate change impacts in the Athabasca River Basin in Alberta, Canada (Shrestha et al., Citation2017). The wetland’s hydrological dynamics and associated services of seasonal contribution, flood mitigation, and water storage were influenced by the climate change in two isolated wetlands and two riparian wetlands in the Becancour River Watershed in Quebec of Canada (Fossey & Rousseau, Citation2016b).
The impacts of climate change on the hydrological dynamics and relevant hydrological response of the watersheds were studied in China. Q. Zhu et al. (Citation2012) assessed climate change impacts on hydrological response and showed that the water resources would improve in northern China and decline in southern China under climate change scenarios). Y. Zhu et al. (Citation2016) evaluated the impacts of climate change on water resources and extreme flows using different models, scenarios, and simulations. Their results indicated that the reduction of water resources and the increase of extreme flood events due to increased rainfall in the Yellow River Basin in Northern China. Climate change showed a considerable impact on water availability leading to the reduction of water response in the North China Plain in Northern China (Mo et al., Citation2017).
Zhang et al. (Citation2017) found that the climate change was the considerable factor for runoff variability in the Haihe River Basin in Northern China and was much contributed to runoff changes as compared to other factors in the Yanhe River Basin in Northern China (Wu et al., Citation2017). The increased temperature and changes in precipitation pattern leading to an increasing trend of extreme events like floods and droughts in the Eastern Monsoon Region of China (Xia et al., Citation2017). Environmental change can adjust the risk of hydrological extremes at regional scales (Alodah & Seidou, Citation2019) even though developed basins with a dense population are highly vulnerable to hydrological extremes.
The rainfall variability due to climate change would lead to frequent and intense extreme events like floods and droughts. The rapid temperature increase would lead to the rapid melting of glaciers and influence the freshwater sources at large scale and would lead to flooding from glacial lakes in the upper reaches of the Yangtze River and lower volume of water in the Yangtze’s downstream areas. The main objective of this study was to evaluate the precipitation pattern and temperature variability by using Statistical Package (SPSS) and Minitab software to analyze the data and run the regression analyses to get the best-fitted results. The climatic conditions of the Xianning watershed in the Hubei province of China were evaluated over a period and the impacts of climatic change were investigated and a forecasting model was developed for the future climatic changes (up to 2025).
1.1. Study area
This study was conducted at Xianning in southeast Hubei province, China, covering about 1501 km2. Xianning is about 50 km away from the provincial capital of Wuhan. It is characterized by a typical subtropical warm and humid climate, with an annual mean temperature of 16.8 °C and a frost-free period of 254 days. The mean annual precipitation is about 1570 mm (1971–2002), and the rainfall concentrated between April and July accounts for about 50% of annual precipitation. The terrain of Xianning is composed of two parts: the low mountainous area in the southeast part, accounting for 23% of the total area; and the hilly area in the northwest, accounting for 77% of the total area. The elevation ranges from 18 m above sea level (ASL) in the northwest to 954 m (ASL) in the southeast.
2. Materials and methods
2.1. Data collection
The annual air temperature and rainfall data (1996–2010) of the three areas (Tongcheng, Chibi, and Jiayu) of Xianning were collected from the Xianning Meteorological Bureau. The annual air temperature and rainfall of Xianning were calculated from the average mean values of these three regions of Xianning. The climatic disaster events and their impacts data (1969–2010) were collected from the Xianning Civil Affairs Bureau. The water resources data (2001–2005) was collected from the Xianning Water Conservancy Website.
2.2. Data analysis
The data were analyzed using different software packages. For simple descriptive analyses, Statistical Package for Social Sciences (SPSS) version 2.1 was used to generate the results. Minitab 13.1(Shanmugam, Citation2020). was used to run the regression analyses to get the best-fitted results. The temperature and rainfall trends (1996–2010) were analyzed for variations in temperature and rainfall patterns. Then, the forecasting for temperature and rainfall (till 2025) under three hypothetical scenarios (B, 2B, 1/2B) was done based on the variation trends from available temperature and rainfall (1996–2010) data. Scenario B represented the same variation trends, scenario 2B represents double variation trends, and scenario 1/2B represents half variation trends for temperature and rainfall.
3. Results and discussion
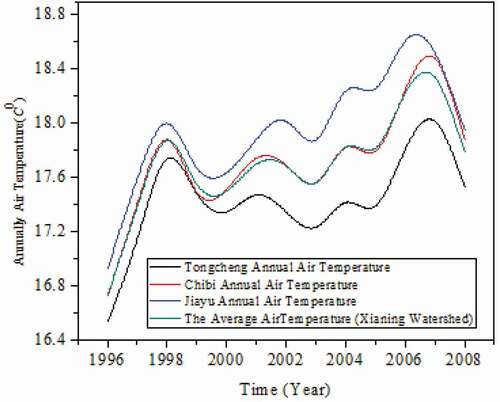
This conducted study echoed a trend of gradual impact of climate change in the Xianning watershed. This was evident from the changing variation trends of the annual temperature and rainfall of this region. The temperature trend of the three regions (Tongcheng, Chibi, and Jiayu) and their average mean temperature for the Xianning watershed area is shown in . There is an overall increasing trend of the annual temperatures in the Xianning watershed region.
Figure 1. Temperature trends in Xianning and its regions.
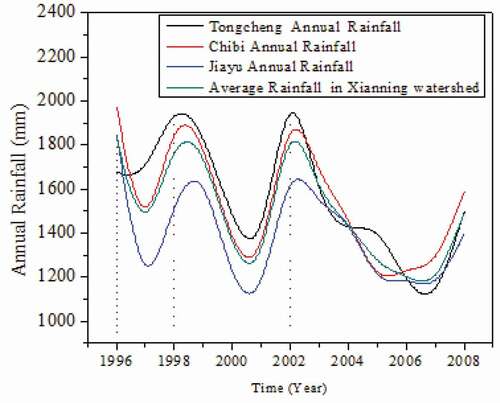
The rainfall pattern of the three regions (Tongcheng, Chibi, and Jiayu) and their average mean rainfall for the Xianning watershed area is shown in . There is an irregular trend in the rainfall pattern till 2002 (involving three extreme rainfall years of 1996, 2000, and 2002), which suddenly shifts to a decreasing trend from 2003 to 2008 in the Xianning watershed region. Furthermore, it is noteworthy that an extreme rainfall event occurs at an interval of every two or three years during the period 1996–2003. After that, the rainfall decreased during the period 2003–2008, which may result in a depression of the water resource recharge in the region.
Figure 2. Rainfall trends in Xianning and its regions.
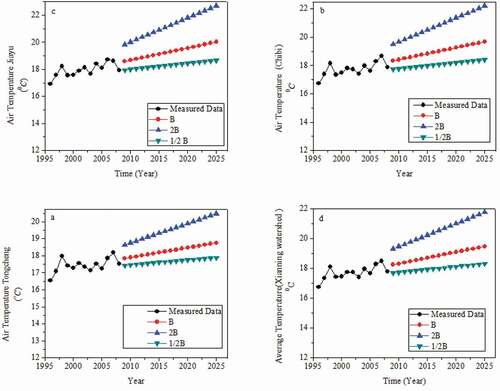
There is a significant increment in temperatures under three projected scenarios graphically represented in ) for regions of Xianning and in ) for the overall Xianning watershed region. The significant temperature rising until 2025 is clearly shown in ).
Figure 3. Annual measured temperature (1996–2008) along with predictive temperatures up to 2025: black circular dots for measured temperature, red circular dots for scenario B, blue triangular dots for scenario 2B and green triangular dots for scenario 1/2B of (a) Toncheng; (b) Chibi; (c) Jiayu; (d) Xianning Watershed.
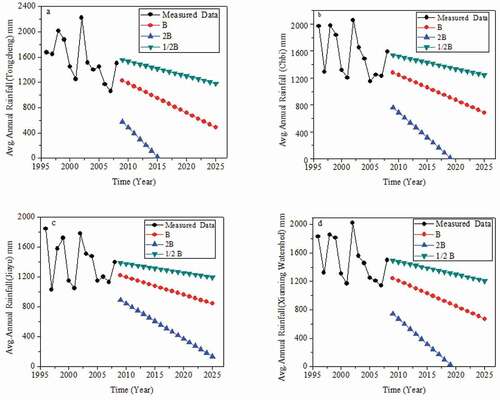
The trend of annual precipitation under three projected scenarios is graphically represented in ) for regions of Xianning and in ) for the overall Xianning watershed region. The irregular and decreasing trends of rainfall till 2025 are shown in ).
Figure 4. Annual measured rainfall (1996–2008) and predictive rainfall trends up to 2025: black circular dots for measured rainfall, red circular dots for scenario B, blue triangular dots for scenario 2B and green triangular dots for scenario 1/2B of (a) Tongcheng area; (b) Chibi area; (c) Jiayu area; (d) Xianning region.
The declining trend of rainfall in this area can be noticed by the gradual lowering of rainfall in the targeted regions of Xianning watershed. This clearly explains the climate change and its future impacts involving extreme climatic events and other disasters extrapolated through these findings. Rainfall was declining with time but as per the available data, the intensity of rainfall is unusual during the past five years. This is leading to consequent natural disasters such as an increase in flood frequency and enhanced losses in recent times. The most frequent natural disaster encountered in Xianning watershed is flooded, followed by frost and drought spells. These extreme climatic events occurred consistently and seem to increase in the last decades. The intensity of the extreme climatic events increased with the increase in losses from 1995. The 50-year (1969–2009) statistics of climatic disasters and their impacts in the Xianning region are shown in .
Table 1. Climatic disasters and their impacts
The overview of the water resources from 2001 to 2005 in the Xianning watershed is shown in . The results of this study showed that climate change involving temperature and rainfall variations significantly impacts the water resources in this region.
Table 2. Xianning city, water resources overview (2001–2005)
Although the subject tenure is less than required, it potentially discovers the rate of rainfall during the defined period and storage of reservoirs in million cubic meters (m3). The average rainfall in the region describes the storage power in the reservoirs. In the year 2002, a clear expression of highest rainfall is given but the storage capacity was almost 30% less than the year 2003 with a comparatively less average rainfall of 102.8 cubic meters. The average at three regions depicts the rising temperature either directly or indirectly resulting from the industrial emissions and deforestation practices (Yedla & Park, Citation2017). A similar result was also found by Su-Qin et al. (Citation2013) indicated that a clear increasing trend of annual mean temperature in Central China during 1961–2010. The increasing rate of annual mean temperature reached 0.15°C per decade, which is lower than the mean increasing rate in the whole of China (0.23°C per decade from 1951 to 2009).
The extreme hot atmosphere was specifically influenced by the amazing concentration and western augmentation of the subtropical high weight in the western Pacific Ocean, which was well connected with the worldwide temperature alteration (Yang & Li, Citation2005). Additionally, a few studies proposed a propensity of this kind of great temperature, regarding recurrence and the extent of events, being either the same or higher later. The escalating rate in yearly mean temperature amid 1961–2010 was extensive in eastern Hubei and northeastern Hunan, at the rate of 0.21° to 0.32°C per decade. The increase of temperature in Jiayu is significant in the Xianning region as the data from the past two decades explains the rise in temperature. The impact of natural disasters entailed a significant increase in intensity and a decrease in the frequency of the events (Meng et al., Citation2015). This may be an impact on the region due to global warming and climate change.
The understanding of human-climate-environment interactions is important for the assessment of ecosystems’ vulnerability to future climate change impacts (McGregor et al., Citation2009). The three discrete adaptation approaches are social vulnerability approaches focused to tackle social issues, resilience approaches focused to enhance the resilience of systems and targeted adaptation approaches focused on actions for dealing with climate change risks (Nelson & Anderies, Citation2009). There is a relationship between domains of resilience, vulnerability, and adaptation within the human dimensions of climate change (Janssen et al., Citation2006).
The monitoring and warning systems can be improved as main efforts for adaptation to climate extremes and reduction of disaster impacts. Better management practices are needed for adaptation to and mitigation of climate impacts on watershed such as water runoff variations. Climate change is profoundly impacting the hydrological response in the watershed. The global warming involves the increasing temperatures and their effects.
Our study supports the global warming theory as the temperatures are increasing in our study area. The increasing temperatures would lead to the rapid melting of glaciers which can cause flooding in some areas and would increase evaporation rates which can lead to a shortage of available water resources. The increasing temperatures and decreasing rainfall trends would lead to a shortage of water resources in this region. Climate change would also increase the frequency and intensity of extreme climatic events such as floods, droughts, heatwaves, cold epochs, etc. The extreme climatic events inflict significant damages and losses to the humans, ecosystems, and the environment. Based on this study, for future research, to envisage the hydrological changeability because of the land-use, as there are numerous inconsistencies, accompanying with future climate change systems.
4. Conclusion
Climate change impacts have been observed in the study region. The following conclusions are drawn from this study.
Increased in annual mean temperatures and decreased in annual total rainfall are consequently leading to more frequent and intense climatic disasters in the study region. These extreme climatic events occurred consistently and seem to increase in the last decades.
The analysis describes that the micro impact on the region which is certainly affecting the climate of the Xianning and whole area is under the threat of amplified natural disasters and losses risk.
The development of green infrastructure would support flood risk mitigation and climate extremes alleviation. The complete evaluation of temperature and precipitation, water storage volume, and flood risk analysis for different scales and periods would support decision-making on climate change adaptation and mitigation and water resources management.
Based on the assessment of this study, it is concluded that the available data for changing climate trends and its impacts in this region is very limited. Therefore, to improve the environment of this region and reduce climatic disasters, urgent action is required.
Acknowledgments
The authors wish to thank getting data support from the Xianning Meteorological Bureau, China, and the Xianning Civil Affairs Bureau, China, for conducting this study. This research did not receive any specific funding from in public, commercial, or not-for-profit agencies. We also thank the editor and two anonymous reviewers for rendering valuable comments and suggestions in improving this manuscript
Disclosure statement
No potential conflict of interest was reported by the authors.
References
- Ahmad, Z., Ashraf, A., Zaheer, M., & Bashir, H. (2016). Hydrological response to environmental changes in Himalayan watersheds: Assessment from an integrated modeling approach. Journal of Mountain Science, 12(4), 972–982. https://doi.org/https://doi.org/10.1007/s11629-013-2892-1
- Alodah, A., & Seidou, O. (2019). Assessment of climate change impacts on extreme high and low flows an improved bottom-up approach. Water, 11(6), 1236. https://doi.org/https://doi.org/10.3390/w11061236
- Arnell, N. W., Tompkins, E. L., & Adger, W. N. (2005). Eliciting information from experts on the likelihood of rapid climate change. Risk Analysis: An International Journal, 25(6), 1419–1431.
- Brunetti, M., Buffoni, L., Mangianti, F., Maugeri, M., & Nanni, T. (2004). Temperature, precipitation and extreme events during the last century in Italy. Global and Planetary Change, 40(1–2), 141–149. https://doi.org/https://doi.org/10.1016/S0921-8181(03)00104-8
- Coppola, E., & Giorgi, F. (2010). An assessment of temperature and precipitation change projections over Italy from recent global and regional climate model simulations. International Journal of Climatology: A Journal of the Royal Meteorological Society, 30(1), 11–32. https://doi.org/https://doi.org/10.1002/joc.1867
- Dai, A., Zhao, T., & Chen, J. (2018). Climate change and drought: A precipitation and evaporation perspective. Current Climate Change Reports, 4(3), 301–312. https://doi.org/https://doi.org/10.1007/s40641-018-0101-6
- Dudula, J., & Randhir, T. O. (2016). Modeling the influence of climate change on watershed systems: Adaptation through targeted practices. Journal of Hydrology, 541, 703–713. https://doi.org/https://doi.org/10.1016/j.jhydrol.2016.07.020
- Field, C. B., Barros, V., Stocker, T. F., & Dahe, Q. (Eds.). (2012). Managing the risks of extreme events and disasters to advance climate change adaptation: special report of the intergovernmental panel on climate change, Cambridge University Press.
- Fossey, M., & Rousseau, A. N. (2016b). Can isolated and riparian wetlands mitigate the impact of climate change on watershed hydrology? A case study approach. Journal of Environmental Management, 184, 327–339. https://doi.org/https://doi.org/10.1016/j.jenvman.2016.09.043
- Gregory, J. M., & Mitchell, J. F. B. (1995). Simulation of daily variability of surface temperature and precipitation over Europe in the current and 2× CO2 climates using the UKMO climate model. Quarterly Journal of the Royal Meteorological Society, 121(526), 1451–1476. https://doi.org/https://doi.org/10.1002/qj.49712152611
- Hansen, J., Sato, M., & Ruedy, R. (2012). Perception of climate change. Proceedings of the National Academy of Sciences, 109(37), E2415–E2423. https://doi.org/https://doi.org/10.1073/pnas.1205276109
- Janssen, M. A., Schoon, M. L., Ke, W., & Börner, K. (2006). Scholarly networks on resilience, vulnerability and adaptation within the human dimensions of global environmental change. Global Environmental Change, 16(3), 240–252. https://doi.org/https://doi.org/10.1016/j.gloenvcha.2006.04.001
- Khan, J. Z., & Zaheer, M. (2018). Impacts of environmental changeability and human activities on hydrological processes and response. Environmental Contaminants Reviews (ECR), 1(1), 13–17. https://doi.org/https://doi.org/10.26480/ecr.01.2018.13.17
- Leta, O. T., El-Kadi, A. I., Dulai, H., & Ghazal, K. A. (2016). Assessment of climate change impacts on water balance components of Heeia watershed in Hawaii. Journal of Hydrology: Regional Studies, 8, 182–197. https://doi.org/https://doi.org/10.1016/j.ejrh.2016.09.006
- Lirong, S., & Jianyun, Z. (2012). Hydrological response to climate change in Beijiang River Basin based on the SWAT model. Procedia Engineering, 28, 241–245. https://doi.org/https://doi.org/10.1016/j.proeng.2012.01.713
- McGregor, H. V., Dupont, L., Stuut, J. B. W., & Kuhlmann, H. (2009). Vegetation change, goats, and religion: A 2000-year history of land use in southern Morocco. Quaternary Science Reviews, 28(15–16), 1434–1448. https://doi.org/https://doi.org/10.1016/j.quascirev.2009.02.012
- Meng, Y., Shi, P., Yang, S., & Jeager, C. C. (2015). The asymmetric impact of natural disasters on China’s bilateral trade. Natural Hazards & Earth System Sciences Discussions, 3(3), 2003–2023. https://doi.org/https://doi.org/10.5194/nhessd-3-2003-2015
- Mo, X. G., Hu, S., Lin, Z. H., Liu, S. X., & Xia, J. (2017). Impacts of climate change on agricultural water resources and adaptation on the North China Plain. Advances in Climate Change Research, 8(2), 93–98. https://doi.org/https://doi.org/10.1016/j.accre.2017.05.007
- Napoli, M., Massetti, L., & Orlandini, S. (2017). Hydrological response to land use and climate changes in a rural hilly basin in Italy. Catena, 157, 1–11. https://doi.org/https://doi.org/10.1016/j.catena.2017.05.002
- Nelson, D. R., & Anderies, J. M. (2009). Hidden costs and disparate uncertainties: Trade-offs in approaches to climate policy. Adapting to Climate Change: Thresholds, Values, Governance, 212.
- Peterson, T. C., Stott, P. A., & Herring, S. (2012). Explaining extreme events of 2011 from a climate perspective. Bulletin of the American Meteorological Society, 93(7), 1041–1067. https://doi.org/https://doi.org/10.1175/BAMS-D-12-00021.1
- Pumo, D., Arnone, E., Francipane, A., Caracciolo, D., & Noto, L. V. (2017). Potential implications of climate change and urbanization on watershed hydrology. Journal of Hydrology, 554, 80–99. https://doi.org/https://doi.org/10.1016/j.jhydrol.2017.09.002
- Shanmugam, R. (2020). Essentials of Excel, Excel VBA, SAS, and Minitab for statistical and financial analysis: by Cheng-Few Lee, John Lee, John-Ran Chang and Tzu Tai, Chan, Springer Verlag Press, 2016 (pp. 1041+ xx) $109.00 (paperback), ISBN: 978-3-319-388865-6.
- Shrestha, N. K., Du, X., & Wang, J. (2017). Assessing climate change impacts on freshwater resources of the Athabasca River Basin, Canada. Science of the Total Environment, 601, 425–440. https://doi.org/https://doi.org/10.1016/j.scitotenv.2017.05.013
- Simonovic, S. P. (2017). Bringing future climatic change into water resources management practice today. Water Resources Management, 31(10), 2933–2950. https://doi.org/https://doi.org/10.1007/s11269-017-1704-8
- Su-Qin, W., Yuan, G., Bo, Z., Hai-Jun, W., Min, L., Rui-Qin, S., & Kai, W. (2013). Climate change facts in central China during 1961–2010. Advances in Climate Change Research, 4(2), 103–109. https://doi.org/https://doi.org/10.3724/SP.J.1248.2013.103
- Thompson, R. (1999). A time-series analysis of the changing seasonality of precipitation in the British Isles and neighboring areas. Journal of Hydrology, 224(3–4), 169–183. https://doi.org/https://doi.org/10.1016/S0022-1694(99)00129-8
- Wang, G., Zhang, J., He, R., Liu, C., Ma, T., Bao, Z., & Liu, Y. (2017). Runoff sensitivity to climate change for hydro-climatically different catchments in China. Stochastic Environmental Research and Risk Assessment, 31(4), 1011–1021. https://doi.org/https://doi.org/10.1007/s00477-016-1218-6
- Wu, L., Wang, S., Bai, X., Luo, W., Tian, Y., Zeng, C., … He, S. (2017). Quantitative assessment of the impacts of climate change and human activities on runoff change in a typical karst watershed, SW China. Science of the Total Environment, 601, 1449–1465. https://doi.org/https://doi.org/10.1016/j.scitotenv.2017.05.288
- Xia, J., Duan, Q. Y., Luo, Y., Xie, Z. H., Liu, Z. Y., & Mo, X. G. (2017). Climate change and water resources: Case study of Eastern Monsoon Region of China. Advances in Climate Change Research, 8(2), 63–67. https://doi.org/https://doi.org/10.1016/j.accre.2017.03.007
- Xu, X., Wang, Y. C., Kalcic, M., Muenich, R. L., Yang, Y. E., & Scavia, D. (2019). Evaluating the impact of climate change on fluvial flood risk in a mixed-use watershed. Environmental Modelling and Software, 122, 104031. https://doi.org/https://doi.org/10.1016/j.envsoft.2017.07.013
- Yang, H., & Li, C. Y. (2005). Diagnostic study of serious high temperature over South China in 2003 summer. Clim Environ Res, 10(1), 80–85.
- Yedla, S., & Park, H. S. (2017). Eco-industrial networking for sustainable development: Review of issues and development strategies. Clean Technologies and Environmental Policy, 19(2), 391–402. https://doi.org/https://doi.org/10.1007/s10098-016-1224-x
- Zaheer, M., Ahmad, Z., & Shahab, A. (2016). Hydrological modeling and characterization of the Khanpur Watershed, Pakistan. Journal Awwa, 108, 5. https://doi.org/https://doi.org/10.5942/jawwa.2016.108.0043
- Zhang, L., Meng, X., Wang, H., & Yang, M. (2019). Simulated runoff and sediment yield responses to land-use change using the SWAT model in northeast China. Water, 11(5), 915. https://doi.org/https://doi.org/10.3390/w11050915
- Zhang, H., Xu, W., Xu, X., & Lu, B. (2017). Responses of streamflow to climate change and 382 human activities in a river basin, Northeast China. Advances in Meteorology 2017.
- Zhang, Q., Chen, Y. D., Chen, X., & Li, J. (2011). Copula-based analysis of hydrological extremes and implications of hydrological behaviors in the Pearl River basin, China. Journal of Hydrologic Engineering, 16(7), 598–607. https://doi.org/https://doi.org/10.1061/(ASCE)HE.1943-5584.0000350
- Zhu, Q., Jiang, H., Peng, C., Liu, J., Fang, X., Wei, X., … Zhou, G. (2012). Effects of future climate change, CO2 enrichment, and vegetation structure variation on hydrological processes in China. Global and Planetary Change, 80, 123–135. https://doi.org/https://doi.org/10.1016/j.gloplacha.2011.10.010
- Zhu, Y., Lin, Z., Wang, J., Zhao, Y., & He, F. (2016). Impacts of climate changes on water resources in the Yellow River Basin, China. Procedia Engineering, 154, 687–695. https://doi.org/https://doi.org/10.1016/j.proeng.2016.07.570