
ABSTRACT
The main aim of the present study was to weigh up and identifies the groundwater quality in the Amaravathi River basin of Karur district. Twenty four samples were collected, processed, and analyzed for various physico-chemical parameters such as pH, electrical conductivity (EC), total dissolved solids (TDS), total hardness (TH), cation such as calcium (Ca2+), magnesium (Mg2+), sodium (Na+), and potassium (K+); anion such as bicarbonate (HCO3−), chloride (Cl−), sulphate (SO42-), and fluoride (F−) in the laboratory using the standard methods given by the American Public Health Association. Specifically, we investigated trace metals like cadmium (Cd2+), lead (Pb2+), copper (Cu2+), zinc (Zn2+), manganese (Mn2+), nickel (Ni2+), and iron (Fe2+) using Atomic Absorption Spectrophotometer. Out of 24 samples, Thirumanilayur sample is taken for treatment process because all the physico–chemical parameters, and heavy metals Cd2+ and Pb2+ were well above the permissible limits laid by World Health Organizationand Bureau of Indian Standards.Graphene oxide (GO) nanoparticle is taken for treatment process and its adsorption capacity was confirmed by XRD, SEM, FTIR, and EDS techniques. The treated groundwater sample using graphene oxide nanomaterial (60 and 80 mg) show a positive result for reducing the excess metal ions (Cd2+ and Pb2+), in addition to various water quality parameters.
Introduction
Water is the most essential substance for all life on earth and a precious resource for human civilization (Shrivastava & Mishra, Citation2011). There are no other natural resources that have such an overpowering influence on human lives and plants (Loganathan & Jafar Ahamed, Citation2017; Sultanaa et al., Citation2017). Reliable access to clean and affordable water is considered one of the most basic humanitarian goals, and remains a major global challenge for the 21st century. It is well known that nowadays, industrial water use is a major factor of global water crisis due to drastic increase in population and industries (Santos et al., Citation2014). The water usage trends in India in the year 2012 show that 13% of the natural water sources are used for industries. Report by World Commission on Water revealed that fresh water usage will be increased worldwide by around 60% in the year 2050. For this reason, it is very important that effective water management activities to protect the water environment (Thirugnanasambandham et al., Citation2016). In India, various industries consume large amount of fresh water for their process as well as industries discharge highly polluted wastewater to the nearby ecological system (Ahamed & Loganathan, Citation2012).
Karur is a major textile center and has five major product groups, namely bed linens, kitchen linens, toilet linens, table linens and wall hangings. An earlier survey in 2011 says that the total number of factories located on the banks of the Amaravathi River is about 515. The dyeing industry consumes totally 3225 liters of water per day for dyeing process. About 14600 m3 of coloured effluent with TDS 5000–10,000 mg/L is let into the Amaravathi River daily (Ahamed et al., Citation2013). Big factories had even dug tube wells to a depth of 275 meters and discharged effluents into these wells lead to contamination of groundwater in the area. Soil turned infertile, the yield of the crops came down, slowly the farmlands became barren and 250 open wells get contaminated. Kidney disorders, cancer and abortion are high in the affected villages, revealed by local natives. Owing to zero discharge of effluents, in 2011, 459 dyeing units were closed and only 54 factories were given permission after they installed ETP (Loganathan & Jafar Ahamed, Citation2017; Suchitra, Citation2014).
Asha (Citation1998) has motivated scientists to look at the problems faced by the general public and farmers who use the groundwater for drinking, bathing, washing, agriculture, etc. Rajamanickam and Nagan (Citation2010) have revealed that the Amaravathi River has been converted as drainage for industrial and domestic effluents. It is also reported that the water quality parameters have been well above the permissible limits suggested by WHO (Citation1977). Sivakumar et al. (Citation2011) quantified that groundwater quality parameters of the Amaravathi River basin were crossing the permissible limits due to industrial and textile industrial activities. Similar results were reported by Raja and Venkatesan (Citation2010), that the groundwater in Punnam village of Karur district is highly polluted due to the release of textile industries effluent.
Water contains chemical parameters which are above the permissible limit may cause some serious damages, which is considered to be polluted. Nowadays, numerous methods have been proposed for efficient removal of pollutants from the waters, including but not limited to, chemical precipitation, ion exchange, adsorption, membrane filtration and electrochemical technologies (Wu et al., Citation2013). Among these techniques, adsorption offers flexibility in design and operation and, in many cases it will generate high-quality treated effluent (Hua et al., Citation2012). The adsorption principle plays a vital role in the treatment of environmental pollution. Adsorption means a process in which the solute species accumulate at an interface. The interface may be gas-solid, liquid- liquid, liquid-gas and liquid- solid. It is purely a surface phenomenon, deals with only those species, which are bound to the surface of the adsorbate. The plan of nanostructured adsorbents with controlled functionalities offers new possibilities to tackle the low adsorption capacity or efficiency problems because of their high specific surface areas and enhances active sites (Sharma et al., Citation2009). Carbon based nanomaterials, especially carbon aerogels, carbon nanotubes, graphene, and their composites, represent a promising type of adsorbents (Gao et al., Citation2013) for water and wastewater treatment, and have potential applications for removal of heavy metals and organic contaminants.
Description of the study area
The river Amaravathi originates from Naimakad at an elevation of 2300 m above mean sea level in the Western Ghats in Idukki region of state Kerala (). Amaravathi River in Karur lies between north latitudes 11.20° and 12.00° and east longitudes 77.28° and 78.50°. Amaravathi river reach Karur district near Aravakurichi and joins with Cauvery River near Thirumakudalur village, and the water flow in the river is seasonal from late October to early February (Ahamed et al., Citation2015b). Amaravathi River basin and sub-basin ()) has four different seasons, namely summer season from March to May, southwest monsoon commencing from June to early September, northeast monsoon beginning of October to December and winter season starting from January to February. The average annual rainfall over the district from 1901 to 2011 varies between 620 and 745 mm, and in 2012, it was founded as 527.6 mm, much less than the states normal average rainfall of 652.20 mm (Renganathan, Citation2014), and it is the least around Aravakurichi (622.7 mm) in the western region of the district. It progressively increases toward eastern parts and reach a maximum around Kulithalai (744.6 mm). The district enjoys a sub-tropical climate, and the relative humidities generally range from 40 to 80%. The average maximum temperature ranges from 26.7 to 38.56°C, and the average minimum temperature ranged between 18.7 and 29.3°C. The daylight heat is oppressive and the temperature attains high as 43.9°C and the lowest temperature observed is 13.9°C (CGWB, Citation2008).
Figure 1. Location of sampling sites on the Amaravathi River basin.
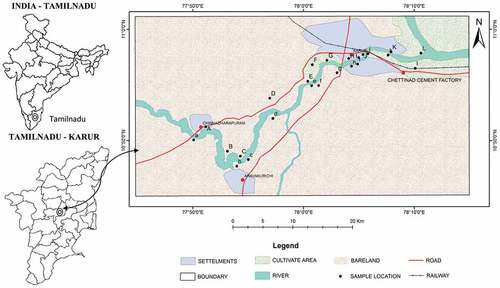
Figure 2. Map showing the (a) River (b) Geomorphology and Lineament (c) Soil and (d) Geology of the Karur district.
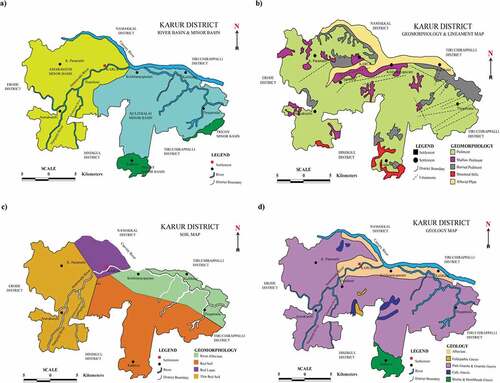
Completely the entire area of the Karur district is a pediplain. Kadavur and Rangamalai hills occurring in the southern part of the district comprise the loose ends of the much denuded Eastern Ghats and rise to heights of over 1031 m above mean sea level. District possesses several small residual hills represented by Ayyarmalai, Thanthonimalai and Velayuthampalayam hills. General altitude of the area is ranging between 100 m and 200 m above mean sea level. The well-known geomorphic units ()) known in the district are pediments, shallow pediments, buried pediments, structural hill and alluvial plain (Ahamed et al., Citation2016). Cauvery River drained the major parts of the Karur district. Amaravathi, Kodavanar and Nanganji are the chief rivers draining the western region of the district and Pungar River drains in the eastern region of the district. The drainage pattern generally, is dendritic. Except river Cauvery, all the rivers are seasonal and bring substantial flows during the monsoon time (Ahamed & Loganathan, Citation2012).
Major part of the district is covered with red soil is the predominant one followed by red loam and thin red soil. Red soil is mostly seen in Kulithalai, Kadavur, Krishnarayapuram, Thogamalai and Thanthoni blocks. Karur block is generally covered by red loam ()). The thin red soils are seen in K. Paramathy and Aravakurichi blocks. The major economic crops cultivated in this area are jowar (22.60%), paddy (16.30%), groundnut (6.90%), sugar cane (6.40%) and banana (5.30%). The total geographical area is 2,89,557 ha of which area employed in cultivation is 1,14,554 ha, 37,264 ha land put into non-agricultural uses (Ahamed and Loganathan, Citation2017) and remaining are engaged in other activities (). The available data indicates that an area of about 54,709 ha, which is about 18.90% of the total geographical area of the district is in irrigated agriculture. Dug wells accounting for about 59.97% of the total area irrigated in the district was the major source of water for irrigation. Tube wells account for about 9.48% of the total area irrigated in the district, while tank irrigation accounts only for 1.10%. Comparing the entire irrigation type, the canal irrigates only 29.45% area (Ahamed et al., Citation2015b).
Table 1. The nine-fold lands-use/land-cover statistics for the district.
Geology and hydrogeology
The district is underlained entirely by Archaean Crystalline formations with fresh alluvial deposits taking place along the river and stream courses. The rigid consolidated crystalline rocks of Archaean age symbolize weathered, fractured and fissured formations of gneisses, granites, charnockites and additional related rocks ()). Deep groundwater occurs beneath phreatic conditions, and the most saturated thickness of the aquifer in rigid rock creation varied between 15 and 35 m depending upon the topographic circumstances (Ahamed et al., Citation2015b). Thickness of the alluvial deposit is estimated to be approximately 10–12 m. The specific capacity of large diameter wells tested in crystalline rocks from 31 to 200 lpm/m of drawdown. The yield characteristics of wells vary considerably depending on the topographic set-up, lithology and the degree of weathering. The seasonal fluctuation shows a rise in water level, which ranges from 0.46 to 1.98 m. The piezometric head varied between 3.53 and 5.34 m bgl during pre-monsoon and 2.04 to 7.59 m bgl during post-monsoon. The specific capacity in the weathered, partly weathered and jointed rocks varies from 31 to 240.5 lpm/m/dd and the transmissivity values in weathered, partly weathered and jointed rocks vary from 15.5 to 154 m2/day. The optimum yield varied from 45.40 to 441.60 m3/day. The specific capacity in the fissured and fractured formation ranges from 6.89 to 117.92 lpm/m/dd and the transmissivity values ranges from 11.42 to 669.12 m2/day. The specific capacity values in the porous formation vary from 135 to 958 lpm/m.dd and the transmissivity values ranged from 67.5 to 264.5 m2/day. The optimum yield varied from 232.8 to 549.6 m3/day (Loganathan & Jafar Ahamed, Citation2017).
Materials and methods
Water sampling and analysis
Twenty four groundwater samples were collected from bore and hand pumps during August (2014), representing the pre-monsoon seasons. Bore wells and hand pumps for sampling were chosen on the base of an industrial unit in addition to diverse land use patterns. represents the GIS map of the study area showing sampling locations. During sample collection high density white polyethylene bottles were used. The samples were filled up to the rim and were instantly preserved to avoid exposure to air and were labeled scientifically. The labeled water samples were analyzed for their physico-chemical parameters in the laboratory. At sample collection for handling and preservation the American Public Health Association (APHA, Citation2005) standard procedures were followed to guarantee data quality and reliability. The total dissolved solids (TDS), hydrogen ion concentration (pH) and electrical conductivity (EC) were determined immediately on location by using water quality multi-tester probe (Eutech PC Tester 35), and the major ions were examined using the standard procedure suggested by the American Public Health Association (APHA, Citation2005). Sodium (Na+) and potassium (K+) were determined by Flame photometer using Systronics make 128. Total hardness (TH), calcium (Ca2+), magnesium (Mg2+), bicarbonate (HCO3−), and chloride (Cl−) were analyzed by volumetric methods following Trivedy and Goel (Citation1986) methods and sulphates (SO42-) were estimated by precipitation method using spectrophotometer. Fluoride ion concentration was estimated by ion selective electrode (Thermo scientific Orion 4 star). The accurateness of the results was performed by calculating the ionic balance errors and it was usually within ± 5%. The water samples were filtered using a 0.45 µm Whatman filter paper. The samples were preserved by acidifying to pH ~ 2 with HNO3 and kept at a temperature of 4°C until analysis. Prior to any analysis, all the glassware and containers were soaked in deionized distilled water. The determination of metal ions Cd2+, Pb2+, Cu2+, Zn2+, Mn2+, Ni2+, and Fe2+ (227, 281.5, 323, 212, 278, 231 and 247.5 nm respective wavelength) in water samples were carried out by atomic absorption spectrophotometer (Perkin Elmer A analyst 400). The limit of detection for Cd was 0.0001 and 0.001 ppm for all other elements. The blank readings for all the metals were 0.00 ppm in deionized water with EC value lower than 5 µS/cm.
Treatment process
Preparation of graphene oxide
Graphene oxide was prepared according to the modified Hummer’s method that has been reported previously (Hummers & Offeman, Citation1958; Xu et al., Citation2012) using graphite powder procured from sigma Aldrich (SP-1 grade 325 mesh). In a typical synthesis, graphite powder (10 g) was added into an 80°C solution of concentrated H2SO4 (20 ml), K2S2O8 (4.2 g), and P2O5 (4.2 g) and the dark blue mixture was stirred vigorously and kept at 80°C for 4.5 h. The mixture was cooled to room temperature, and diluted with 45 ml of deionized water. Finally, the solution was transferred to a large beaker, and left overnight. The mixture was then carefully filtered and washed with deionized water using 0.22 μm polycarbonate filter until the pH value of the rinse water became neutral. The obtained product was dried at 40°C for 24 hours under vacuum (Ahamed et al., Citation2015a).
The pre-oxidized graphite powder was then oxidized by the Hummer’s method. 2 g of pre-oxidized graphite powder was added in 46 ml of concentrated H2SO4 of cold (0°C) condition. Then 12 g of KMnO4 was added gradually under stirring and the temperature of the mixture was maintained not exceeding 20°C. Then, it was removed from the ice-bath and the mixture was stirred at 35°C for 2 hours. 97 ml of deionized water was slowly added gradually into the mixture and the diluted suspension was maintained at 98°C for 15 min. Again, 280 ml of deionized water and 5 ml of 30% H2O2 were added into the suspension. A brilliant yellow mixture was obtained and the product was centrifuged and washed with 10% HCl solution to remove the excessive residual metal ions followed by deionized water to remove the acid until the pH of filtrate was neutral. The final dark brown solid product was obtained and dried in vacuum. Exfoliation was done by sonicating the oxidized graphite dispersion for 30 min at 240 W. The prepared Graphene Oxide was dried in vacuum for 24 h (Ahamed et al., Citation2015a).
Carbon nanosheet (graphene oxide) prepared from graphite was used for the treatment of groundwater sample collected from Thirumanilayur station. Equilibrium study (180 min) was carried out by adding 60 mg and 80 mg of adsorbent into each 100 ml of the same sample. The bottles were placed in a rotary shaker and agitated for 180 min at a speed of 150 rpm to make sure that equilibrium is reached. The content was filtered, analyzed and the values were compared with the same sample before adsorption process and also with WHO (Citation2005) and BIS (Citation2003) standards.
Characterization techniques
The prepared graphene oxide (GO) nanoparticles were subjected to XRD analysis. The XRD pattern was recorded (model: X’PERT PRO PAN analytical) using Cu Kα radiation (λ = 1.54060 Å) with nickel monochromator in the range of 2θ from 10° to 80°. The area, size and morphology of the prepared GO were characterized by FESEM (Field emission scanning electron microscopy – ZEISS EVO MA 15). The elemental composition of the as-prepared sample was quantified by energy dispersive spectroscopy (EDS) using an X-ray detector (THERMO EDS) attached to the FESEM instrument. Additionally, Fourier transform infra–red spectroscopy (FT–IR) analysis was carried out in the range of 400–4000 cm−1 (Perkin Elmer).
Results and discussion
Groundwater chemistry
In this study area, pH values ranged between 6.94 and 7.81 with the mean value of 7.44 indicating that groundwater is slightly alkaline in nature. EC varied from 890 µS/cm to 6560 µS/cm with mean of 4532 µS/cm. TDS showed a wide variation from 798 to 4546 mg/L with average value of 3867 mg/L. Based on EC value (Langenegger, Citation1990), groundwater is classified into saline water (1500–10,000 µS/cm). TH ranged between 445 and 1933 mg/L with mean value of 1328 mg/L, the excess concentration is due to mineral weathering (bivalent cation Ca and Mg). During the analysis, Ca2+ and Mg2+ range from 82 to 591 mg/L and 52 to 116 mg/L, respectively. The excess calcium originated from leaching process of dolomites and gypsum, were as magnesium is from cattle feed and fertilizer application. Sodium is responsible for high salinity; it ranged between 674 and 1529 mg/L with mean value of 956 mg/L, which derived from halite due to adsorption on sediments near the river belt. 93% of samples were in the borderline of potassium limit (12 mg/L).
Among anions, Cl− having excess concentration ranged between 583 and 1619 mg/L, basically chloride is found in sewage and course of water passing through natural salt formation in the earth crust. SO42-, F− and HCO3− concentration ranged from 203 to 264 mg/L, 0.9 to 1.6 mg/L and 226 to 398 mg/L, respectively. Metal concentration recorded were ranked in the order Cd2+ > Pb2+ > Zn2+ > Cu2+ > Fe2+ > Mn2+ > Ni2+. Except cadmium and lead all other metals are within the limit.
Water treatment process
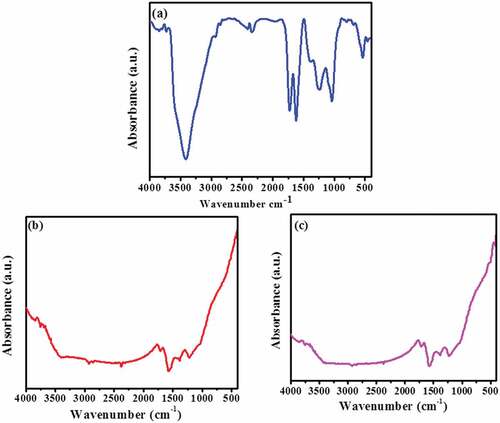
A preliminary study on Thirumanilayur sample has been carried out to assess the reduction nature of graphene oxide using adsorption techniques. The physical nature of graphene oxide before treatment has been investigated using analytical techniques. X-ray diffraction measurements have been recorded during different steps of preparation of nanocomposites. depicts the XRD studies of the GO materials, which is due to the oxidation process of graphite. The effective oxidation of graphite and the formation of GO has been compared with the characteristic strong and sharp (002) peak at 11.02°. A typical FESEM image of the GO is given in ) which shows a simple nanosheet morphological structure. Wave like surface morphology nanosheet is observed for the entire reconstructed nanocomposites. The elemental analysis data clearly indicates that graphene is coordinate with the oxygen atom. EDS profile of graphene oxide C0.56:O0.44 is in ). The IR frequencies at 3411 cm−1, 1725 cm−1, 1038 cm−1, and 1237 cm−1 confirms the presence of many oxygen containing groups such as OH, C=O, C-O, C-OH, respectively in graphene oxide ()). These evidences indicate that during the oxidation process of the graphite powder with KMnO4 in the concentrated sulphuric acid, the original extended conjugated π-orbital system of the graphite is destroyed and oxygen-containing functional groups are introduced into carbon skeleton (Ahamed et al., Citation2015a). The results of the treated sample (Thirumanilayur) show a conspicuous reduction among water quality parameters. The graphene oxide is found to be more effective in removing metals in water samples. The values obtained for raw sample and after the treatment process by varying adsorbent dosage (60 and 80 mg) are compared with standard limits of WHO (Citation2005) and BIS (Citation2003) is presented in .
Table 2. Treated result for the adsorption process by graphene oxide.
Figure 3. XRD pattern of graphene oxide before treatment (GO) after treatment (60 and 80 mg).
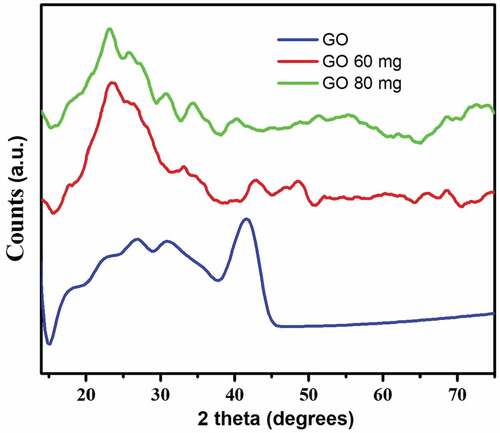
Figure 4. (a,b) SEM images of graphene oxide before treatment; (c) SEM images of graphene oxide (60 mg) and (d) SEM images of graphene oxide (80 mg) after treatment.
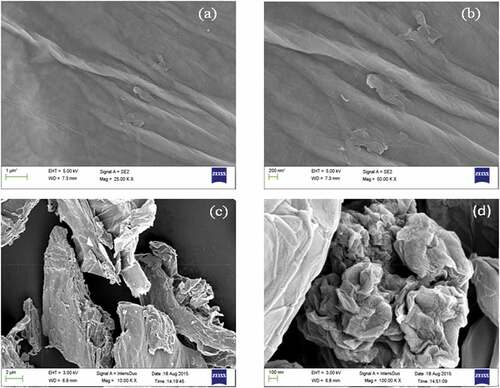
Figure 5. (a) EDS analysis of graphene oxide before treatment (b and c) EDS analysis of graphene oxide 60 mg and 80 mg after treatment.
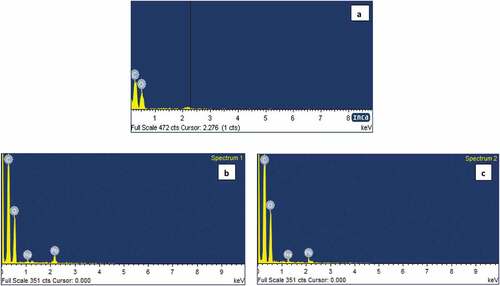
Figure 6. (a) FTIR spectra of graphene oxide before treatment; (b & c) FTIR spectra of graphene oxide 60 mg and 80 mg after treatment
pH of raw water sample is 7.82 and after treatment it is 7.90 and 7.98 for 60 and 80 mg adsorbent, respectively. pH is within the permissible limit, but the increase in pH is due to the release of – OH group. Literature (Gao et al., Citation2013) has revealed that Pb(II) and Cd(II) forms metal hydroxide, when the pH value is greater than 6.0. Thus, the increase in pH dramatically increases the adsorption capacities of Pb(II) and Cd(II). The value of the EC in raw sample is 6560 µS/cm, and it is 6193 and 5892 µS/cm after treatment. TDS value ranged between 4292 and 4083 mg/L for 60 and 80 mg adsorbent, and it is 4546 mg/L for raw sample, the reduction of EC and TDS value confirms the adsorption take place in the system. There is no notable reduction in hardness, shows that hardness is permanent in nature due to divalent cations (Ca2+ and Mg2+). Among cations, Na+ and K+ were reduced well when compared with Ca2+ and Mg2+. The initial concentration of Na+ and K+ is 1529 and 14.24 mg/L, after treatment, it is reduced to 1361 & 10.78 mg/L for 60 mg adsorbent and 1278 & 8.16 mg/L for 80 mg adsorbent. The initial and final concentration of Na+ and K+ in the sample was confirmed by Systronics Flame photometer 128. The result showed that the adsorption of metal ions took place in the binding sites on the surface of the adsorbent in a monolayer mode.
The anionic species are not much reduced, because of the presence of negative charge on the surface of graphene oxide. Among trace elements, Pb2+ is well adsorbed on the GO, since heavy metals in the solution are positively charged, the metal ion Pb2+ bound strongly to graphene oxide. The initial concentration of Pb2+ in raw sample is 0.295 mg/L and after treatment it is 0.083 and 0.077 mg/L for 60 and 80 mg adsorbent. Trace amount of Cd2+ is also adsorbed and the concentration is observed through an atomic absorption spectrophotometer. The spectral studies evidently depict the reduction process take place in the water sample. , the XRD pattern clearly indicates that the graphene oxide peak is disappeared in 11.02° and new amorphous graphene oxide structure is observed. It shows that the metal ions are adsorbed on the surface of carbon nanosheet. The FESEM images of treated GO samples () obviously display the agglomerated flake like morphological structure. It confirmed the change of surface uniformity from GO to metal adsorbed GO nanosheets. Meanwhile, EDS () analysis is evidences that the sodium and lead are predominantly adsorbed on the surface of GO nanosheets. FTIR spectra of treated GO samples in demonstrate the absence of OH, C=O peak at 3411 cm−1 and 1725 cm−1 which confirms the process of adsorption taking place on GO, which is further confirmed that, the metal or metal hydroxide (Zhou et al., Citation2012) peaks appear below 1500 cm−1.
Conclusion and summary
In this present study the dominant cation found in groundwater is Na+ followed by Ca2+, Mg2+ and K+. The dominant anion is Cl− followed by HCO3−, SO42- and F−. Among trace elements Cd2+ and Pb2+ were in excess concentration. Analysis identifies both man-made activities and geochemical process responsible for groundwater quality in Amaravathi River basin. Reduced graphene oxide is used as adsorbent to reduce excess ion concentration. The parameters like EC, TDS, Na+, K+ and metals like Cd2+ and Pb2+ showed remarkable reduction. The rate of adsorption increases when increase in adsorbent dosage. XRD pattern, FESEM and EDS analysis confirmed the adsorption process. The groundwater in the Amaravathi River Basin is in a critical situation and the results of the groundwater quality can be employed in future groundwater panning and developments.
Acknowledgments
The one of the author Dr. A. Jafar Ahamed is thankful to the University Grants Commission (UGC), New Delhi for providing Major Research Fund (F. No.41-337/2012) and the Members of the Management Committee and the Principal of Jamal Mohamed College for providing necessary facilities.
Disclosure statement
No potential conflict of interest was reported by the author(s).
Additional information
Funding
References
- Ahamed, A. J., Loganathan, K., Ananthakrishnan, S., & Manikandan, K. (2016). Chapter-12: Physico-chemical and microbiological studies of soils in Amaravathi River bed area, Karur District, Tamil Nadu, India. In P. Ramasami, M. Gupta Bhowon, S. Jhaumeer Laulloo, & H. Li Kam Wah (Eds.), Crystallizing ideas - The role of chemistry (pp. 181–199). Springer International Publishing. https://doi.org/10.1007/978-3-319-31759-5
- Ahamed, A. J., & Loganathan, K. (2012). Assessment and correlation analysis of surface and groundwater of Amaravathi River basin-Karur, Tamilnadu, India. Journal of Chemical and Pharmaceutical Research, 4(8), 3972–3983. https://www.jocpr.com/articles/assessment-and-correlation-analysis-of-surface-and-ground-water-of-amaravathi-river-basinkarur-tamilnadu-india.pdf
- Ahamed, A. J., & Loganathan, K. (2017). Water quality concern in the Amaravathi River basin of Karur District: A view at heavy metal concentration and their interrelationships using geostatistical and multivariate analysis. Geology, Ecology and Landscapes, 1(1), 19–36. https://doi.org/10.1080/24749508.2017.1301055
- Ahamed, A. J., Loganathan, K., & Jayakumar, R. (2015b). Hydrochemical characteristics and quality assessment of groundwater in Amaravathi river basin of Karur district, Tamil Nadu, South India. Sustainable Water Resources Management, 1(3), 273–291. https://doi.org/10.1007/s40899-015-0026-3
- Ahamed, A. J., Loganathan, K., & Vijayakumar, P. (2013). Bio-chemical investigation of selected water quality parameters in Amaravathi River basin, Karur district, Tamilnadu, India. International Journal of Current Research, 5(10), 3100–3103. http://journalcra.com/article/bio-chemical-investigation-selected-water-quality-parameters-amaravathi-river-basin-karur
- Ahamed, A. J., Vijaya Kumar, P., & Srikesh, G. (2015a). Low temperature synthesis and characterization of rGO-CoO nanocomposite with efficient electrochemical properties. Journal of Environmental Nanotechnology, 4(2), 01–08. https://doi.org/10.13074/jent.2015.06.152147
- APHA. (2005). Standard methods for the examination of water and wastewater (21st ed.). American Public Health Association.
- Asha, K. (1998). A pollution challenge. Frontline, The Hindu, 15 (13),(June 20-July 3).
- BIS. (2003). Indian standards specification for drinking water 15: 10500. Bureau of Indian Standards.
- CGWB. (2008). District groundwater brochure, Karur district, Tamil Nadu. Central Ground Water Board.
- Gao, H., Sun, Y., Zhou, J., Xu, R., & Duan, H. (2013). Mussel-inspired synthesis of polydopamine-functionalized graphene hydrogel as reusable adsorbents for water purification. ACS Applied Materials & Interfaces, 5(2), 425–432. https://doi.org/10.1021/am302500v
- Hua, M., Zhang, S., Pan, B., Zhang, W., Lv, L., & Zhang, Q. (2012). Heavy metal removal from water/wastewater by nanosized metal oxides: A review. Journal of Hazardous Materials, 211-212, 317–331. https://doi.org/10.1016/j.jhazmat.2011.10.016
- Hummers, W. S., & Offeman, R. E. (1958). Preparation of graphite oxide. Journal of American Chemical Society, 80(6), 1339. https://doi.org/10.1021/ja01539a017
- Langenegger, O. (1990). Ground water quality in rural areas of western Africa, UNDP project INT/81/026: 10.
- Loganathan, K., & Jafar Ahamed, A. (2017). Multivariate statistical techniques for the evaluation of groundwater quality of Amaravathi River basin: South India. Applied Water Science, 7(8), 4633–4649. https://doi.org/10.1007/s13201-017-0627-0
- Raja, G., & Venkatesan, P. (2010). Assessment of groundwater pollution and its impact in and around Punnam area of Karur District, Tamilnadu, India. E-Journal of Chemistry, 7(2), 473–478. https://doi.org/10.1155/2010/782134
- Rajamanickam, R., & Nagan, S. (2010). Groundwater quality modeling of Amaravathi River basin of Karur District, Tamilnadu, using visual modflow. International Journal of Environmental Science, 1(1), 91–108. http://www.ipublishing.co.in/jesvol1no12010/EIJES1010.pdf
- Renganathan, L. (2014, January 13). Water table plummets to new low in Karur. The Hindu. http://www.thehindu.com
- Santos, C., Lucas, M. S., Dias, A. A., Bezerra, R. M. F., Peres, J. A., & Sampaio, A. (2014). Winery wastewater treatment by combination of Cryptococcus laurentii and Fenton’s reagent. Chemosphere, 117, 53–58. https://doi.org/10.1016/j.chemosphere.2014.05.083
- Sharma, Y. C., Srivastava, V., Singh, V. K., Kaul, S. N., & Weng, C. H. (2009). Nano-adsorbents for the removal of metallic pollutants from water and wastewater. Environmental Technology, 30(6), 583–609. https://doi.org/10.1080/09593330902838080
- Shrivastava, K. B. L., & Mishra, S. P. (2011). Studies of various heavy metal in surface and ground water of Birsinghpur Town and its surrounding rural area district Satna (M.P.). Current World Environment, 6(2), 271–274. https://doi.org/10.12944/CWE.6.2.10
- Sivakumar, K. K., Balamurugan, C., Ramakrishnan, D., & Leena Hebsibai, L. (2011). Studies on physicochemical analysis of groundwater in Amaravathi River basin at Karur (Tamil Nadu), India. Water R & D, 1(1), 36–39. https://www.cabdirect.org/globalhealth/abstract/20113317024
- Suchitra, M. (2014). Farmers affected by Karur’s dye industry to exercise NOTA. News-Down to Earth. http://www.downtoearth.org.in/content
- Sultanaa, N., Akiba, S., & Ashraf, M. A. (2017). Thermal comfort and runoff water quality performance on green roofs in tropical conditions. Geology, Ecology and Landscapes, 1(1), 47–55. https://doi.org/10.1080/24749508.2017.1301058
- Thirugnanasambandham, K., Sivakumar, V., Loganathan, K., Jayakumar, R., & Shine, K. (2016). Pilot scale evaluation of feasibility of reuse of wine industry wastewater using reverse osmosis system: Modeling and optimization. Desalination and Water Treatment, 57(53), 25358–25368. https://doi.org/10.1080/19443994.2016.1154894
- Trivedy, R. K., & Goel, P. K. (1986). Chemical and Biological methods for water pollution studies. Environmental publication.
- WHO. (1977). Environmental health criteria. World Health Organization.
- WHO. (2005). International standards for drinking water. World Health Organization.
- Wu, W., Yang, Y., Zhou, H., Ye, T., Huang, Z., Liu, R., & Kuang, Y. (2013). Highly efficient removal of Cu(II) from aqueous solution by using graphene oxide. Water, Air, Soil and Pollution, 224(1), 1372–1379. https://doi.org/10.1007/s11270-012-1372-5
- Xu, G., Wang, N., Wei, J., Lv, L., Zhang, J., Chen, Z., & Xu, Q. (2012). Preparation of Graphene oxide/polyaniline nanocomposite with assistance of super critical carbon dioxide for super capacitor electrodes. Industrial & Engineering Chemistry Research, 51(44), 14390–14398. https://doi.org/10.1021/ie301734f
- Zhou, G., Wang, D. W., Yin, L. C., Li, N., Li, F., & Cheng, H. M. (2012). Oxygen bridges between NiO nanosheets and graphene for improvement of Lithium storage. ACS Nano, 6(4), 3214–3223. https://doi.org/10.1021/nn300098m