
 ?Mathematical formulae have been encoded as MathML and are displayed in this HTML version using MathJax in order to improve their display. Uncheck the box to turn MathJax off. This feature requires Javascript. Click on a formula to zoom.
ABSTRACT
One of the reasons for humans not being actively involved in protecting natural landscapes from the wave of pressures to which they are exposed is the ground-based image that sends to people a wrong illusion that nature is very large and unlimited, with inexhaustible resources. This study focused on National Parks (NPs), considered as one of the last refuges of wildlife on earth, yet overlooked by various Land Use & Land Cover (LULC) assessments. The study uses Landsat images and mapping approach to capture the most significant LULC changes that happened between 1985 and 2015 on five Big Scale African NP (BSANP), quantify their spatial extent and identify their level of human intrusion. The results show that NPs in desert regions, Banc d’Arguin NP and Namib Naukluft NP recorded a slight change in LULC. An increase of 18 and 8.3% in burned areas were, respectively, recorded in Manovo-Gounda-Saint Floris NP and Southern NP. The annual growth of 0.76% in green LULC for Random NP is a sign that there is still some hope for conservation in Africa. Our results show that Africa’s PAs are severely affected by human activities and that it is high time to come to their rescue before it’s too late. Tracking the fluctuations in LULC due to human intrusion into NPs is a reliable strategy to ensure their sustainable conservation.
1 Introduction
Quantifying and monitoring the spatial and temporal dynamics of the earth’s surface Land Use and Land Cover (LULC) is a critical environmental challenge that society must address. Such dynamic forces are key determinants of ecosystem vulnerability and global environmental change with potential severe impacts on human livelihoods and global economy (Guzha et al., Citation2018). In cycle-like process, a series of major “natural” and “man-made” disturbances on natural LULC, such as drought, floods, landslides, urbanization, population migration, conversions of natural land into arable land, etc. are identified as major drivers of LULC change. These changes take place temporally at different times (few weeks or many years), and spatially at different area extent (Small-area or large-scale) with different land use intensity, but the long-term changes are the most useful for evaluating the sustainability of natural resources (Matlhodi et al., Citation2019). Human pressures on the environment are activities undertaken by humans that can likely damage nature (Venter et al., Citation2016a). Vegetation removal due to human activities commonly leaves the soil susceptible to massive undesirable effects on ecosystems: wildlife habitat destruction, piercing historical wildlife migration corridors, soil erosion by wind and water, soil and air pollution, increase water turbidity, eutrophication and coastal hypoxia, etc. (Anaba et al., Citation2017) (Allan et al., Citation2017) (Roques et al., Citation2001) (Mora, Citation2008). The current human consumption of natural resources has exceeded the global carrying capacity and lead to the depletion of the global natural resource stocks in a way that compromises the ability of future generations to meet their own needs (Simpson et al., Citation2000).
In response to the challenges of biodiversity loss and increasing severe damage to the global environment, Protected Areas (PAs) were created as a commitment by nations, peoples, groups and individuals to safeguard areas of land and sea from destruction and defined them as “Clearly defined geographical spaces, recognized, dedicated and managed, through legal or other effective means, to achieve the long-term conservation of nature with associated ecosystem services and cultural values” (Ángeles et al., Citation2019). National Parks (NPs) are classified as the category II of the VI management categories of PAs made by the International Union for Conservation of Nature (IUCN) and are the most emblematic type in Africa (Muhumuza & Balkwill, Citation2013), their mission implies (a) the protection of the ecological integrity of ecosystems for present and future generations, and (b) the provision of space for environmental education and nature-based tourism activities (Ángeles et al., Citation2019) (Miller-Rushing et al., Citation2017). African NPs were established on the continent currently with 1.3 billion (17%) of the world’s population and on which an additional 2.2 billion people are expected by the year 2050 (UN, Citation2017). In addition, the number of people from all over the world seeking recreational opportunities increases as the world gets more industrialized (Chongwa, Citation2012). Africa is characterized by a relatively small number of PA (3.3% of the total number) but its sites are generally much larger and in total cover 13.8% of the global area protected (Deguignet et al., Citation2014). Given the current observations, global climate change is generally suspected to have had a substantial impact on many natural ecosystems (Gao et al., Citation2016); however, many researchers have also attributed human activities such as agriculture, over-grazing and tree cutting to the natural green cover depletion and even to desertification (Zhou et al., Citation2014) (Lyu et al., Citation2016) (Eisner et al., Citation2016). Despite increasing evidence of prehistoric and historical human disturbance on natural environment, major questions remain concerning the extent of the current unprecedented wildlife crisis especially in PA and measures to permit its recovery (Foster et al., Citation1999).
Over the last decades Africa has been subjected to a series of major losses of its natural ecosystems caused by environmental change and, particularly, LULC changes related to urbanization and agriculture, two major drivers of biodiversity loss globally (Akinyemi, Citation2017). An increased exposure to hydro-climatic extremes that have affected different parts of the continent is an earlier reminder of the effects of LULC change on water resources and social-ecological system (Näschen et al., Citation2019). Several studies investigated and quantified LULC change to better understand many of the continent’s land surface and climatic processes but most of these efforts have been limited to local-scale investigation due to the computational requirements of analyzing large volumes of data, even then rarely dared to break through the boundaries of African PAs to monitor the dynamics of their LULC, yet such studies are highly required in the regions of ecological importance and biodiversity hubs as they are supposed to serve as the last line of defense in the fight to slow down species extinctions (Akinyemi, Citation2017). So far, growing concerns ranging from ecological and economical ineffectiveness of NPs, to NPs fragmentation, isolation, and degazettement have been reported in different parts of Africa (Santini et al., Citation2016). In addition, the lack of high spatial resolution data has discouraged many initiatives that have attempted to generate global to continental scale LULC maps, especially if spanned over a long period of time (Midekisa et al., Citation2017). Thankfully, the USGS release of Landsat data archive for public use since 2008 coupled with the availability of new high-performance computing platforms enabled this study to gather large volumes of data and process them at continental level to assess at periodical intervals, spatial and temporal LULC dynamics with the focus on large-scale African NPs. High resolution satellite images with pixel resolution of less than 30 m, are equipped with full potential to provide the required precision to map LULC changes at landscape level (Brink & Eva, Citation2009) (Chen et al., Citation2014). Landsat images have been used the most for determining forest cover and measuring forest cover change (Castillo et al., Citation2015) (Devaney et al., Citation2015). Remote sensing offers an alternative technic to the ground-based survey for LULC change analysis (Liu & Yang, Citation2015). The satellite-based earth observation offers a modern tool and unparalleled technique to gather information on physical characteristics of earth systems. Different bands of multispectral imagery are produced by imaging sensors aboard satellites. When viewed separately, a single band looks like a black and white photograph, when illuminated successively by RGB (Red, Green, Blue) color light, these bands can be combined to create color pictures used to identify features of interest on the ground (Horning, Citation2004). The perceptual organization of observed on satellite images is based on mathematical values commonly called hexadecimal color values. Knowing that white light can be decomposed into a color spectrum, it becomes logical and obvious that the reverse process can be realizable. (Bendito, Citation2005) (Jehlicka, Citation2012).
This work attempts to quantify and scrutinize habitat loss via climatic change and anthropogenic intrusions into African NP already known to be important drivers of biodiversity loss (Jacobson et al., Citation2015) (Harris et al., Citation2014) (Chown et al., Citation2003). The specific objectives of this study are: (a). Identify and map key LULC classes, (b). Analyze LULC changes over a 30-year period, (c). Identify the drivers of the observed changes, (d). Make recommendations minimize the negative impacts of LULC change. Since the situation of this study is replicated in several other similar and mostly smaller locations on the continent, the methods and conclusions can be relevant to state governments, conservation organizations, and future researchers who need to base their policies and decisions on sufficient and reliable information to ensure the efficiency and sustainability of natural resources use (Sader & Winne, Citation1992). Changes on NP landscape have generally the characteristics of large-scale and long-term space-time evolution and are apparently difficult to quantify; fortunately, today’s available earth observation technology has the characteristics of macroscopic, dynamic, fast and accurate detection ability which makes it the most convenient tool to reveal the mysteries of land-based changes that have slowly, silently and even in the dark altered the entire or part of the landscape over a long time period. Remote sensing has many advantages when mapping and monitoring the Earth’s surface, such as providing up to date, cheaper and more dynamic information for many applications including physical environmental data (DEM, slope, aspect), biological factor data (plant species distribution, distance to drainage), human disturbance data (road, hydroelectric stations, mines, scenic spots, etc.). Remote sensing assessment methodology is widely used for vegetation mapping, and natural resource assessment.
2 Methods
2.1 Big Scale African National Parks
The present study was conducted on Big Scale African National Parks (BSANP) data of which were obtained from the World Database on Protected Areas (WDPA) the most comprehensive global database on terrestrial and marine protected areas internationally recognized as the major tool that keeps up-to-date information on PA (UNEP-WCMC, Citation2017). The data can be accessed from Protected Area Profile for Africa from the World Database of Protected Areas, available at: www.protectedplanet.net
As of January 2021, the WDPA keeps a record of 8562 PAs on African continent; given the complexity and abundance of PAs in Africa, a systematically selected sample was chosen to represent the BSANP on which this research was conducted. The selection criteria included:
Belonging to the 2015 United Nations List of Protected Areas, data based on the WDPA October release
Region: Africa
Designation: Either of Forest Reserve, Nature Reserve, National Park, Game Reserve, Marine Protected Area
IUCN Category: II
Status: Designated
Area: Greater or equal to (≥) 5000 km2
Note, however, that the names of the categories used by IUCN do not necessarily reflect the names used at national or sub-national levels. For consistency, the term “National Park” was used in this research to denote all PA as stipulated by IUCN to denote its Category II.
The selection yielded 45 BSANP fulfilling the above criteria, of which the name, country, area [km2], establishment date and geographical coordinates [latitudeand longitude] were clarified. Considering the challenge of handling the large amount of data required to cover all the BSANP, a sample of five BSANP with each one being the largest representing a specific part of the continent (Central, North, South, East and West) was chosen. The introduces the five BSANP on which the research was conducted:
Table 1. List of BSANP their establishment date, area and geographic position.
2.2 Operational classification of BSANP’s LULC
The use of multiple-date imagery for LULC mapping is becoming more common but remains a complex task which requires a substantive level of organization and coordination as computer storage and processing capacities are often challenged by spectral large data associated with increased number of bands (Prince et al., Citation2012). Fortunately, petabyte-scale archives of remote sensing data have become freely available for the public from multiple U.S. Government agencies (Gorelick et al., Citation2017). We downloaded 60 satellite images from the U.S. Geological Survey Earth Explorer (EE), tool that gives users the ability to query, search, and order satellite images, aerial photographs, and cartographic products from several sources. 2/3 of the used images were taken by Landsat 5 and 1/3 of images was taken by Landsat 8. Our date range was from 01/01/1985 up to 31/12/1985; from 01/01/2000 up to 31/12/2000 and from 01/01/2015 up to 31/12/2015. For each site we carefully selected images taken within the same month so as to compare situations of the same season of the year. Images with less than 10% of cloud cover were preferred. All the images were subtracted from the following address:
Manovo-Gounda-Saint Floris NP: Path 179 Row 53; Path 179 Row 54; Path 180 Row 53, Path 180 Row 54.
Banc d’Arguin NP: Path 205 Row 046; Path 205 Row 047; Path 206 Row 046; Path 206 Row 047.
Namib-Naukluft NP: Path 178 Row 076; Path 178 Row 077; Path 178 Row 078; Path 179 Row 076; Path 179 Row 077; Path 179 Row 078.
Southern NP: Path 174 Row 55; Path 174 Row 56; Path 175 Row 55; Path 175 Row 56.
Radom NP: Path 178 Row 53; Path 178 Row 54.
Landsat 5 was equipped with Multispectral Scanner System (MSS) sensor for 1985 images and Thematic Mapper (TM) sensor for 2000 images, Landsat 8 was equipped with Operational Land Imager and Thermal Infrared Sensor (OLI TIRS) for 2015 images. The reason for choosing Landsat is its longest history as it was launched in 1972. The TM sensor, have then been added from Landsat 4 (1982–1993), Landsat 5 (1984–2013), Landsat 6 (1993, launch failed), Landsat 7 (1999-Still active) and the most recent Landsat 8 (2013-Still active) (Kennedy et al., Citation2007) (Xie et al., Citation2008).
2.3 Radiometric and Atmospheric calibration
Satellite images are contaminated by various radiative processes, hence their obvious correction process. During this process, raw data images are either restored, rectified or their quality is enhanced for better interpretation. Distortions caused by the Earth’s rotation and camera angles are eliminated. We used a processing software to correct all the downloaded images that used the following formula to perform the atmospheric corrections.
Ltot = radiance measured by sensor
ρ = reflectance of the target
E = irradiance on the target
T = transmissivity of the atmosphere
Lp = path radiance (radiance due to atmosphere)
2.4 Analysis of LULC change on BSANP
The LULC change in BSANP natural environment was tracked in one 30 years interval, and two 15 years sub-intervals. LULC state on BSANP was studied at three different dates 1985, 2000 and 2015. To assess the state of LULC on the single BSANP at a given period, satellite images of the same year and covering the same NP were combined (mosaic) and a subset of the study area was retrieved according to the official NP boundary shapefile accessed from the WDPA database. The subset image was taken to the unsupervised classification. This stage requires a level of familiarity with remote sensing as primary color lights are used to illuminate different bands to enable detection of features hardly recognizable without appropriate band combination adjustments. Here are some of the frequently used band combinations throughout this research: For Landsat MSS images, the combination Red = band3, Green = band2, Blue = band1. This combination includes the visible red band channel (band 3: 0.63–0.69 m), was used to detect different types of vegetation, though not very apparent as the data did not have a mid-infrared band. For TM images, the combination Red = band4, Green = band3, Blue = band2. This combination includes the near infrared channel (band 4: 0.76–0.90 m) which makes vegetation monitoring easy and land water boundaries more apparent. For OLI-TIRS images: Red = band5, Green = band4; Blue = band3; this combination includes the mid-infrared (band 5: 1.55–1.75 m) which is very sensitive to moisture and is therefore used to monitor vegetation.
In this type of classification, the image processing software is given guidance by the operator to specify the LULC classes of interest. The number of classes was previously set as approximately twice as the required number of classes. The obtained classes in excess were later combined to obtain the real representation of BSANP’s state of LULC at a given time. This research integrated different types of LULC into 9 classes: Forest, Shrub, Grass, Water, Bedrock, Sand strips, Sand dunes, Burned area, and Bare land. By confronting three produced images with the image analysis tool, the change between the two layers was computed at three different periods by apply pixel over pixel comparison, then for each BSANP, produced two different maps displaying the level of occurred changes over equal periods of time (15 years), and a third map displaying the level of occurred changes over 30 years period. The former two images provide a comparison between changes over equal period of time, while the latter elucidates the level of occurred changes over the 30 years period. The the cumulative impact of human activities on BSANP natural environment that refers to the sum up of isolated impacts that has created scars on natural landscape through human intrusion into BSANP was measured, and used the globally-standardized measure commonly known as human footprint (Allan et al., Citation2017) (Sanderson et al., Citation2002) (Venter et al., Citation2016a) (M.C. Hansen et al., Citation2013).
3 Results
3.1 LULC maps for each BSANP
The LULC classification was conducted on basis of subset images covering Manovo-Gounda-Saint Floris NP, Banc d’Arguin NP, Namib Naukluft NP, Southern NP and Radom NP. On one hand, the classification grouped LULC into approximatively 6 main classes of LULC (Forest/Dense vegetation, Shrub, Grass, Bare land, Burned land and water) in Manovo-Gounda-Saint Floris NP, Southern NP and Radom NP. On the other hand, the LULC classification for Banc d’Arguin and Namib Naukluft was grouped into 5 main classes (water, bed rock, sand strips and sand dunes). The following maps represent the 30 years evolution of LULC over the 5 BSANP. The LULC maps contain visual information about the extent of each LULC class over each BSANP. The table of content behind the visual information contains numerical values that can be used to compute the amount and portion of each LULC class at a given time period. The contain the visual information about the state of various BSANP, while in section 3.2 indicate the quantitative value of each class and its share (in percentage) compared to the total area of the BSANP.
Figure 1. The LULC classes for Manovo-Gounda-Saint Floris NP based on 30 mx 30 m imagery.
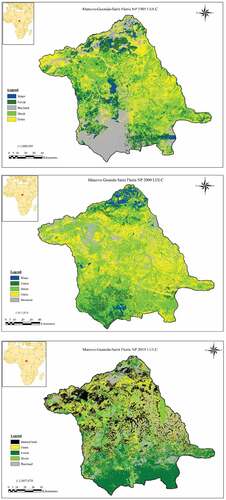
Figure 2. The LULC classes for Banc d’Arguin NP based on 30 mx 30 m imagery.
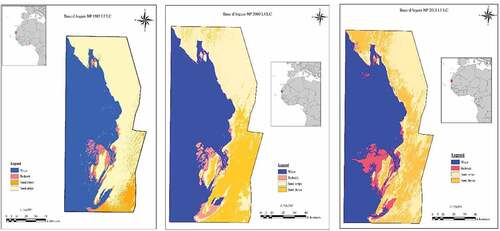
Figure 3. The LULC classes for Namib-Naukluft NP based on 30mx 30 m imagery.
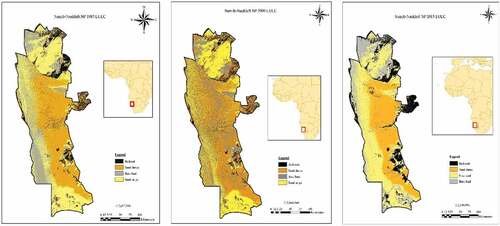
Figure 4. The LULC classes for Southern NP based on 30mx 30 m imagery.
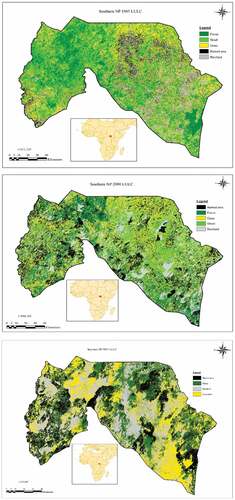
Figure 5. The LULC classes for Random NP based on 30mx 30 m imagery.
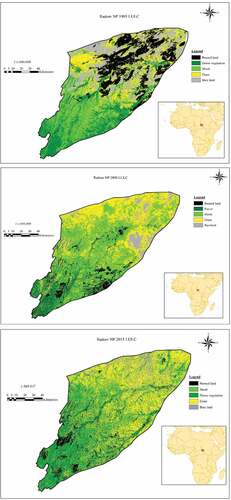
Table 2. The LULC class numerical value and portion for Manovo-Gounda-Saint Floris NP.
Table 3. The LULC class numerical value and portion for Banc d’Arguin NP.
Table 4. The LULC class numerical value and portion for Namib Naukluft NP.
Table 5. The LULC class numerical value and portion for Southern NP.
Table 6. The LULC class numerical value and portion for Radom NP.
3.2 LULC class numerical value and portion for BSANP
The following tables contain the LULC class covered area (in square kilometers) and portion (in percentages) for the 5 BSANP at three different time period, which can also be translated into the trend of each LULC class change over a 30 years period (1985–2015).
4 Discussions
4.1 Pixel over pixel comparison
The fluctuations that have occurred on BSANP’S LULC between 2000 and 1985, 2015 and 2000 as well as the ones that occurred over the last 30 years (between 2015 and 1985) can be appreciated by looking at LULC change maps that were produced by confronting two selected layers and computing the variations using pixel over pixel comparison. The indicate with slightly different scores, regional level of change from “Not affected”, “Mildly affected”, “Moderately affected”, to “Highly affected”. Note however that the occurred change can either be destructive, restorative, or constructive to BSANP’s natural landscape. It hence requires a further interpretation to know the nature of the occurred change and the drivers of the change.
Figure 6. Pixel over pixel comparison over Manovo-Gounda-Saint Floris NP.
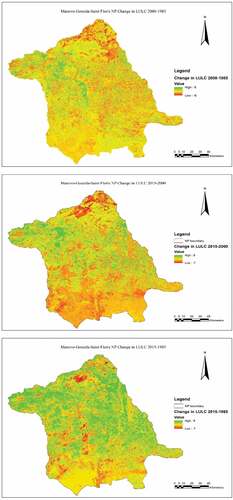
Figure 7. Pixel over pixel comparison over Banc d’Arguin NP.
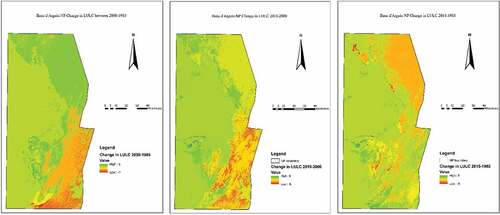
Figure 8. Pixel over pixel comparison over Namib Naukluft NP.
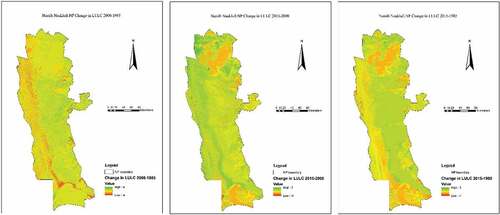
Figure 9. Pixel over pixel comparison over Southern NP.
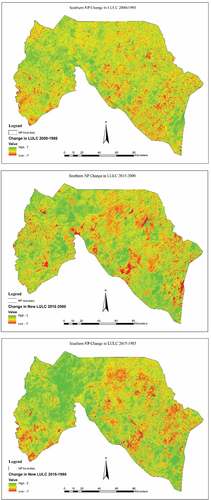
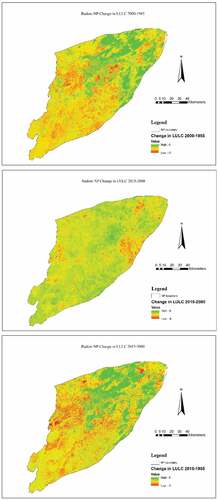
Figure 10. Pixel over pixel comparison over Random NP.
The fluctuations maps show a generalized Moderate change with in Manovo-Gounda-Saint Floris NP LULC between 2000 and 1985, localized High change between 2015 and 2000, the combination of which has resulted in localized High change between 2015 and 1985.
Banc d’Arguin NP LULC shows no remarkable changes at the sea side during all the three phases, Mild to Moderate changes on land but excessive changes seem to have occurred on isolated locations along the separation line between water and land.
The fluctuations maps show a generalized No to Mild change in Namib Naukluft NP LULC for all the three time intervals.
The fluctuations maps show general Moderate to High LULC changes over isolated and scattered locations of Southern NP.
The fluctuation maps apparently show the same LULC changes over the two-time intervals (2000–1985 and 2015–1985) in Random NP created only 5 years before the beginning of the first interval.
4.2 LULC class changes over the BSANP
Although climate change counts among the important factors influencing the spatial variation in the green LULC (Jing Wang et al., Citation2015), the analysis of Landsat images in different times offer a strong tool that not only include climatic change but also embrace other destructive factors such as the human impact into the computation of environmental degradation. The visual information supplied by pixel over pixel comparison maps is enriched by LULC class proportions to as an additional tool to help the interpretation of what happened to the studied BSANP during the last 30 years (2015–1985) and predict the trend of each LULC class, as shown on .
Figure 11. LULC class proportions and trend over Manovo-Gounda-Saint Floris NP.
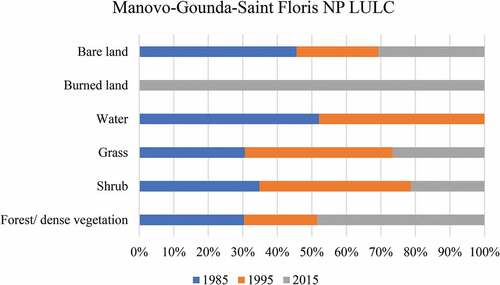
Figure 12. LULC class proportions and trend over Banc d’Arguin NP.
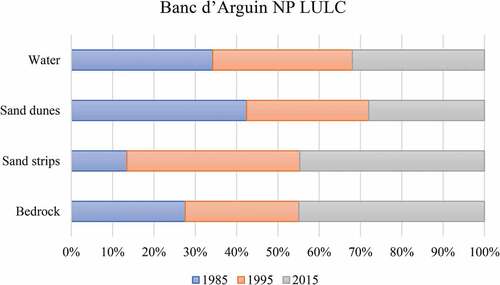
Figure 13. LULC class proportions and trend over Namib Naukluft NP.
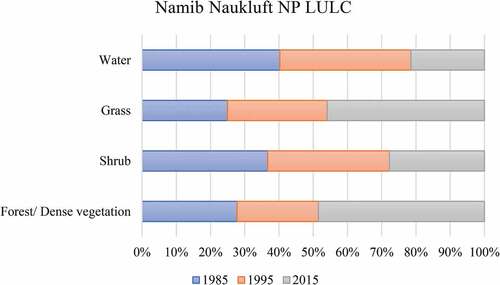
Figure 14. LULC class proportions and trend over Southern NP.
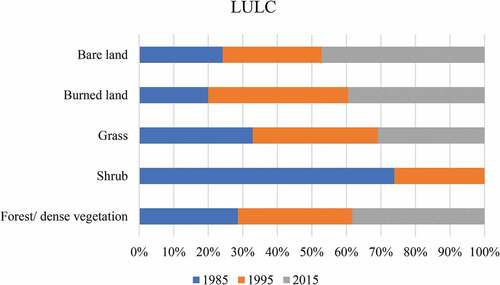
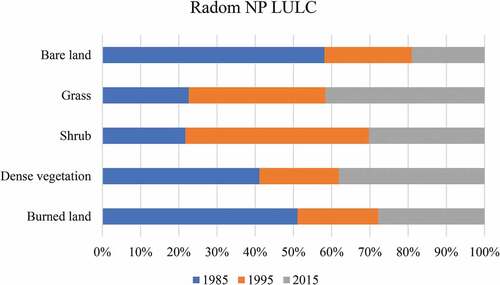
Figure 15. LULC class proportions and trend over Random NP.
4.3 Reasons of LULC changes over the BSANP
For Manovo-Gounda-Saint Floris NP, excessive changes in LULC that have been mentioned were mainly due to the burned area that have expanded on 19% of the NP entire area at the expense of shrub and grass which moreover seemed to expand more and more on larger areas. The fire is set by human activities willingly or accidentally. Most of the time individuals are attracted by the short-term beneficial effects of fire on flora since it causes the early and abundant production of young leaves for fauna, thus completing the food supply, on medium and long term however fires have depressive effects on protected species in general (Yameogo, Citation2005). Compared to similar studies, our results seem promising for Manovo-Gounda-Saint Floris NP though a 4.41% (>1.2% measured by Sandoval et al. during nearly the same period 1986–1995) deforestation was recorded, a reforestation has regained the field and extended on 8.75% beyond the 1985 situation during the following 30 years (6.8% deforestation in the case of Sandoval between 1995–2000). (Sandoval et al., Citation2007).
A generalized Mild to No change situation in Banc d’Arguin NP and Namib Naukluft NP is explained by the fact that they are parks in desert regions, the slight changes that have occurred were mostly caused by the effects of wind and water that from time to time moved sand from a place to another. For Banc d’Arguin NP new human settlements were detected near the southern border and other isolated regions along the separation line between land and water which explains the High-level change in small and isolated locations of its landscape. Contrary to conventional wisdom, the human settlements in that desert regions seem to have sustained the rare but growing green cover through agricultural activities around them. Paradoxically, our results still get along with previous researches that agricultural practices and urbanization coverage are the main cause of the degradation of natural landcover (Temudo & Silva, Citation2011) (Eisner et al., Citation2016) (Ouedraogo et al., Citation2010).
Excessive changes that have mostly invaded the west and south east of the Southern NP are mainly explained by the increased bush fire and bare land. makes it clear that the regions covered with shrub were the highly affected especially during the 2015–2000 time period. The park has lost 22.11% (0.7% annually) of its green cover during the last 30 years. Nevertheless, the park gained 7.18% in forest cover during the last 30 years, this value is slightly lower than an annual increase of 0.66% of forest increase within protected areas in Africa that was reported for 2015 (FAO, Citation2016). Let’s again note that African tropical region was reported to have the lowest Gross Forest Cover Loss (0.4%) due to the lower use of forests for commercial development compared to other tropical regions (Matthew C. Hansen et al., Citation2010).
Scars of excessive changes that appear on Random NP maps are mainly due to the scars of burned land that were still visible into its landscape even some years after its establishment as a NP in 1980. The gains in all green cover types reached 22.9% (0.76% annually) and a reduction in bare land and burned area infer a great achievement of conservation especially during the time in which many other African reserves are increasingly being affected by habitat loss due to human activities (Newmark, Citation2008). Conservation through the developing word recognizes that natural areas need to be protected from certain forms of human use (King, Citation2007), the park seems to have succeeded to drive away people responsible of setting fire on the park, and indeed NP plays an important role in countering green cover decline (Sanchez-Azofeifa et al., Citation2002). However, further negative causes can also better explain the green cover prosperity, as an example, animal populations are declining not only in disturbed habitat but also in NP (Chapman et al., Citation2010).
4.4 Evidences of human causes of BSANP’s LULC changes
While the previous sections of this study focused on identifying and quantifying habitat loss caused by the combined effect of climatic change and anthropogenic intrusions into the BSANP, it is important to highlight that most of the drivers of LULC change such as farmlands, human settlements, linear infrastructures are exclusively human related. Though lightning can also cause bush fire, such cases are extremely rare (Trollope & Trollope, Citation2004); hence, we consider human to also be responsible for igniting fire on BSANP. Note, however, that the combination of warmer and drier conditions makes the forest much more susceptible to fire (Kilungu et al., Citation2019), which shows how much human and climatic changes are intertwined and amalgamated. To make things worse, the socio-political environment around BSANP has played a vital role in shaping the past, present and future of the parks (Apio et al., Citation2017). The war also had implications on law enforcement in Manovo-Gounda-Saint Floris NP and Southern NP, leading to the lack of protection activities and loss of wildlife which better explain the catastrophic situation of these two PAs, respectively, in Central African Republic and South Sudan both countries ravaged by long wars. The presented results contain another category of features whose change can be caused by either type of drivers. Forest loss can either result from human activity, desertification, global warming, etc. In the same way, bare land increase can result from many and unspecific factors such as human activity, desertification, global warming, etc. Nevertheless, whatever the cause, the precarious green cover further deteriorates as climatic change continues. In our analysis, we have observed that human intrusions have the characteristics of brutal, isolated, random, and limited in time while climatic change causes are rather silent, large scale, continuous, and rather long-term process. We have also observed that the threat to BSANP natural landscape is generally brought by a small group of selfish people but there is a shared responsibility to indirectly contribute to its devastation by turning a blind eye to the PA in danger. Even countries that have an obligation to monitor the changes in PAs to meet international reporting commitments fail to do it and the change quantification is rarely done (Devaney et al., Citation2015). This study comes as a reminder of humankind’s responsibility to live in harmony with nature.
5 Conclusions
To move beyond myths and suppositions about the extent, cause and effects of human pressure on PA in Africa, this research labored in time and space on satellite imagery covering sampled BSANP. Using the band combination theory coupled with primary colors, we visualized features on ground at 3 different time periods extending on 30 years interval. On one hand, we detected and measured scars resulting from direct human intrusion into BSANP and, on the other hand, studied the temporal trends of landscape elements to establish the relationship between scars obviously left behind by human intrusion into PA (agricultural activities, human settlements, linear infrastructure and bush fire) and damage found on landscape elements (forest cover, shrub, grass, bare land, sand dunes, bedrock and water). This research echoed the conclusions of other studies [e.g., (Allan et al., Citation2017), (FAO, Citation2016), (Estes, Kuemmerle, Kushnir, Radeloff, & Shugart, Citation2012), (Gimmi, et al., Citation2011)] and stressed that BSANP are indeed threatened by human pressure and forest loss. The study supplied necessary metrics to analyze not only temporal human pressure trends but also the temporal trends of landscape elements. This study supplied data and offers the opportunity to act at restoring damaged PA as some BSANP head to dangerous thresholds where the NP will be difficult to recover.
Acknowledgements
The authors would like to thank scientists and practitioners whose expertise advice and critique inspired the development of this work. Special thanks to Professor Robert Melnick from Oregon University and Dr. Hassan Mohammed Abdelmanan for your assistance.
Disclosure statement
No potential conflict of interest was reported by the author(s).
Additional information
Funding
References
- Akinyemi, F. O. (2017). Land change in the central Albertine rift: Insights from analysis and mapping of land use-land cover change in north-western Rwanda. Applied Geography, 87, 127–138. http://dx.doi.org/10.1016/j.apgeog.2017.07.016
- Allan, J. R., Venter, O., Maxwell, S., Bertzky, B., Jones, K., Shi, Y., & Watson, J. E. M. (2017). Recent increases in human pressure and forest loss threaten many Natural World Heritage Sites. Biological Conservation, 206, 47–55. https://doi.org/10.1016/j.biocon.2016.12.011
- Anaba, L. A., Banadda, N., Kiggundu, N., Wanyama, J., Engel, B., & Moriasi, D. (2017). Application of SWAT to assess the effects of land use change in the Murchison bay catchment in Uganda. Computational Water Energy and Environmental Engineering, 6(1), 24–40. https://doi.org/10.4236/cweee.2017.61003
- Ángeles, O.-G. M., Vega-Vázquez, M., Castellanos-Verdugo, M., & Francisco, O.-A. (2019). Tourism in protected areas and the impact of servicescape on tourist satisfaction, key in sustainability. Journal of Destination Marketing & Management, 12, 74–83. https://doi.org/10.1016/j.jdmm.2019.02.005
- Apio, A., Plath, M., & Wronski, T. (2017). Recovery of ungulate populations in post-civil war Akagera National Park, Rwanda. Journal of East African Natural History, 104(No. 1&2), 127–141. https://doi.org/10.2982/028.104.0110
- Bendito, P. 2005. “RGB Colour palette based on hue relationships“. Proceedings of the 10th Congress of the International Colour Association (Part 2). Granada, Spain. pp. 1187–1190.
- Brink, A. B., & Eva, H. D. (2009). Monitoring 25 years of land cover change dynamics in Africa: A sample based remote sensing approach. Applied Geography (Elsevier), 29(4), 501–512. https://doi.org/10.1016/j.apgeog.2008.10.004
- Castillo, E. M. D., Martin, A. G., Aladren, L. A. L., & De Luis, M. (2015). Evaluation of forest cover change using remote sensing techniques and landscape metrics in Moncayo Natural Park (Spain). Applied Geography (Elsevier), 62, 247–255. http://dx.doi.org/10.1016/j.apgeog.2015.05.002
- Chapman, C. A., Struhsaker, T. T., Skorupa, J. P., Snaith, T. V., & Rothman, J. M. (2010). Understanding long-term primate community dynamics: Implications of forest change. Ecological Applications (Ecological Society of America), 20(1), 179–191. https://doi.org/10.1890/09-0128.1
- Chen, J., Chen, J., Liao, A., Cao, X., Chen, L., Chen, X., Chaoying, H.,Han, G., Peng, S., Lu, M., Zhang, W., Tong, X., Mills, J., (2014). Global land cover mapping at 30m resolution: A POK-based operational approach. ISPRS Journal of Photogrammetry and Remote Sensing (Elsevier Ltd). xxx: xxx-xxx. http://dx.doi.org/10.1016/j.isprsjprs.2014.09.002
- Chongwa, M. B. (2012). The history and evolution of national parks in Kenya. The George Wright Forum (The George Wright Society), 29(1), 39–42. http://www.georgewright.org/291chongwa.pdf
- Chown, S. L., Van Rensburg, B. J., Gaston, K. J., Ana, S. L. R., & Van Jaarsveld, A. S. (2003). Energy, species richness, and human population size: Conservation implications at a national scale. Ecological Applications (Ecological Society of America), 13(5), 1233–1241. https://doi.org/10.1890/02-5105
- Deguignet, M., Juffe-Bignoli, D., Harrison, J., MacSharry, B., Burgess, N. D., & Kingston, N. (2014). United Nations List of Protected Areas. UNEP-WCMC.
- Devaney, J. L., Redmond, J. J., & John, O. (2015). “Contemporary forest loss in Ireland. Quantifying Rare Deforestation Events in a Fragmented Forest Landscape”. Applied Geography (Elsevier Ltd.), 63, 346–356. http://dx.doi.org/10.1016/j.apgeog.2015.07.008
- Eisner, R., Seabrook, L. M., & McAlpine, C. A. (2016). Are changes in global oil production influencing the rate of deforestation and biodiversity loss? Biological Conservation (Elsevier), 196, 147–155. http://dx.doi.org/10.1016/j.biocon.2016.02.017
- Estes, A. B., Kuemmerle, T., Kushnir, H., Radeloff, V. C., & Shugart, H. H. (2012). Land-cover change and human population trends in the greater Serengeti ecosystem from 1984-2003. Biological Conservation (Elsevier), 147(1), 255–263. https://doi.org/10.1016/j.biocon.2012.01.010.
- FAO. 2016. “Global forest resources assessment 2015: How are the world’s forests changing?“ Food and Agriculture Organization of the United Nations, Rome.
- Foster, D. R., Fluet, M., & Boose, E. R. (1999). Human or natural disturbance: Landscpe-scale dynamics of the tropical forests of Puerto Rico. Ecological Applications (Ecological Society of America), 9(2), 555–572. https://doi.org/10.1890/1051-0761(1999)009[0555:HONDLS]2.0.CO;2
- Gao, Q., Guo, Y., Hongmei, X., Ganjurjav, H., Yue, L., Wan, Y., Qin, X., Xin, M., & Liu, S. (2016). Climate change and its impacts on vegetation distribution and net primary productivity of the alpine ecosystem in the Qinghai-Tibetan Plateau. Science of the Total Environment (Elsevier), 554(555), 34–41. http://dx.doi.org/10.1016/j.scitotenv.2016.02.131
- Gimmi, U., Schmidt, S. L., Hawbaker, T. J., Alcantara, C., Gafvert, U., & Radeloff, V. C. (2011). Increasing development in the surroundings of US National Park Service holdings jeopardizes park effectivencess. Journal of Environmental Management (Elsevier Ltd.), 92, 229–239. https://doi.org/10.1016/j.jenvman.2010.09.006
- Gorelick, N., Hancher, M., Dixon, M., Ilyushchenko, S., Thau, D., & Moore, R. (2017). Google Earth Engine: Planetary-scale geospatial analysis for everyone. Remote Sensing of Environment, 202, 18–27. https://doi.org/10.1016/j.rse.2017.06.031
- Guzha, A. C., Rufino, M. C., Okoth, S., Jacobs, S., & Nóbrega, R. L. B. (2018). Impacts of land use and land cover change on surface runoff, discharge and low flows: Evidence from East Africa. Journal of Hydrology: Regional Studies, 15, 49–67. https://doi.org/10.1016/j.ejrh.2017.11.005
- Hansen, M. C., Stehman, S. V., & Potapov, P. V. (2010). Quantification of global gross forest cover loss. PNAS, 107(19), 8650–8655. www.pnas.org/cgi/doi/10.1073/pnas.0912668107
- Hansen, M. C., Potapov, P. V., Moore, R., Hancher, M., Turubanova, S. A., Tyukavina, A., Thau, D., et al. (2013). High-resolution global maps of 21st century forest cover change. Science Mag: 342(6160), 850–853. https://doi.org/10.1126/science.1244693
- Harris, A., Carr, A. S., & Dash, J. (2014). Remote sensing of vegetation cover dynamics and resilience across southern Africa. International Journal of Applied Earth Observation and Geoinformation, 28, 131–139. http://dx.doi.org/10.1016/j.jag.2013.11.014
- Horning, N. 2004. “Selecting the appropriate band combination for an RGB image using Landsat imagery Version 1.0“. Remote Sensing and Geographic Information Systems Facility, Center for Biodiversity and Conservation, American Museum of Natural History. http://biodiversityinformatics.amnh.org.
- Jacobson, A., Dhanota, J., Godfrey, J., Jacobson, H., Rossman, Z., Stanish, A., Walker, H., & Riggio, J. (2015). A novel approach to mapping land conversion using Google Earth with an application to East Africa. Environmental Modelling & Software (Elsevier), 72, 1–9. http://dx.doi.org/10.1016/j.envsoft.2015.06.011
- Jehlicka, V. (2012). Interdisciplinary relations in teaching of programming. Selected Topics in Applied Computing, 33–38. http://www.uhk.cz/pdf
- Kennedy, R. E., Cohen, W. B., & Schroeder, T. A. (2007). Trajectory based change detection for automated characterization of forest disturbance dynamics. Remote Sensing of Environment (Elsevier), 110(3), 370–386. https://doi.org/10.1016/j.rse.2007.03.010
- Kilungu, H., Leemans, R., Pantaleo, K. T., Munishi, S. N., & Amelung, B. (2019). Forty years of climate and land-cover change and its effects on tourism resources in Kilimanjaro National Park. Tourism Planning & Development (Taylor & Francis Group), 16(2), 235–253. https://doi.org/10.1080/21568316.2019.1569121
- King, B. H. (2007). “Conservation and community in the new South Africa. A Case Study of Mahushe Shongwe Game Reserve”. Geoforum (Elsevier), 38, 207–219. https://doi.org/10.1016/j.geoforum.2006.08.001
- Liu, T., & Yang, X. (2015). Monitoring land changes in an urban area using satellite imagery, GIS and landscape metrics. Applied Geography (Elsevier), 56(1) 42–54. http://dx.doi.org/10.1016/j.apgeog.2014.10.002
- Lyu, Y., Yang, Y., Guo, L., Liu, L., Shi, P., Zhang, G., Zhiqiang, Q.,Hu. X., Wang J., Xiong, Y., Wen, H., Lei, J., Bo L., Dai, J. (2016). Desertification and blown sand disaster in China. Journal of Agricultural Science and Technology A (David Publishing), 6, 363–371. https://doi.org/10.17265/2161-6256/2016.06.001
- Matlhodi, B., Kenabatho, P. K., Parida, B. P., & Maphanyane, J. G. (2019). Evaluating land use and land cover change in the Gaborone dam catchment, Botswana, from 1984–2015 using GIS and Remote Sensing. Sustainability (MDPI), 11(19), 5174. https://doi.org/10.3390/su11195174
- Midekisa, A. M., Felix Holl, D. J. S., Andrade-Pacheco, R., Gething, P. W., Bennett, A., Sturrock, H. J. W., & Sturrock, H. J. W. (2017). Mapping land cover change over continental Africa using Landsat and Google Earth Engine cloud computing. PLos ONE, 12(9), e0184926. 6. https://doi.org/10.1371/journal.pone.0184926
- Miller-Rushing, A. J., Primack, R. B., Keping, M., & Zhou, Z.-Q. (2017). “A Chinese approach to protected areas. A Case Study Comparison with the United States”. Biological Conservation (Elsevier), 210, 101–112. https://doi.org/10.1016/j.biocon.2016.05.022
- Mora, ca. 2008. “A clear human footprint in the coral reefs of the Caribbean“. Proceedings of the Royal Society B. Vol. 275(1636). 767–773. https://doi.org/10.1098/rspb.2007.1472.
- Muhumuza, M., & Balkwill, K. (2013). Factors affecting the success of conserving biodiversity in nationa parks: A review of case studies from Africa. Internationa Journal of Biodiversity (Hindawi Publishing Corporation). https://doi.org/10.1155/2013/798101
- Näschen, K., Diekkrüger, B., Evers, M., Höllermann, B., Steinbach, S., & Thonfeld, F. (2019). The impact of land use/land cover change (LULCC) on water resources in a tropical catchment in Tanzania under different climate change scenarios. Sustainability (MDPI), 11(24), 7083. https://doi.org/10.3390/su11247083
- Newmark, W. D. (2008). Isolation of African protected areas. Front Ecol Environ (The Ecological Society of America), 6(6), 321–328. https://doi.org/10.1890/070003
- Ouedraogo, I., Tigabu, M., Savadogo, P., Compaore, H., Oden, P. C., & Ouadba, J. M. (2010). Land cover change and its relation with population dynamics in Burkina Faso, West Africa. Land Degradation & Development, 21(5), 453–462. https://doi.org/10.1002/ldr.981
- Prince, K. P., Guo, X., & Stiles, J. M. (2012). Optimal landsat TM band combinations and vegetation indices for discrimination of six grassland types in eastern Kansas. International Journal of Remote Sensing, 23(23), 5031–5042 https://doi.org/10.1080/01431160210121764
- Roques, K. G., O’Connor, T. G., & Watkinson, A. R. (2001). Dynamics of shrub encroachment in an African savanna: Relative influences of fire, herbivory, rainfall and density dependence. Journal of Applied Ecology (British Ecological Society), 38(2), 268–280. https://doi.org/10.1046/j.1365-2664.2001.00567.x
- Sader, S. A., & Winne, J. C. (1992). RGB-NDVI Colour composites for visualizing forest change dynamics. International Journal of Remote Sensing, 13(16), 3055–3067. https://doi.org/10.1080/01431169208904102
- Sanchez-Azofeifa, A., Rivard, B., Calvo, J., & Moorthy, I. (2002). Dynamics of Tropical Deforestation around national parks: Remote sensing of forest change on the Osa Peninsula of Costa Rica. Mountain Research and Development (International Mountain Society), 22(4), 352–358. http://dx.doi.org/10.1659/0276-4741(2002)022[0352:DOTDAN]2.0.CO;2
- Sanderson, E. W., Malanding Jaiteh, M. A., Levy, K. H., Redford, A. V. W., & Woolmer, G. (2002). The human footprint and the last of the wild. (BioScience), 52, 10.
- Sandoval, F. A., Ramos, M. M., & Masera, O. R. (2007). Assessing implications of land-use and land-cover change dynamics for conservation of a highly diverse tropical rain forest. Biological Conservation, 138(1–2), 131–145. https://doi.org/10.1016/j.biocon.2007.04.022
- Santini, L., Saura, S., Rondinini, C., & Loyola, R. (2016). Connectivity of the global network of protected areas. Diversity and Distributions (John Wiley & Sons Ltd), 22(2), 199–211. https://doi.org/10.1111/ddi.12390
- Simpson, R. W., Petroeschevsky, A., & Lowe, I. (2000). An ecological footprint analysis for Australia. Australian Journal of Environmental Management, 7(1), 11–18. https://doi.org/10.1080/14486563.2000.10648479
- Temudo, M. P., & Silva, M. N. J. (2011). Agriculture and forest cover changes in post-war Mozambique. Journal of Land Use Science (Taylor & Francis Group), 1–18. https://doi.org/10.1080/1747423X.2011.595834
- Toit, M. J. D., Cilliers, S. S., Dallimer, M., Goddard, M., Guenat, S., & Cornelius, S. F. (2018). Urban green infrastructure and ecosystem services in sub-Saharan Africa. Landscape and Urban Planning, 180, 249–261. https://doi.org/10.1016/j.landurbplan.2018.06.001
- Trollope, W. S. W., & Trollope, L. A. 2004. “Fire effects and management in African grasslands and savannas“. Range and animal sciences and resources management 2. UNESCO-Encyclopedia of Life Support Systems. http://www.eolss.net/sample-chapters/c10/E5-35-18.pdf.
- UN. 2017. “World Population Prospects: The 2017 Revision, Key Findings and Advance Tables“. Working Paper No. ESA/P/WP/248, Department of Economic and Social Affairs, Population Division, United Nations, New York.
- UNEP-WCMC. (2017). Global statistics from the World Database on Protected Areas (WDPA).
- Venter, O., Sanderson, E. W., Magrach, A., Allan, J. R., Beher, J., Jones, K. R., Possingham, H. P., Laurance, W. F., Wood, P., Fekete, B. M., Levy, M. A., & Watson, J. E. M. (2016a). Sixteen years of change in the global terrestrial human footprint and implications for biodiversity conservation. Nat. Commun, 7(1), 12558. https://doi.org/10.1038/ncomms12558
- Wang, J., Wang, K., Zhang, M., & Zhang, C. (2015). Impacts of climate change and human activities on vegetation cover in hilly southern China. Ecological Engineering, 81, 451–461. http://dx.doi.org/10.1016/j.ecoleng.2015.04.022
- Xie, Y., Zongyao, S., & Mei, Y. (2008). Remote sensing imagery in vegetation mapping: A review. Journal of Plant Ecology (Oxford University Press on Behalf of the Institure of Botany, Chinese Academy of Sciences and the Botanical Society of China), 1(1), 9–23. https://doi.org/10.1093/jpe/rtm005
- Yameogo, U. G. 2005. “Le feu, un outil d’ingénierie écologique au Ranch de Gibier de Nazinga au Burkina Faso (In French)“. PhD Thesis, University of Orleans.
- Zhou, W., Gang, C., Zhou, F., Jianlong, L., Dong, X., & Zhao, C. (2014). Quantitative assessment of the individual contribution of climate and human factors to desertification in northwest China using net primary productivity as an indicator. Ecological Indicators (Elsevier), 48, 560–569. http://dx.doi.org/10.1016/j.ecolind.2014.08.043