
ABSTRACT
Identifying and protecting natural resources is a meaningful way forward for achieving sustainable development. Since water is a precious natural resource that is being depleted faster than it is recharged, there is an urgent need to evaluate and monitor this resource. Watershed-based studies are gaining momentum, while studying about the natural resources. The purpose of this study is to analyze the morphometric characteristics of a watershed. Numerous morphometric parameters have been devised by various scholars to measure the drainage basin characteristics quantitatively. The methodology of this study is to make use of remote sensing and GIS techniques to analyze the drainage morphometry of Vannathangarai watershed in Tamil Nadu, India. The study has identified that the watershed has a low runoff and slow infiltration, thus pointing toward a probability of flooding. The study also revealed that the basin is well drained, basin where the surface is lowered by erosion.
1. Introduction
Geomorphometry is the application of quantitative techniques to analyze the land surface characteristics. Geomorphometry is the science of quantitative land-surface analysis (Pike, Citation1961, Citation2000). It is an interdisciplinary field that makes use of the techniques in Mathematics and Computer science into the broad field of Geography. It is widely applied to disciplines like hydrology, climatology, meteorology, and drainage Morphometry.
A drainage basin is an area that is drained by a river and its tributaries. Drainage basins are considered as physical entities, which consist of many watersheds. Every river consists of numerous watersheds, and all these watersheds form a drainage basin. As drainage basins form discrete landforms capable of statistical analyses, myriad means of quantitative and qualitative methodologies exist. Morphometric analysis is quantitative, which involves numerical variables recovered from topographic maps or satellite images.
The morphometric analysis provides insight into the geohydrological characteristics of that particular terrain and enables identification of surface runoff, infiltration, erosion, sediment movements etc. The relation between the drainage morphometric parameters and its underlying geological, hydrological and geomorphological relationship has been established for a long time by eminent geologists and geomorphologists (Strahler, Citation1952) This in turn aids in the preservation and management of natural resources, especially water resources. Assessing the quantitative morphometric characteristics of the drainage basin produces knowledge about the nature of the rocks; this, consequently, renders the permeability index of the rocks and aids in understanding the yield of the drainage basin (Singh et al., Citation2013)
Generally, a morphometric study is carried out with the help of specific quantitative parameters, which are grouped into linear (uni-dimensional), areal (two dimensional), and relief (three dimensional) aspects (Melton, Citation1957; Horton, Citation1945; Miller, Citation1953; Strahler, Citation1964). The nature of a drainage basin is characterized by its relief, lithology, and the climatic factors that act upon the terrain. Earlier all these quantifications were done manually with the help of topographical maps, but now with the advent of Satellite images, the extraction of quantitative parameters of morphometry is done systematically, precisely and effortlessly (Aparna et al., Citation2015; Ayele et al., Citation2017; Javed et al., Citation2009; Kabite & Gessesse, Citation2018; Kulkarni, Citation2013; Pande & Moharir, Citation2017; Prakash et al., Citation2016; Rai et al., Citation2017; Singh et al., Citation2014). The characteristics of the basin are beneficial in determining the hydro-sedimentary flow regimes. The present study aims to characterize the geomorhometric properties of the Vannathangarai watershed.
2. Study area
The current study was carried out in the Vannathangarai watershed of River Noyyal basin. The Noyyal is a branch of river Cauveri and originates from the Velliangiri Hills in the Coimbatore district of Tamil Nadu. This watershed forms at the headwaters of River Noyyal and includes part of Coimbatore and Tiruppur districts. The river travels through the cities of Coimbatore and Tiruppur and meets the Cauveri in Karur district. The “Noyyal” is a sacred river in Tamil history.
Coimbatore district occupies a significant share of the region, while only marginal areas of Tirupur district is confined to this watershed. It is bordered by Palakkad district of Kerala to the west, Nilgiris district to the North, Tirupur to the north and east, and parts of Coimbatore district to the south. This watershed is of paramount importance as the headwaters of the river Noyyal lies inside this. The western portion of the watershed embraces a small portion of the rain shadow region of the Western Ghats above the Palakkad Gap()
Figure 1. Location map of the study area.
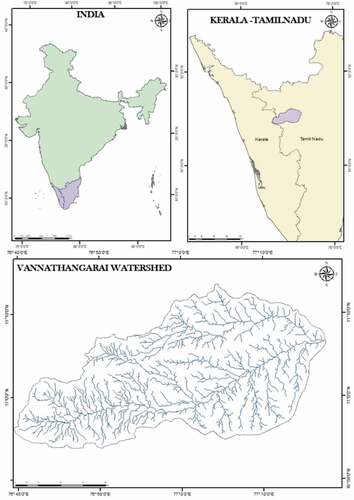
The area of the Vanathangarai watershed accounts for 1512 square kilometers. This watershed is the most thickly populated area of the whole Noyyal basin. A major metropolitan center in Tamil Nadu, Coimbatore, which is the second-biggest urban center in the state after the capital city, lies inside the watershed. Many parts of Tirupur district, which is a major cotton-growing hub and possesses lots of cotton dyeing units and cotton textile mills, are included in this watershed.
The area is marked by the presence of shallow weathered/buried pediplain, ridge type structural hills, shallow and moderately buried pediment, shallow floodplains, etc. Almost the whole eastern half of the area is filled by shallow weathered/buried pediplain. Quartz vein, granitoid gneiss, conglomerate sandstone, granite, ultrabasic rocks, and carbonatites are significant geological features seen in the region. There are different varieties of soil seen in the study area. Red clayey, red gravel loam, calcareous gravel loam and gravel clay are the dominant soil types seen in the region.
3. Database
The analysis was done with the help of SRTM (Shuttle Radar Topographic Mission) DEM (Digital Elevation Model) data with a 30 m spatial resolution satellite image obtained from the USGS earth explorer website. Grohmann et al. (Citation2007) have opined that the usage of SRTM data and GIS techniques enables fast, precise, and cost-effective analysis of morphometric characteristics.
4. Methodology
The watershed boundary is extracted automatically from SRTM DEM data. The inputs needed for extraction are DEM and pour point. The SRTM data was also used to generate the slope, terrain details, in ArcGIS 10.3. The morphometric characters were calculated using the spatial analysis tool and already derived mathematical formula ().
Table 1. Morphometric characteristics of Vannathangarai watershed.
5. Results and discussion
5.1. Drainage pattern
Drainage patterns are classified based on the form and texture of the streams, in accordance with the slope and structure of the surface. The local topography of the terrain and its subsurface geology influences the shape and patterns of the river. The drainage pattern of the current watershed is identified as dendritic, which has the tributaries joining the mainstream at acute angles. Dendritic pattern is the most commonly occurring pattern, where the tributaries of the main river join together in shape, similar to the twigs of a tree (Guilbert & Zhang, Citation2012).
5.2. Basin geometry
The Vannathangarai watershed constitute an area of 1512.82 km2 with a perimeter of 194.63 km. According to Schumm (Citation1956), the relative perimeter (Pr) of the basin is the ratio between the area and the perimeter of the watershed, and here the value is 7.77. The length of the basin (Lb) is 83.95 km. The length of the main channel (Lc) is found to be 73. 45 km, which is the most extended channel from the source point of the watershed boundary. For many basins, the relation between the length of the stream and the area of the basin is associated to a function, known as the Length area relation (Lar), developed by Hack (Citation1957), and its value for the watershed is 113.24. The mean width of the basin is 18.01 km and is computed based on Horton’s (Citation1932) method, which is the quotient of area and basin length. To find out the basin slope, Chorley et al. (Citation1957) has expressed the method of Lemniscate’s (K). The value ofK for this particular watershed is 4.65, and it shows that the watershed covers the most significant share within the region of its origin with more streams of higher-order within the watershed ().
Table 2. Basin geometry parameters.
5.3. Linear parameters
Linear parameters consist of the one-dimensional characteristics, including all the linear features of the drainage basin, which are as follows:
5.3.1.. Stream order
In a drainage basin or a watershed, stream network is the collection of stream segments (Horton, Citation1945; Strahler, Citation1957). The arrangement of stream in the hierarchical order has been allotted a series of numbers according to their position (Asfaw & Workineh, Citation2019). Generally, the most significant, branched, chief, or stem stream is designated as order one and the smaller tributary streams of increasingly higher orders (Gravelius, Citation1914). According to Strahler (Citation1964), there are no tributaries for first-order streams. All the tributaries of the second-order streams belong to the first-order streams. The next higher-order streams possess the tributaries of all the succeeding lower-order streams, continuing so on till any number of higher-order streams. An area where erosion is still prominent will have a larger number of stream segments in a particular order. In the present study, five orders of streams are identified ().
Figure 2. Drainage map.
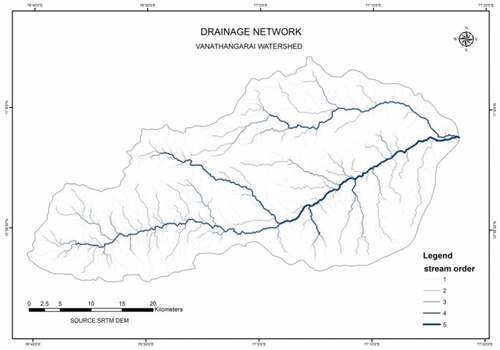
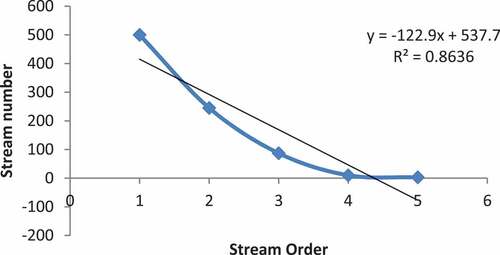
The total number of streams identified in the watershed is 845, out of which 500 streams belong to first order, 245-second order, 87 third order, 10-fourth-order, and 3-fifth-order. Generally, more water is generated in a watershed, which has a maximum number of lower-order streams. There is an inverse relationship between the stream number and stream order, which implies that the stream frequency decreases with an increase in the stream order (). It is also noted that the highest frequency is noticeable among the streams of the first order.
Figure 3. Interrelation of stream order with the number of streams.
5.3.2.. Stream length
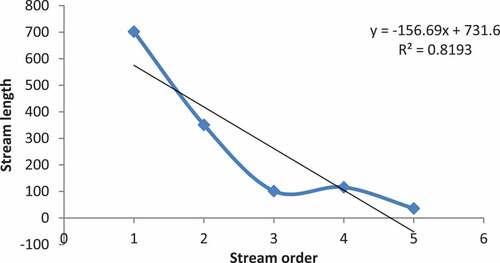
According to Horton (Citation1945), the entire lengths of a given order are the result of the quantity of streams and lengths per stream. Where the bedrock is less pervious, an enormous number of streams of minor lengths are developed, while if the bedrock is porous, small quantities of comparatively larger streams are developed in a relatively well-drained watershed or basin (Narasimhan & Vasanthamohan, Citation2011). Typically, the lower order streams have the maximal stream length, and it declines with an increase in stream order. Fewer lengths of channels are more evident in areas with a steep slope, and longer streams indicate plain regions where the slope is gentle. The length of river channels in any watershed declines with arise in stream orders. The total length of the streams is estimated to be 1307.62 km. Plotting the number of streams and stream order on the logarithmic scale reveals an inversely proportional relationship between them ()
Figure 4. Interrelationship between stream order and stream length.
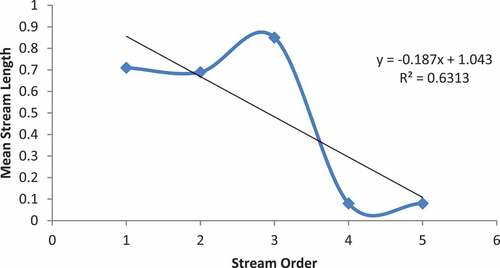
5.3.3. Mean stream length(Lsm)
Lsmis derived by dividing the entire length of the channel by the total number of streams. There is a positive relationship between the Lsmand the size and surface features of the watershed. According to Strahler (Citation1964), the size of the stream networks and its related features has a significant relation with the Lsm. There is a high association between the mean stream length, runoff, and the erosional phase of the watershed. If the Lsm is low, it shows a higher surface flow and erosion (Gopinath Girish et al., Citation2016). The Lsm of the watershed ranges between 1.4 and 12.13. It is shortest for the first-order streams and longest for the fifth-order stream ().
Figure 5. Interrelationship between stream order and Lsm.
5.3.4. Stream length ratio (Rl)
The proportion between the Lsm of one order with the following lower-order stream is itsRl. It changes with the variations in slope and terrain features, runoff, and erosional phase of the watershed (Sreedevi et al., Citation2005). In the watershed, the Rlvalue varies between 0 and 1.14 except for the third-order streams where it is slightly higher ().
Table 3. Linear parameters of the Vannathangarai watershed.
5.3.5. Bifurcation ratio(Rb)
The ratio of the number of streams of a particular order to the number of streams of the succeeding higher order is called the Rb (Strahler, Citation1964). This describes the branching pattern of the drainage network. If the value ranges from 0.6 to 2.9, it shows that the watershed is included under the standard category. For drainage basins where the geologic structure does not distort the drainage patterns, the Rb value ranges between 3.0 and 5.0. (Kale & Gupta, Citation2001; Strahler, Citation1957). If the Rb value is greater than 10, it leads to the formation of elongated narrow drainage basins, which are formed due to prolonged structural control and erodible rocks of that basin (Chorley et al., Citation1984). The Rb also indicates the pattern of the drainage basin. The ratio will be higher if the basin is elongated and is lower if the basin is circular. A higher ratio is also an indicator of the potentiality for flash floods. The first, second, and fourth-order streams show a lesser ratio, below 3.5, while the third-order streams possess a higher bifurcation ratio, which is close to 8.7 (). The Rbm for the watershed is estimated as 3.37. The value indicates that the streams are well-formed on an almost uniform topography, where its geologic structure least influences the pattern of drainage. (Asfaw & Workineh, Citation2019) .
5.4. Aerial parameters
Aerial parameters or basin parameters indicate the whole area protruded upon a plane providing the overland flow to the stream network of a particular order and encompasses all the channel networks of its lower order.
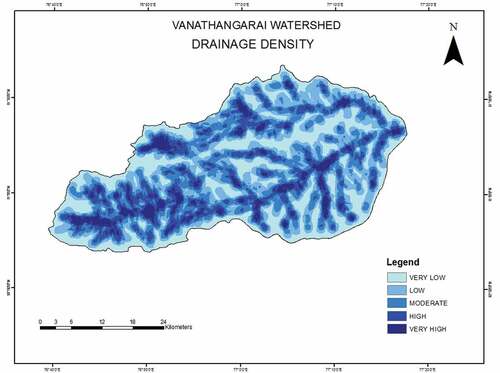
5.4.1. Drainage density(Dd)
Dd is the stream development level inside a basin and is derived by finding out the mean length of streams within the watershed per unit area (Horton, Citation1932). Ddprovides a quantitative evaluation of the surface runoff capability and dissection of the landscape (Chorley, Citation1969). Horton (Citation1945) explained Dd as a tool to estimate the measured traveling time of water in the total drainage basin by evaluating the closeness of the stream network. Areas that possess scanty vegetation generally show a higherDd and have significant flood peaks. Areas with less pervious rocks and high relief show a higher Dd compared to places with highly resistant and permeable surfaces, which show a low profile of drainage density (Gopinath Girish et al., Citation2016). According to Langbein (Citation1947), the Dd of humid regions ranges between 0.55 and 2.09 km2. The Dd of the current watershed is 1.72, which implies that this is a relatively well-drained basin of a sub-humid region () ().
Table 4. Aerial parameters.
Figure 6. Drainage density map.
5.4.2. Drainage intensity(Di)
The proportion of the Fsto Dd is termed as drainage intensity (Faniran, Citation1968). This study has identified a very low Diof 0.32, which suggests that the Dd and Fs have a meager impact, intending that denudation agents have reduced the terrain. This is an indication that the movement of the surface runoff is prolonged, making the area vulnerable to easy flooding.(Pareta & Pareta, Citation2011) ().
5.4.3. Infiltration ratio(If)
Faniran (Citation1968) has propounded another technique, namely the infiltration ratio, which is the outcome of the Ddand Fs. Pareta and Pareta (Citation2011) suggested that the infiltration number has an antagonistic relationship with the infiltration capacity and a positive relation with the runoff. The current study has identified that the infiltration number is 0.96, which implies a lower surface runoff and lesser infiltration capacity making the area more susceptible to flooding ().
5.4.4. Rho coefficient(Crh)
Crh is influenced by the climate, geology, geomorphology of the terrain along with the biological and anthropological factors. It is a significant parameter related to the Dd and geomorphic development of a watershed, which enables the estimation of the storage potential of the rivers; thus it helps to determine the ultimate stage of drainage development in a given watershed; in other words, it is defined as the ratio between the length of the streams and Rb (Horton, Citation1945). The Crh of the Vannathangarai watershed is calculated as 0.13, signaling that it has more extensive hydrologic storage during flood periods ().
5.4.5. Stream frequency (Fs)
Fs is the number of streams per unit area. Higher Fs indicates more surface runoff, low infiltration capacity, sparse vegetation, high relief, and steep slope (Horton, Citation1945). The values of Dd and Fs of different drainage basins with varying lengths cannot be associated as they differ in their size. Since the origin of a stream is based on the type of vegetation cover, structure of rocks, amount of precipitation, and the permeability of the soil, the Fs acts as an indicator of the evolution of the landscape of that region. The Fs of the Vannathangarai watershed is 0.55. A positive correlation exists between the Dd and Fs; with more streams, the density also increases().
5.4.6. Texture ratio(T)
The value of T is derived by estimating the ratio between the total number of stream segments and the perimeter of the watershed. Horton (Citation1945) has defined the texture ratio as the product of Fs and Dd and opined that it is a crucial factor. Smith (Citation1950) has done a detailed study about the texture ratio and pointed out that it is dependent on numerous natural characters like the amount of precipitation, types of soil, the density of vegetation, infiltration capacity, relief, and the stage of geomorphic development. T is considered an essential parameter that shows the relative spacing of the drainage networks of any watershed. If T’s value is below two, it indicates a very coarse texture; likely, a value between two to four is coarse, four to six is moderate, six to eight is fine, and above 8 is very fine drainage textures (Smith, Citation1950). The T value of the Vannathangarai watershed is 4.34, which denotes a moderate texture().
5.4.7. Form factor (Rf)
The Rf is defined as the flow intensity of a watershed for a specific area (Horton, Citation1932). Rf indicates the maximum flow and duration; higher form factor suggests maximum flow during a short span (Gopinath Girish et al., Citation2016). It is presumed that, Rf value of 0.78 is indicative of a perfectly circular basin. (Gopinath Girish et al., Citation2016; Harinath & Raghu, Citation2013) The present study identifies the Rf of the basin as 0.21, which suggests that the drainage basin is elongated().
5.4.8. Circulatory ratio (Rc)
The circulatory ratio is the proportion of the watershed area and the area of the circle of perimeter of the watershed (Miller, Citation1953). The low, medium, and high Rc indicate the youth, middle, and old stages of the stream development (Narasimhan & Vasanthamohan, Citation2011). The circulatory ratio of this watershed is estimated to be 0.50, which, according to Miller (Citation1953), symbolizes the basin’s elongated shape with highly permeable, analogous, geologic materials. ().
5.4.9. Elongation ratio(Re)
The Re value usually ranges from 0.6 to 1 over a broad climatic and geologic type; If Re is near to 1, relief is generally very low. Areas with high relief and steep slope possess Re values ranging between 0.6 and 0.8 (Strahler, Citation1964). These values can be arranged into three classes; Circular (above 0.9), oval (0.9–0.8), and less elongated (below 0.7) (Narasimhan & Vasanthamohan, Citation2011). Efficiency in the runoff discharge is more for a circulatory basin than for an elongated one (CS Singh & Singh, Citation1973; Gajbhiye et al., Citation2014). A watershed which has high runoff with low infiltration capacity, will always have a higher Re. (Gopinath Girish et al., Citation2016). According to Chorley et al. (Citation1984), the areas with high relief possess Re around 0.6, and if it is near to 1, it implies a very low relief. The Re of the Vannathangarai is 0.52, thus revealing a less elongated, low land region ().
5.4.10. Shape index(Sw) and shape factor(Sf)
The Sw is the reciprocal of the Rf and is a dimensionless property (Soni, Citation2016), and the shape index for the watershed is 1.79. Horton (Citation1932) has defined the Sf as the ratio of the square of Lb to the area of the basin. The Sf assists in interpreting the shape distortion of a watershed (Yadav et al., Citation2014). The Sf for the Vannathangarai is 4.65().
5.4.11. Length of overland flow(Lof)
Horton (Citation1945) considered the Lof an essential tool to analyze the development of physiography and the drainage basin and defined it as the measure of water over the terrain before it gets collected into brooks. Lof is determined by the nature of rock, relief, and climatic condition, vegetation cover, permeability, duration of erosion (Schumm, Citation1956). The current study reveals that the Lof of Vannathangarai is 0.86 km. A more significant value of the Lofdesignates a more extended flow path with gentle slopes (Narasimhan & Vasanthamohan, Citation2011) ().
5.4.12. Fitness ratio (Rf) and wandering ratio(Rw)
The topographic fitness is measured using its fitness ratio, which according to Melton (Citation1957), is the ratio of the Lc to the perimeter of the watershed and is 0.37 for the Vannathangarai watershed. The proportion of the Lc to Lb is given by its wandering ratio (Smart & Surkan, Citation1967), and its value for the basin is 0.874 ().
5.4.13. Compactness co-efficient(Cc)
Another crucial parameter is the Cc, which is the ratio of the perimeter of the basin to the circumference of the circular area (Gravelius, Citation1914). The Cc value for a perfect circle is one and rises with the increase in Lb and hence it is independent of the size of the watershed. The value of the compactness coefficient for this watershed is 1.41, which states that the shape is more elongated ().
5.4.14. Constant of channel maintenance (C)
This concept was introduced by Schumm (Citation1956) and is the reverse of Dd. C is defined as the area needed to sustain one vertical kilometer of stream (Dikpal et al., Citation2017). C is highly dependent on the geology, porosity, climatic condition, type of vegetation, duration of erosion, and the terrain of the area. A higher C value indicates rocks with more permeability (Narasimhan & Vasanthamohan, Citation2011). The more the value of the channel maintenance, the more is its permeability. The constant for the current study is inferred to be 0.57, which indicates lower runoff ().
5.5. Relief parameters
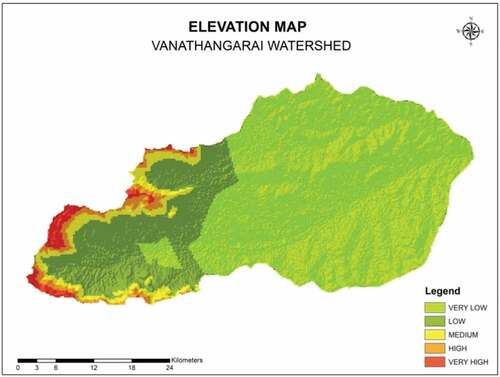
The relief parameters are connected with three-dimensional features like volume, altitude, etc., to investigate the various geo-hydrological characteristics. The maximum elevation of the watershed is 1928 m, and the lowest point is 301 m. The elevation at the river’s source is estimated at 1254 m, and its mouth is 304 m ().
Table 5. Relief parameters.
5.5.1. Basin relief(Bh) and total basin relief(H)
Basin relief is expressed as the maximum upward distance between the lowest and highest point of the area. Hadley and Schumm (Citation1956) opined that basin relief is the causative factor for the stream gradient and plays an influential role in determining the flood characteristics and volume of materials that can be carried along. Sreedevi et al. (Citation2009) identified this as an integral factor in getting the basin’s denudation features. Lower Bh is an indication of minimal surface runoff, debris movement, and spreading of water basin while the higher values indicate enhanced flood peaks (Gopinath Girish et al., Citation2016). The maximum elevation in the watershed is noted as 1928 m, which is seen at the western side of the watershed, while the lowest point is having an elevation of 301 m (). Thus the basin relief obtained for the watershed is 1627 m. Thomas et al. (Citation2010) presumed that river basins with mountain-plain front generally have higher basin relief than rivers with plateau-plain front. Strahler (Citation1952) has defined the total basin relief as the difference between the highest elevation of the watershed and the maximum elevation at the mouth. The Vannathangarai watershed has an H value of 1624 m ().
5.5.2. Relief ratio(Rh)
Rh is described as the ratio between the total reliefs to the length of the principal drainage line. It is an indication of runoff and severity of the erosion process, and it evaluates the steepness of a watershed (Phani, Citation2014). There is a negative correlation with the Rh and drainage area and its size (Gottschalk, Citation1964) ().
5.5.3. Relative relief(Rr)
Rr depicts the exact change of elevation in a unit area concerning its local base level. Rr can represent the terrain features without considering the sea level (S Singh & Dubey, Citation1994). It is termed as the amplitude of local relief. The relative relief of the Vannathangarai watershed is 8.35().
5.5.4. Ruggedness number(Rn), ruggedness index(Ri), Melton’s ruggedness number(Mrn)
Strahler (Citation1958) explained the Rn as the product of Bh and Dd. Selvan et al. (Citation2011) considered it as a measure of the unevenness of the surface. The ruggedness number for the watershed is 2812.64. Ruggedness index is a measure of the combined effect of the local terrain and the magnitude of Ddand other geographic parameters like rainfall, slope, denudation, nature of the soil, etc.(Chorley, Citation1969). The ruggedness index for this watershed is estimated at 2.81. Melton’s ruggedness number is an index of slope that gives a specialized illustration of relief ruggedness within the watershed (Melton, Citation1965). The Mrn for the watershed is 41.84 ().
5.5.5. Gradient ratio(Rg)
Sreedevi et al. (Citation2009) devised the gradient ratio as a tool to evaluate the runoff volume. Rg is an expression of channel undulation that assists in assessing the runoff volume (Sreedevi et al., Citation2005). The gradient ratio for the watershed is 19.34. A higher Rg indicates a steep slope with high runoff, while lower runoff indicates lesser runoff and higher infiltration().
5.5.6. Slope analysis
Slope is an essential factor as it determines the infiltration and runoff; Infiltration capacity and slope are inversely related (Mahala, Citation2020). Most of the study area has a relatively low land without much undulation (). Beside the left bank side of the river channel, the slope is towards the south, and along the right bank side, it is towards the north. Near the western fringes of the watershed, steep terrain is observed, which is a part of the Western Ghats hill ranges. Wentworth (Citation1930) suggested that the erodibility can be estimated and can be compared with its slope. Higher the slope, higher is the erosion. The average slope of the area is 0.42%, and according to Chorley (Citation1969), the mean slope of the basin is 0.71% ().
Figure7. Slope map.
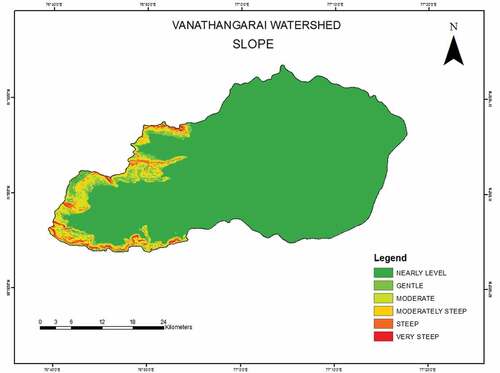
Figure 8. Aspect map.
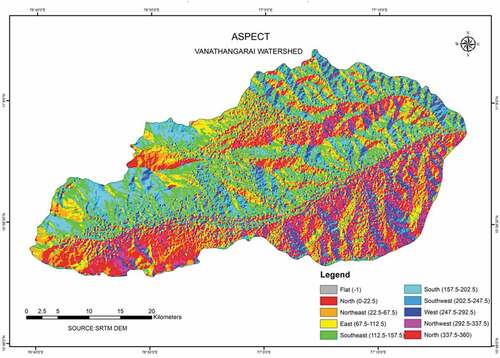
Figure 9. Elevation map.
5.5.7. Coarse ratio(Cr)
Coarse ratio is described as the difference between the maximum and minimum levels of the watershed divided by its perimeter (Melton, Citation1957). Cr is an expression of the relationship between the Bh and Dd (Singh et al., Citation2014). The Cr for the Vannathangarai watershed is estimated at 2.81. Chorley (Citation1966) stated that, coarse ratio, will be less at the youthful stage, increases gradually, and will be the highest at the mature stage and starts to decline, by the end of its life cycle ().
6. Conclusion
Morphometry is the science that studies the quantitative examination of the drainage basin, which provides an in-depth insight into the relief and topography of the drainage surface. The Vannathangarai watershed lies at the headwaters of river Noyyal. The watershed has a generally low slope, with hills seen only along the western fringes, and the remaining area is more or less an even plain. The streams of the watershed, which has an area of 1512.82 km2 and perimeter of 194.63 km2, follow the dendritic pattern of drainage. The watershed consists of five orders of stream, with more than 800 streams, where more streams are seen in the lower order. The length of lower-order streams is higher than that of the next higher-order streams, indicating less surface permeability. Analyzing the bifurcation ratio makes it clear that the streams are developed over a homogeneous surface for almost the entire watershed except for few areas at the western hill reaches.
The drainage density indicates that the watershed is well-drained and belongs to a sub-humid region. The drainage intensity points out that the surface is lowered considerably, and it takes a long time to remove that runoff, indicating a probable chance of flooding. The Rho coefficient shows that the watershed has higher hydrologic storage during flood periods. Infiltration ratio indicates a low runoff and lesser infiltration capacity making the area more susceptible to flooding. The watershed is elongated in shape and has a medium texture. A more significant value of the Lof symbolizes a higher flow path with gentle slopes. Analysis of all these parameters enables the identification of the potential groundwater zones as the source of water is altered by the structural, lithological, and geomorphological set up of an area (Schumm, Citation1956). As the watershed is a densely populated region with numerous industries and more number of agricultural activities, it is essential to identify the prospects for groundwater and to safeguard the existing water resources. The study is highly beneficial in this context, and for this, the geospatial technologies are path-breakers providing easy and accurate information.
Future scope of research
There is a paradigm shift in geographical research over the last few years; from political or administrative boundary-based studies now the emphasis is on natural boundary-based studies; especially for natural resource assessment, watershed boundaries are preferred. Prior to any research, understanding the characteristics of the watershed is of prime importance and for this purpose, morphometry-based studies are a prerequisite. Hence, in the future, geomorphometrical studies will play a crucial role in watershed-based research.
Disclosure statement
No potential conflict of interest was reported by the author(s).
References
- Aparna, P., Nigee, K., Shimna, P., & Drissia, T. (2015). Quantitative analysis of geomorphology and flow pattern analysis of Muvattupuzha River Basin using Geographic Information system. Journal Aquatic Procedia, 4, 609–616. https://doi.org/10.1016/j.aqpro.2015.02.079
- Asfaw, D., & Workineh, G. (2019). Quantitative analysis of morphometry on Ribb and Gumara watersheds: Implications for soil and water conservation. International Soil and Water Conservation Research, 7(2019), 150–157. https://doi.org/10.1016/j.iswcr.2019.02.003
- Ayele, A., Yasuda, H., Shimizu, K., Nigussie, H., & Kifle, W. (2017). Quantitative analysis and implications of drainage morphometry of the Aguila watershed in the semi-arid northern Ethiopia. Applied WaterScience, 7, 3825–3840. https://doi.org/10.1007/s13201-017-0534-4
- Chorley, R. J. (1966). The application of statistical methods to geomorphology. In G. H. Dury (Ed.), Essays in geomorphology, Heinemann.
- Chorley, R. J. (1969). Introduction to fluvial processes ( 588). London: Methuen and Co., Limited.
- Chorley, R. J., Donald Malm, E. G., & Pogorzelski, H. A. (1957). A new standard for estimating drainage basin shape. American Journal of Science, 255(2), 138–141. https://doi.org/10.2475/ajs.255.2.138
- Chorley, R. J., Schumm, S. A., & Sugden, D. E. (1984). Geomorphology. Methuen.
- Dikpal, R. L., Renuka Prasad, T. J., & Satish, K. (2017). Evaluation of morphometric parameters derived from Cartosat-1 DEM using remote sensing and GIS techniques for Budigere - Amanikere watershed, Dakshina Pinakini Basin, Karnataka, India. Applied Water Science, 7(2017), 4399–4414. https://doi.org/10.1007/s13201-017-0585-6
- Faniran. (1968). The index of drainage intensity - A provisional new drainage factor. Australian Journal of Science, 31, 328–330.
- Gajbhiye, S., Mishra, S. K., & Pandey, A. (2014). Prioritizing erosion-prone area through morphometric analysis: An RS and GIS perspective. Applied Water Science, 4(1), 51–61. https://doi.org/10.1007/s13201-013-0129-7
- Gopinath Girish, A. G., Nair, A. G. K., & Swetha, T. V. (2016). Watershed prioritization based on morphometric analysis coupled with multi-criteria decision making. Arabian Journal of Geosciences, 9(2), 129. https://doi.org/10.1007/s12517-015-2238-0
- Gottschalk, L. C. (1964). reservoir sedimentation. In V. T. Chow (Ed.), Handbook of applied hydrology. McGraw Hill Book Company. Section 7-I.
- Gravelius, H. (1914). Flusskunde. Goschen Verlagshan dlung Berlin. In I. Zavoianu (Ed.), Morphometry of drainage basins. Amsterdam: Elsevier.
- Grohmann, C. H., Riccomini, C., & Alves, F. M. (2007). SRTM-based morphotectonic analysis of the Pocos de Caldas alkaline massif Southeastern Brazil. ComputGeosci, 33(1), 10–19. https://doi.org/10.1016/j.cageo.2006.05.002
- Guilbert, E., & Zhang, L. and (2012), A study of variables characterizing drainage patterns in river networks. In Proceedings of international archives of the photogrammetry, remote sensing and spatial information sciences, Volume XXXIX-B2, 2012 XXII ISPRS Congress, 25 August – 01 September 2012. Melbourne, Australia.
- Hack, J. (1957). Studies of longitudinal stream profiles in Virginia and Maryland. U.S. Geological Survey Professional Paper, 294–B.
- Harinath, V., & Raghu, V. (2013). Morphometric analysis using arc GIS techniques: A case study of Dharurvagu, South Eastern Part of Kurnool district, Andhra Pradesh, India. International Journal of Science and Research, 2(1), 2319–7064. https://www.ijsr.net/search_index_results_paperid.php?id=IJSR13010155
- Horton, R. E. (1932). Drainage basin characteristics. Transactions, American Geophysical Union, 13(1932), 350–361. https://doi.org/10.1029/TR013i001p00350
- Horton, R. E. (1945). Erosional development of streams and their drainage basins, hydrophysical approach to quantitative morphology. Geological Society of America Bulletin, 56(3), 275–370. https://doi.org/10.1130/0016-7606(1945)56[275:EDOSAT]2.0.CO;2
- Javed, A., Khanday, M. Y., & Ahmed, R. (2009). Prioritization of sub-watershed based on morphometric and land use analysis using remote sensing and GIS techniques. Journal of the Indian Society of Remote Sensing, 37(2), 261–274. https://doi.org/10.1007/s12524-009-0016-8
- Kabite, G., & Gessesse, B. (2018). Hydro-geomorphological characterization of Dhidhessa River Basin. Ethiopia International Soil and Water Conservation Research, 6(2), 175–183. https://doi.org/10.1016/j.iswcr.2018.02.003
- Kale, V. S., & Gupta, A. (2001). Introduction to Geomorphology. Orient Longman Limited, 82–101.
- Kulkarni, M. D. (2013). The basic concept to study morphometric analysis of river drainage basin: A review. International Journal of Science and Research, 4(7).
- Langbein, W. B. (1947). Topographic characteristics of drainage basins. US Geological Survey Geologic and Water-Supply, 986(C), 157–159. https://doi.org/10.3133/wsp968C
- Mahala, A. (2020). The significance of morphometric analysis to understand the hydrological and morphological characteristics in two different morpho-climatic settings. Applied Water Science, 10(1), 33. https://doi.org/10.1007/s13201-019-1118-2
- Melton, M. A. (1957) An analysis of the relations among the elements of climate, surface properties, and geomorphology. Technical report 11. Department of Geology, Columbia University
- Melton, M. A. (1965). The geomorphic and paleoclimatic significance of alluvial deposits in southern Arizona. The Journal of Geology, 73(1), 1–38. https://doi.org/10.1086/627044
- Miller, V. C. (1953) A quantitative geomorphic study of drainage basin characteristics in the Clinch Mountain area, Virginia and Tennessee, Project NR 389-042 (Tech. Rept. 3). Columbia University, Department of Geology, ONR, Geography Branch
- Narasimhan, L. C., & Vasanthamohan, V. (2011). Prioritization of mini watersheds based on Morphometric Analysis using Remote Sensing and GIS techniques in a drought-prone Bargur – Mathur subwatersheds, Ponnaiyar River basin, India. International Journal Of Geomatics And Geosciences, 2 (2), 2011. 0976 – 4380, 403-414. https://www.researchgate.net/publication/236329783_Prioritization_of_miniwatersheds_based_on_Morphometric_Analysis_using_Remote_Sensing_and_GIS_techniques_in_a_drought_prone_Bargur-Mathur_subwatersheds_Ponnaiyar_River_basin_India
- Pande, C. B., & Moharir. (2017). GIS-based quantitative morphometric analysis and its consequences: A case study from Shanur RiverBasin, Maharashtra India. Applied WaterScience, 7, 861–871. http://dx.doi.org/10.1007/s13201-015-0298-7
- Pareta, K., & Pareta, U. (2011). Quantitative morphometric analysis of a watershed of Yamuna Basin, India using ASTER (DEM) data and GIS. International Journal of Geomatics and Geosciences, 2(1), 248–269.
- Phani, R. P. (2014). Morphometry and its implications to stream sediment sampling: A study on Wajrakarur Kimberlite field, Penna river basin, Anantapur district, Andhra Pradesh, India. International Journal of Geomatics and Geosciences, 5(1), 74–90.
- Pike, R. J. (1961). The order of valley depth: The Monadnock. Journal of the Clark University Geographical Society, Worcester, MA, 35(2), p 12–19. http://www2.clarku.edu/departments/geography/documents/Monadnock/Monadnock.1961.Vol35.No2.May.pdf
- Pike, R. J. (2000). Geomorphometry — Diversity in quantitative surface analysis. Progress in Physical Geography, 24(1), 1–20. https://doi.org/10.1177/030913330002400101
- Prakash, K., Singh, S., & Shukla, U. K. (2016). Morphometric changes of the Varuna river basin, Varanasi district, Uttar Pradesh. Journal of Geomatics, 10(1).
- Rai, P. K., Mohan, K., Mishra, S., Ahmad, A., & Mishra, V. N. (2017). .AGIS-based approach in drainage morphometric analysis of Kanhar river basin, India. Applied WaterScience, 7, 217–232. http://dx.doi.org/10.1007/s13201-014-0238-y
- Schumm, S. A. (1956). Evolution of drainage systems and slopes in Badlands at Perth Amboy, New Jersey. Geological Society of America Bulletin, 67(5), 597–646. https://doi.org/10.1130/0016-7606(1956)67[597:EODSAS]2.0.CO;2
- Selvan Tamil M., & Ahmad S. (2011), Analysis of Geomorphometric parameters in high altitude glacierised terrain using SRTM DEM data in Central Himalaya, India.
- Singh, C. S., & Singh, R. L. (1973). Changes in the course of rivers and their effects on urban settlements in the Middle Ganga Plain. NGSI.
- Singh, P., Gupta, A., & Singh, M. (2014). Hydrological inferences from watershed analysis for water resource management using remote sensing and GIS techniques. The Egyptian Journal of Remote Sensing and Space Science, 17(2), 111–121. https://doi.org/10.1016/j.ejrs.2014.09.003
- Singh, P., Thakur, J. K., & Singh, U. C. (2013). Morphometric analysis of Morar River Basin, Madhya Pradesh, India, using remote sensing and GIS techniques. Environmental Earth Sciences, 68(7), 1967–1977. https://doi.org/10.1007/s12665-012-1884-8
- Singh, S., & Dubey, A. (1994). Geoenvironmental planning of watershed in India (pp. 28–69). Chugh Publications.
- Smart, J. S., & Surkan, A. J. (1967). The relation between mainstream length and area in drainage basins. Water Resources Research, 3(4), 963–973. https://doi.org/10.1029/WR003i004p00963
- Smith, K. G. (1950). Standards for grading texture of erosional topography. American Journal of Science, 248(9), 655–668. https://doi.org/10.2475/ajs.248.9.655
- Soni, S. (2016). Assessment of morphometric characteristics of Chakra watershed in Madhya Pradesh India using the geospatial technique. Applied Water Science, 7(5), 2089–2102. https://doi.org/10.1007/s13201-016-0395-2
- Sreedevi, P. D., Owais, S., Khan, H. H., & Ahmad, S. (2009). Morphometric analysis of a watershed of South India using SRTM data and GIS. Journal of the Geological Society of India, 73(4), 543–552. https://doi.org/10.1007/s12594-009-0038-4
- Sreedevi, P. D., Subrahmanyam, K., & Ahmed, S. (2005). Integrated approach for delineating potential zones to explore for groundwater in the Pageru River basin, Cuddapah District, Andhra Pradesh, India. Hydrogeology Journal, 13(3), 534–545. https://doi.org/10.1007/s10040-004-0375-8
- Sreedevi, P. D., Subrahmanyam, K., & Ahmed, S. (2005). The significance of morphometric analysis for obtaining groundwater potential zones in a structurally controlled terrain. Environmental Geology, 47(3), 412–420. https://doi.org/10.1007/s00254-004-1166-1
- Strahler, A. N. (1952). Hypsometric (area-altitude) analysis of erosional topography. Geological Society of America Bulletin, 63(11), 1117–1142. https://doi.org/10.1130/0016-7606(1952)63[1117:HAAOET]2.0.CO;2
- Strahler, A. N. (1957). Quantitative analysis of watershed geomorphology. Transactions, American Geophysical Union, 38(6), 913–920. https://doi.org/10.1029/TR038i006p00913
- Strahler, A. N. (1958). Dimensional analysis applied to fluvial eroded landforms. Geological Society of America Bulletin, 69(3), 279–300. https://doi.org/10.1130/0016-7606(1958)69[279:DAATFE]2.0.CO;2
- Strahler, A. N. (1964). Quantitative geomorphology of drainage basins and channel networks. In V. T. Chow (Ed.), Handbook of applied hydrology (pp. 439–476). McGraw-Hill.
- Thomas, J., Sabu, J., & Thrivikramaji, K. P. (2010). Morphometric aspects of a small tropical mountain river system, the Southern Western Ghats, India. International Journal of Digital Earth, 3(2), 135–156. https://doi.org/10.1080/17538940903464370
- Wentworth, C. K. (1930). A simplified method of determining the average slope of land surfaces. American Journal of Science, 20(117), 184–194. https://doi.org/10.2475/ajs.s5-20.117.184
- Yadav, S. K., Singh, S. K., Gupta, M., & Srivastava, P. K. (2014). Morphometric analysis of Upper Tons basin from Northern Foreland of Peninsular India using CARTOSAT satellite and GIS. Geocarto International, 29(8), 895–914. https://doi.org/10.1080/10106049.2013.868043