
ABSTRACT
Drainage morphometric analysis is a quantitative indexing of linear, areal, and relief attributes of a watershed, which is an essential prerequisite to understand the ongoing geomorphological, geological, and tectonic processes in a watershed that modifies its landscape. The present study is an investigation of the morphometric parameters of upper Beas basin. ALOS PALSAR digital elevation model available at 12.5 m resolution from Alaska Satellite Facility has been used for the study in Arc GIS 10.2 environment. The findings of the study categorize upper Beas as a sixth order drainage basin with a total area of 4958.98 km2. High bifurcation values infer an accelerated state of erosion and underline the mountainous origin and late youthful stage of river Beas and its tributaries. Geometrically, the basin has an elongated shape indicating lower peak flow but for a longer duration making flood management ambiguous. Upper Beas basin has a coarse drainage density and texture, suggesting high infiltration and less surface water availability. Tectonically, studyarea has some prominent faults and thrusts (MBT, MCT, and STD), making the region susceptible to water infiltration. These observations unquestionably indicate a strong tectonic and lithological control over the evolution of drainage patterns in the study area.
Introduction
The evolution of mountain belts is an interplay between tectonically driven rock uplift, climate-driven erosion, and denudation process (Thiede et al., Citation2005; Whipple, Citation2009), which are sensitively balanced and can develop a strong feedback between each other (Yin, Citation2006). The growth and characteristics of the orogen, therefore, are the result of the dynamic coupling of tectonic, climatic, and geomorphic processes (Whipple, Citation2009). The Himalayas are the youngest of mountain ranges that manifests landforms like river terraces, debris fans, migrated or capture streams, active faults, alluvial fans, which are the result of complex geological, geomorphological, hydrological, and tectonic process actively engaged in landform evolution and modification (Khan et al., Citation2021). Numerous studies (Agarwal & Sharma, Citation2011; Bull & McFadden, Citation1977; Burbank & Fort, Citation1985; Fort et al., Citation1989; Keller, Citation1986; Valdiya, Citation2001;) have reported the ongoing tectonic activities in the past 35–40 ka over the entire Himalayan stretch. Traces of these morpho-tectonic processes can be observed in basin geometry, drainage network patterns, and relief configuration (Molin et al., Citation2004; Necea et al., Citation2005). Many studies (Agarwal et al., Citation2009, Citation2008; Bali et al., Citation2012, Citation2011; Bull & McFadden, Citation1977; Chorley et al., Citation1985; Clarke, Citation1966; Keller, Citation1986; Strahler, Citation1957) have made use of these morpho-tectonic parameters to address the more significant question, i.e., landform evolution.
Morphometric analysis holds the capability to provide a mathematical description of the basin geometry to decipher initial slope, structural control, and rock permeability (Strahler, Citation1964). Linear parameters (stream number, stream length, stream length ratio), areal parameters (form factor, elongation ratio, compactness coefficient, circularity ratio), and relief parameters (relative relief, dissection index, ruggedness index) of a morphometric analysis are, to a significant extent, hydrological response of drainage basin and can provide insightful synthetic details of the hydrological behavior of the concerned watershed (Strahler, Citation1958, Citation1957). This viable information can be applied in watershed management as well as to compare different watersheds that evolved under various geologic and climatic regimes (Horton, Citation1945; Markose et al., Citation2014; Rai, Chaubey et al., Citation2017). Geomorphic structure of a watershed does control the dynamic behavior of the runoff. The induced runoff thus is very sensitive to morphometric characteristics of the basin (Rai et al. Citation2017, Citation2018). A well-construed morphometric index can, therefore, provide useful information on fluvial processes, drainage linkages, and status of erosive processes as well as flood conditions (Chorley et al., Citation1985; Rai et al., Citation2018; Yangchan et al., Citation2015). Morphometry has also been applied as a tool to know the area–height correlation that does provide insights to the magnitude of denudation processes operating on the as well as of neo-tectonics (Kanth & ul Hassan, Citation2012). The understanding of prevalent hydrological, geological, and geomorphological processes of the concerned drainage basin will enable one to understand the making and unmaking of the dominant landforms of the region, which can give insights into the geologic past and then prevalent fluvial and glacial processes. With the advancement of Remote Sensing (RS) and Geospatial Information System (GIS) and the viability of high-resolution DEM, morphometric analysis of drainage basins have become more accurate and less tedious. Several studies (Biswas et al., Citation1999; Krishnamurthy et al., Citation1996; Magesh et al., Citation2011; Nag, Citation1998; Singh, Citation1992, Citation1995; Singh & Singh, Citation1997) have approved the calculation of morphometric parameters in an RS and GIS-based environment with increased precision within less time for a wider area. In the present study, morphometric parameters have been extracted in an RS and GIS environment for the upper Beas basin and its sub-basin. Landform evolutionary processes have manifested some unique features in the study area, exhibiting a peculiar geomorphology that has undergone significant changes over the geological time scale (Joshi, Citation1984). A detailed investigation of its geomorphological and hydrological characteristics, therefore, can reveal significant information that can be used to understand the past and present denudation and tectonic processes active in the study area. The present study aims to conduct a GIS and RS assisted assessment of morphometric/ tectonic parameters of upper Beas basin to characterize drainage basin to deliver an improved apprehension of the geomorphological, hydrological, and geological characteristics of upper Beas basin as well as a speculative insight into relative tectonic activities in the region.
Study area
Beas River originates from Beas Kund and forms a major left-bank tributary of the Indus river system in Northwestern Himalaya. The whole catchment of the river Beas (20,303 sq.km.) extends over the Higher Himalaya, Lesser Himalaya, and Shiwalik Himalaya; therefore, the river experiences a wide range of topography, climate, and vegetation from its source to the sink. The total length of the Beas River is 460 km, which is bounded within 31° 15ʹ N to 32° 30ʹ N latitudes and 75° 30ʹ E to 78° 0ʹ E longitudes. The Beas basin is spread over parts of Kullu, Mandi, Hamirpur, Kangra, and Chamba districts of Himachal Pradesh. In the present study, upper section of the Beas valley from Manali to Aut is undertaken for morphometric investigation, referred to as upper Beas Basin. Total length of the river Beas till Pandoh Dam is 116 km, and the catchment area is 5300 sq. km. The Pir Panjal ranges (5000 meters above MSL) separates Beas valley from Chandra river valley, whereas Dhauladhar ranges (3650 meters above MSL) form a water divide between Ravi and Beas River. In the study area, elevation ranges from 914 m at Aut to 6549 m. The Drainage system in the upper section (upstream from Aut) is a constellation of glacial-fed perennial streams. In this section, the river flows in a north to south direction and is supplemented by numerous left and right bank tributaries.
Major right bank tributaries are Phojal, Sarbari Khad, Manalsu, and major left bank tributaries are Alani, Parbati, Hurla, Sainj, Tirthan. Left bank tributaries are longer. Beas valley experiences tropical to alpine climatic conditions owing to the altitudinal variations. In the study area, two meteorological stations are found, i.e., Manali and Bhuntar. Maximum rainfall is received in July and the lowest in October and November. At Bhuntar, normal annual rainfall is about 1400 mm, while at Manali, it is 900 mm. In terms of temperature, in Manali, monthly mean air temperature in July is around 20°C that can drop up to 5°C during January. In contrast, monthly mean air temperature in Bhuntar during July is about 25°C that goes down to 8.3°C during January.
Geological and Geomorphological setup of the study area
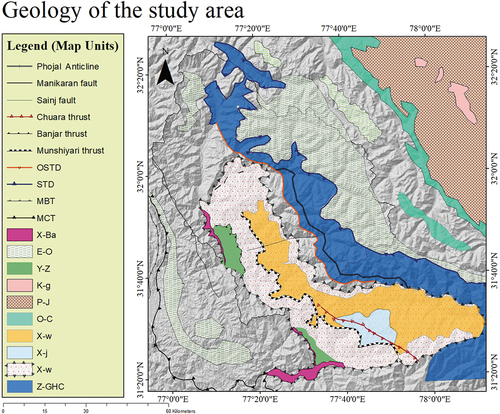
Himachal Himalayas exhibits a complex geologic and tectonic setting that has evolved during the Cenozoic area and remains a subject of debate among academicians. Previous studies (Misra & Tewari, Citation1988; Sübner et al., Citation2018; Webb et al., Citation2011) have established that upper Beas basin has six tectono-stratigraphic successions from Mandi to Rohtang viz Siwalik Group; Dharamshala Group; Larji-Rampur window Group; Chail Group; Jutogh Group and Vaikrita Group (). The study area has some prominent tectonic feature, i.e., LKTW (Larji–Kullu Tectonic Window), MCT, MBT, STD and notable faults and thrusts, i.e., Munshiyari thrust, Manikaran fault, Banjar thrust, Sainj fault. () that has led to the changes in the structure and shape of the landforms through constant thrusting, faulting, folding and metamorphism. The upper part of the basin is comprised of gneisses, granites and migmatites of the Vaikrita Group, locally termed as the Rohtang Gneissic Complex (Misra & Tewari, Citation1988; Sübner et al., Citation2018; Webb et al., Citation2011). Middle part of the basin consists of micaceous slates, garnetiferous quartzite, and schist, massive green quartzite, and limestone of the Jutogh Group. Along the Main Boundary Fault, Dharamshala Group is overlain by Shali Formation, which tectonically rests under the Rampur Formation along with the Garsa thrust (Khan et al., Citation2021; Misra & Tewari, Citation1988). Southern part of the basin consists of Shiwalik group and forms the most dominant lithology of the study area. Geomorphologically, study area depicts high elevation, steep slopes, escarpments, and narrow, deep gorges. It also accommodates fluvio-galcial alluvial deposits as well as cut and fill river terraces. Mass wasting processes have resulted in debris deposits and can be observed mainly along LKTW (Larji–Kullu Tectonic Window).
Figure 1. Location of the study area.
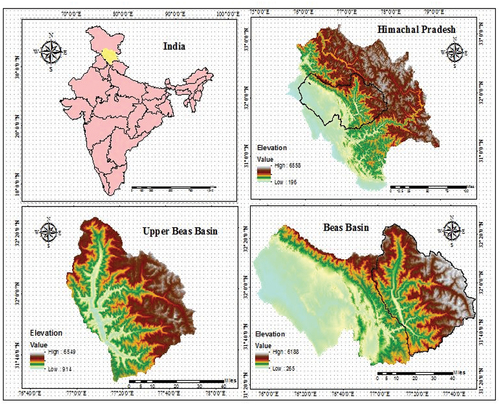
Figure 2. Map of the study area showing major geologic division and prominent thrusts and faults present in the study area. Modified after (Sübner et al., Citation2018; Webb et al., Citation2011) MBT: Main boundary thrust, MCT: Main central thrust, STD: South Tibet detachment, OSTD: Overturned South Tibet Detachment. Tethyan Himalayan Sequence:X-Ba: Baragaon granitic gneiss. E-O: Early Paleozoic granite. Y-Z: Deoban K-g: Giumal-Chikkim. P-J: Tandi, O-C: Thaple-Muth-Lipak, X-w: Wangtu, X-j: Jeori, X-be: Berinag, Z-Ch: Haimanta (with graphitic quartzite marker beds) Z-GHC: Greater Himalayan Crystalline complex.
Datasets and Methodology
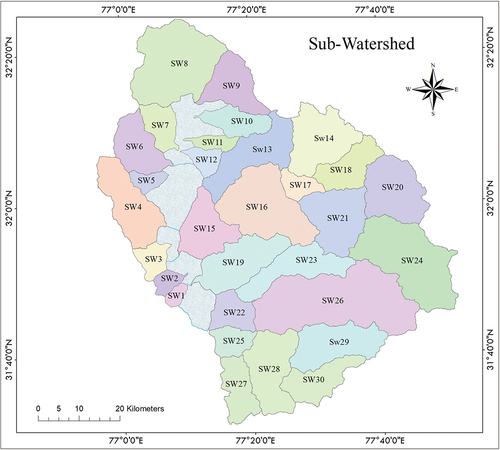
Quantitative mapping of earth’s surface landforms includes a clear understanding of its linear, areal, and relief characteristics that are considered as the principal parameters for a drainage basin analysis (Bates & Jackson, Citation1980). Morphometric analysis is a set of mathematical tools and thus is suitable for obtaining hydrological, geomorphological, and tectonic insights of the surface landforms. The calculation of drainage network and subsequent morphometric parameters for upper Beas basin and its sub-basins have been calculated using ALOS PALSAR digital elevation model provided by Alaska satellite facility at 12.5 m resolution in a GIS environment using ArcGIS version 10.3. To begin with, DEM has initially been diagnosed to see if there are any sinks in the data and then has been filled using Arc-hydro tool (). Study area exerts a complex geology and geomorphology; it constitutes a variety of sub-watershed that has unique relief characteristics and ongoing hydrological processes that can be easily overlooked if only studied at a main river system scale. Therefore, to bring forth the role of tributaries on the main river system, study area has been divided into a total of 30 sub-watersheds (), which have further been individually analyzed. elaborates the systematic processes opted for the study. After acquiring the stream network based on the Strahler (Citation1958), linear, areal, and relief parameters
Figure 3. Methodological workflow.
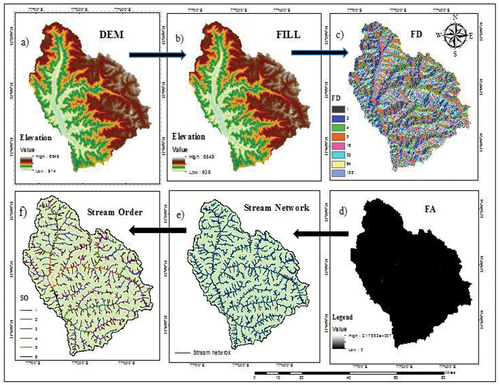
Figure 4. Systematic Workflow and calculated morphometric parameters.
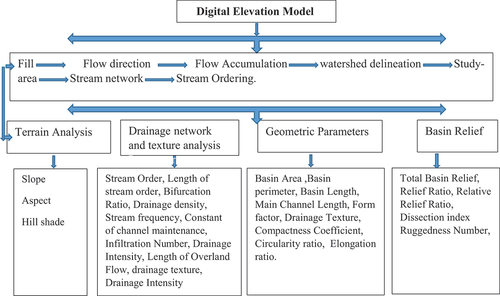
Figure 5. Sub- watersheds in the study area.
shown in the have been calculated given their formula, based on the definition.
Table 1. Mathematical equations opted for the study to calculate morphometric parameters.
Results and Discussions
Morphometric parameters substantially control the hydrological response and morphological evolution of the basin; therefore, it is very important to quantify and analyze the linear, areal, and relief parameters of the watershed. In the present study, morphometric parameters of upper Beas basin and sub-basins have been calculated, and the results thus obtained have been discussed henceforward:
Liner parameters
Stream order (u)
Stream ordering of the Beas basin has been done based on the Strahler (Citation1964) stream ordering system, where the smallest fingerprint tributaries are labelled as first-order streams (). Wherever two first-order streams join, a second-order stream is formed, and so on. Stream ordering is characterized by the shape, size, and relief distribution of the watershed (Haghipour et al., Citation2012).
Figure 6. (a) stream order, (b) drainage density.
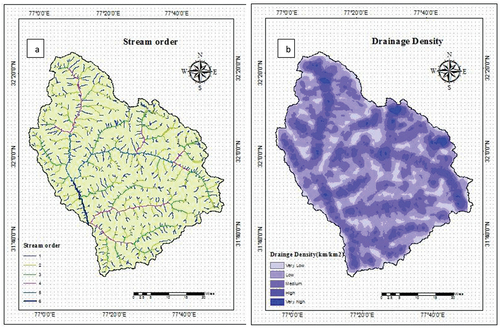
Based on the Strahler (Citation1964) stream ordering system, upper Beas basin is a six-order drainage basin with a total number of 1130 streams. This stream frequency goes on decreasing as the stream order increases.
Stream Number (Nu)
The study area has a total of 1130 stream, of which 946 streams are of first stream order, 140 streams are of second stream order, 33 streams are of third stream order, seven streams are of fourth stream order, three streams are of fifth stream order, and one stream is of sixth stream order () Maximum stream frequency being in the lower (1st, 2nd, 3rd) stream order indicates the mountainous origin of the upper course of the drainage. A higher number of first and second streams ensures plentiful supplies of water that leads to a massive water flux in the subsequent higher stream order basin area, therefore triggering higher erosion (Wakode et al., Citation2013). A sudden decrease in the stream frequency is noted from third to fourth stream order highlighting morphological change over the course.
Table 2. Stream number, stream length, bifurcation ratio, mean stream length, stream length ratio of upper Beas basin.
Stream length (Lu)
Lu is a hydrological phenomenon of the watershed which is useful in understanding surface runoff characteristics as it is highly correlated with the slope, i.e., a smaller Lu implies the runoff course as steep slope topography and vice versa (Wakode et al., Citation2013). For the Upper Beas basin, first order streams travel a total length of 1145.9 km, second order for 606.58 km, third for 294.29, fourth for 153.81 km, fifth for 90.34 km, and sixth order for a total of 23.92 km. The main steam length () for the study area is 64.83 km.
Table 3. Stream number (Nu) and stream length (Lu) of sub-watersheds.
Bifurcation ratio (Rb)
The bifurcation ratio (Rb) is defined as the number of the stream segments of given order “Nu” to the number of streams in the next higher-order (Nu + 1) (Horton Citation1945). It is of crucial importance in morphometric analysis as it is a prime parameter that links hydrological regime of a sub-basin to topological and climatic conditions.
It is a dimensionless indicator and can be helpful to analyze the flood potentiality of the watershed as well as highlight the structural irregularities in topography that emerge from the degree of geological and lithological control on the development of the watershed (Chow Ven, Citation1964). For upper Beas basin, the average bifurcation ratio is 4.21. For first order to second order stream, it is the highest 6.76, from second order to third order it is 4.24, from third to fourth it is 4.71, from fourth to fifth it is 2.33, and from fifth to sixth it is 3.00. Of the sub-basins, the average bifurcation ranges between 2.9 (SW20) to 6.01 (SW13) . As it is evident, the bifurcation ratio between first and second-order streams is considerably higher than the Rb of higher-order streams, indicating a state of accelerated erosion (Verstappen, Citation1983). Typically, the basin produces a sharp peak of discharge when “Rb” value is low, and it yields a low but extended peak flow when high “Rb” values are high (Agarwal, Citation1998). In general, the bifurcation ratio values range from 3.0 to 5.0 (Strahler (Citation1964). In the study area, at sub-watershed level, Rb values are higher than 5, implying that the region has suffered more structural disturbances (Strahler, Citation1964; Verstappen, Citation1983), and the drainage pattern has been distorted because of the geological or structural control (Chopra et al., Citation2005; Chow Ven, Citation1964; Nautiyal, Citation1994; Schumm, Citation1956).
Basin geometry parameters
Basin Area (A) and length (L) and perimeter (P)
The area of the drainage basin is an essential parameter in basin geometry as it directly affects the size of hydrograph and runoff magnitude Schumm (Citation1956). The computed area of upper Beas basin using ArcGIS 10.3 software is 4958.98 sq. km. Right bank tributaries make the smallest sub-basins (SW1 (19.98 sq. km), SW2 (30.81 sq. km), whereas the left bank tributaries being much longer make a wider catchment area (SW26; 497.00 sq. km, SW 24; 346.90 sq. km. SW8: 340.45 sq. km). Schumm (Citation1956) defined the L as the longest dimension of the basin parallel to the principal drainage line. Based on this definition, L calculated for upper Beas basin is 101.19 km. Of the individual sub-basins, SW 26 (40.24 km), SW23 (33.56 km), SW249 (30.38 km) have the highest L, whereas SW 1(6.71), SW5 (8.86) have the smallest L. Basin perimeter (P) is the outer boundary of the sub-basin that encloses its area. It is measured along the divides between sub-basins and may be used as an indicator of sub-basin size and shape. P computed for the study area is 387.3 km ().
Table 4. Mean stream length and stream length ratio of sub-watersheds.
Table 5. Bifurcation ratio, basin area, basin perimeter, basin length, mcl, fitness ratio, form factor, circularity ratio, elongation ratio of sub-watersheds.
Elongation ratio (Re)
Schumm (Citation1956) has defined Re as the ratio between the diameter of a circle of the same area as the drainage basin and the maximum length of the basin. Strahler (Citation1958) inferred that given the geological and climatological setup, Re runs between 0.6 and 1. The value of the ratio can be used to characterize the erratic slopes of the basin i.e., circular (0.9–0.10), oval (0.8–0.9), less elongated (0.7–0.8), elongated (0.5–0.7), and highly elongated (<0.5) (Rai et al., Citation2017). Basin with Re close to 1.0 is typically a low relief region, whereas values in the range 0.6–0.8 are usually associated with high relief and steep ground slope (Strahler, Citation1958). Sharma and Sarma (Citation2013) has inferred the Re value with reference to relative tectonic activities. Re values of less than 0.5; 0.5–0.75, and more than 0.75 have been inferred as tectonically active, slightly active, and inactive settings, respectively. Re value for upper Beas basin is 0.7, implying a rather elongated shape characterized by high relief and steep slopes and the existence of tectonic movements. However, at sub-basin level, Re values range from 0.4 to 0.9. SW 23 has the lowest value (0.43) followed by SW 11 (0.51), SW 30 (0.55), SW13 (0.57), categorizing them as a highly tectonically active region, whereas the high values of Re were observed in SW 20 (0.9), SW14 (0.8), SW21 (0.8) implying a rather gentle slope and tectonic inactivity.
Form factor (Rf)
Horton (Citation1932) has defined Rf as the ratio of the area of the basin divided by the square of an axial length of the basin. It is a quantitative expression that indicates the flow intensity of the basin for a defined area. The value of Rf ratio ranges from 0 in a highly elongated basin to 1 in a perfectly circular basin. Basins with smaller Rf values tend to be more elongated. Higher Rf values (0.6–0.78, slightly circular; 0.78–1, perfectly circular) suggest that the basin will have a higher peak flow for a shorter duration. Flood flow management, therefore, of the high form factor basins tends to be more ambiguous. Lower form factor values (below 0.6) indicate lower peak flow for a longer duration. Rf value of the upper Beas basin is 0.48 indicating an elongated shape of the basin that will have a flat peak flow but for a longer duration. On the sub-basin scale, Rf values range from 0.1 to 0.9, engulfing a wide variety of topographic and hydrologic diversity of the adjacent tributaries. SW23 (0.15) has the lowest Rf value followed by SW11 (0.21), SW 30 (0.24) and SW13 (0.25). Highest Rf value has been observed in SW 20 (0.65) followed by SW 14 (0.61), SW21 (0.60), inferring a circular shape and a high peak flow for a shorter duration.
Circularity ratio (Rc)
Circulatory ratio, a dimensionless parameter, is defined by Miller (Citation1953) as the ratio of the area of the basin to the area of the circle having the same circumference as the perimeter of the basin. The values of the ratio are influenced by a wide variety of factors like stream length and frequency, geological structures, land use/land cover, and climate. Of all the factors, it is more influenced by the lithological characteristic of the basin (Pareta & Pareta, Citation2011).
Stages of dissection of the basin are well reflected in Rc values. The high, medium, and low values thus represent old, mature, and young stages of the drainage system (Rai et al., Citation2018). Rc value for upper Beas basin is 0.41. Miller (Citation1953) is of the opinion that Rc values that range between 0.40 and 0.50 indicate strongly elongated shape and highly permeable homogenous geologic materials. Therefore, the study area can be characterized as an elongated basin, with high subsoil permeability where the drainage systems in their youthful stage. The range of Rc ranges from 0.2 to 0.7 at the sub-basin scale.
Texture ratio (Rt)
Rt has been described by Schumm (Citation1956) as the ratio between the first-order streams and perimeter of the basin and is considered as one of the important drainage morphometric analysis. This parameter primarily depends on the underlying lithology, infiltration capacity, and the topography of the basin (Smith, Citation1950). Horton (Citation1945) has inferred Rt as the product of stream frequency and density which essentially depends on the infiltration capacity. Rt value for upper Beas basin is 2.44, which falls under the coarse category of the texture ratio and characterizes the area as low rainfall and high permeability region. At sub-basin scale, SW 8 has the highest texture ratio (3.62), whereas SW 17 has the lowest ratio (0.98).
Compactness Coefficient (Cc)
Gravelius (Citation1914) has elaborated Cc as the ratio of perimeter of the basin to the circumference of the circular area, which equals the basin area. This particular morphometric parameter is independent of the size of the basin and is solemnly dependent on the topographic slope of the basin (Pareta & Pareta, Citation2011). For the upper Beas basin, the Cc is 1.56, augmenting its elongated shape. For the sub-watersheds, Cc values range from 1.2 to 2.34. SW23 (2.34) has the highest Cc values, whereas SW1 (1.2) has the lowest values ().
Table 6. Compactness coefficient, wandering ratio, lemniscate’s value, drainage density, Stream frequency, constant of channel maintenance, drainage intensity, infiltration ratio, length of overland flow, drainage texture.
Fitness ratio (Ft)
The ratio of main channel length to the length of the watershed perimeter is defined as the fitness ratio. It is a measure of topographic fitness (Melton, Citation1957). Ft for upper Beas basin is 0.17, and for the sub-basin, it varies from 0.1 to 0.5.
Drainage texture analysis
Drainage texture (Dt)
Dt is a vital concept in fluvial geomorphology, which is defined as the total number of stream segments of all orders per perimeter of that area (Horton Citation1945). It is a measure of relative spacing of drainage lines depending on climate, rainfall, vegetation, lithology, infiltration capacity relief, and aspect of the terrain (Smith, Citation1950). Dt has been classified into five different textures by Smith (Citation1950), i.e., very coarse (<2), coarse (2 to 4), moderate (4 to 6), fine (6 to 8), and very fine (>8). The value of Dt for upper Beas basin is 2.91, which is a relatively coarse texture. In the region of permeable rocks, the drainage lines are rather less than the impermeable rocks. However, at the sub-basin level, it is a combination of course to moderate drainage texture with the highest of 4.7 in SW8 followed by SW 14(3.9) SW 24(3.2) SW 20(3.1) table ().
Stream Frequency (Fs)
Stream frequency or channel frequency has been defined by Horton (Citation1932) as the number of stream segments (Nu) per unit area (A). For the upper Beas basin, this value is 0.23, which is a rather low number, and over the sub-basin scale, it ranges from 0.94 to 1.78. Fs is a crucial tool to understand the erosional processing operating in the basin, which results in relief modification and degree of ruggedness (Rai et al., Citation2017). High Fs values reflect either early fluvial stages of the drainage system or rejuvenated erosional processes (Singh, Citation1992, Citation1995). The advancement of the stream segments in the study area is substantially affected by the presence of thrusts and faults and rainfall and temperature in the region.
Drainage density (Dd)
Dd is a measure of the texture of the drainage basin that has been defined as the ratio of the total stream length (Lu) cumulated to all orders in the basin to the total basin area (Horton Citation1945). A higher Dd value is generally favoured in the region of weak rock or impermeable subsurface material, whereas a low Dd value indicates highly permeable or highly resistant subsoil material under dense vegetation. In a humid region, this value ranges from 0.55 to 2.09 km/km2 (Joji et al., Citation2013). Dd is observed as an important factor that determines the time travel by water (Langbein, Citation1947). It is a crucial fluvial quantitative expression that allows measurement of runoff potential and landscape dissection and is directly influenced by the amount and type of precipitation received by the basin. For the upper Beas basin, this value is 0.47 km/km2, which again is under the coarse category of highly resistant or highly permeable rocks and low water receptivity. At sub-basin scale SW 14(1.6), SW 20(1.5) SW24 (1.5) observed a higher drainage density.
Constant of Channel maintenance (C)
Schumm (Citation1956) theorized the reciprocal of Dd as the constant of channel maintenance. C is a number expressed in km/ km2 of a drainage basin surface that is essential to develop and sustain a channel 1 km long (Strahler, Citation1957). The constant of channel maintenance suggests the relative size of landform units in a drainage basin and has a specific genetic connotation (Rai et al., Citation2017). For the upper Beas basin, this value is 2.14.
Infiltration ratio (If)
The infiltration number is the product of drainage density (Dd) and stream frequency (Fs) of a drainage basin (Faniran, Citation1968). The lower values of If indicate the higher infiltration and lesser runoff (Das & Mukherjee, Citation2002). The study area has the presence of some prominent thrust (MCT, MBT) and numerous faults (), which create a space for water to penetrate in the sub-surface layers; hence there is less water available for surface runoff leading to a very low drainage density.
Relief characteristics
Basin relief (H)
Basin relief (H) is the difference in the elevation between the highest point and the lowest point of a watershed. It is a crucial factor to understand the ongoing denudation processes and is highly influenced by the underlying geology, geomorphology, and drainage pattern of the drainage basin (Thomas et al., Citation2010). Upper Beas basin is predominantly a high mountainous region; therefore, susceptibility of the region to soil erosion (). More elongated sub-watersheds SW 13, SW 26 SW 23 have higher values of H than the circular basins.
Table 7. Basin geometry, drainage texture analysis, and relief characteristics of upper Beas basin.
Relief ratio (Rr)
Schumm (Citation1956) elaborated relief ratio (Rr) as the ratio of maximum relief to horizontal distance along the longest dimension of the basin parallel to the principal drainage line. Generally, with an increase in the area and size of the basin (), there is a decrease in its Rr value (Gottschalk, Citation1964). Overall steepness of the drainage basin is well reflected in Rr values; therefore, it can be used as an indicator of the intensity of denudational process operating on the slopes of the watershed (Schumm, Citation1956). Higher Rr values characterize a hilly environment. For upper Beas basin, Rr value is 0.056. Spatially these values range from 0.09 to 0.31. SW watershed with a larger area (SW 24, SW 26, SW27, SW16, SW23) have observed rather lower values of relief ratio (0.09, 0.11,0.12, 0.12, 0.12) respectively whereas the smaller sized basins (SW7, SW51 SW12, SW5, SW17) have higher Rr values (0.23, 0.28, 0.29, 0.31, 0.31).
Table 8. Maximum, minimum and total relief, relief ratio, relative relief ratio, dissection index and ruggedness number of sub-watersheds.
Relative relief Ratio (Rhl)
Melton (Citation1958) has inferred relative relief ratio (Rhl) as the difference between summit level, the highest altitude for a given area (H), and base level, lowest altitude for a given area (P). Rhl can be used as an index of the relative velocity of vertical tectonic movements. For the upper Beas basin, this value is 1.45, and at a sub-basin level, it ranges from 2.13 to 9.96. Like the relief ratio, the smaller sub-watersheds have registered higher Rhl values (SW1:9.96, SW12: 9.74, SW7: 9.07).
Dissection index (Di)
Dissection index (Di) is the quantitative expression of the degree of dissection or vertical erosion that exerts the stages of landscape development in any given physiographic region (Singh & Dubey, Citation1994). In general, Di values range between 0 and 1, where 0 implies that vertical dissection/erosion is not a dominant process; hence the terrain is interpreted as flat. In contrast, a value of 1 is observed in exceptional cases where it may be vertical cliffs, vertical escarpment of hill slope, or at seashore. For the study area, the Di value is 0.86 on a sub-basin scale; this value ranges from 0.44 to 0.80.
Ruggedness number (Rn)
Ruggedness number (Rn) represents any structural complexity found in a terrain. An extremely high Rn value occurs when both variables, i.e., Dd and R, are high and slope is not only steep but long as well (Strahler, Citation1964). Low ruggedness value of sub-basin implies that the area is less prone to soil erosion and has intrinsic structural complexity in association with relief and drainage density (Patton & Baker, Citation1976). For the upper Beas basin, the Rn value is 2.31, implying accelerated erosion. At the sub-basin level, it ranges from 0.25 (SW27) to 6.81 (SW13).
Conclusion
To understand the evolution and modification of mountain belts, it is essential to recognize the geological, geomorphological, hydrological and tectonic processes operational at surface and subsurface level. Morphometric analysis is one simple, quantitative, and profound tool that allows an insightful investigation of these processes that have been to modify the landscape since the geologic past. RS and GIS environment does provide a platform where morphometric analysis can be performed with precision for a broader region in less time. In the present study, morphometric attributes of upper Beas basin have been investigated using a 12.5 m DEM in an ArcGIS environment. Based on the analysis, the study area has been characterized as a sixth order drainage basin with a higher number of first and second order streams ensuring ample water supply that triggers erosion in subsequent higher order drainage basin areas. Lu values observed for the basin indicate steep slope topography through the runoff discourse. Irregularities found in the Lu confirm that Beas river has a mountainous origin and experiences abrupt changes in topography over its course. Morphometric analysis of sub-watersheds highlights three clusters of high Rb values, i.e., cluster I (SW13, SW11, SW10); II (SW23, SW26, SW19); III (SW30, SW28), indicating a robust structural control where geologic units govern the drainage pattern in these regions. From the geology, it is also observed that these three clusters fall around prominent tectonic features viz. cluster 1 (STD) II (MCT, OSTD); III (LKTW) . Whereas, east and northeastern parts of the watershed (SW 20, SW21, SW14) exhibit less structural complexities.
Based on the geometric parameters, with a form factor value of 0.48 and an elongation ratio value of 0.78, the study area has been categorized as a slightly elongated basin with high hills and steep slope topography that will have a somewhat flat peak flow but for a higher duration of time. A relatively low circulatory ratio (0.42) also implies a late youthful stage of the drainage basin which is true for most of the Himalayan basins as a majority of them are approaching a mature stage. However, at a sub-basin scale, lithological and topographical complexities of the region have been highlighted, and the shape of the basins ranges from highly elongated to oval and circular basins. SW23, SW11, SW30, SW13, SW10 fall under the highly elongated category, whereas SW20, SW14, SW21, SW8 are of an oval to a circular shape with a high peak flow for a shorter duration, making the flood flow management ambiguous. From the correlation matrix, it is clear that in the study area form factor is significantly positively correlated to the elongation and wandering ratio, augmenting the shape observed for each sub-basin.
In contrast, a significant negative correlation has been observed between circulatory ratio and compactness coefficient (). Therefore, the basins with higher circularity ratios (SW5, SW7, and SW12) also have lower values of compactness coefficient, implying that circular basins in the study areas are generally attributed with the mature drainage system, and gentle slope as C is a slope dependent parameter. Drainage parameters in the study area categorize it as a coarsely drained region as DD (0.43) Dt (2.92) Fs (0.23) remain low. The presence of prominent faults and thrusts makes the region susceptible to water infiltration. The study area has some prominent Himalayan thrusts (MCT, MBT, STD, and OSTD) and many substantial faults, which allow water to penetrate to the deeper subsurface levels, hence, higher Infiltration capacity, which leaves less surface water availability. Spatially, east and northeastern parts (SW14, SW20. SW 24, SW 18, and SW 13) of upper Beas have a denser stream network. In the correlation matrix, DD reflects a significant negative correlation with the constant of channel maintained and length of overland flow.
Table 9. A correlation matrix of the morphometric parameters.
Therefore, the sub-watersheds with low drainage density (SW 22, SW 19, SW2, SW1, and SW 28) have a higher constant of channel maintenance and length of overland flow. DD also reflects a significant positive correlation with the infiltration number, whereas stream frequency has reflected a significant positive correlation with drainage intensity and infiltration number. Finally, from the study, it can be said that morphometric analysis is a profound tool to understand various geomorphological, tectonic, and hydrological process which have been shaping the Himalayan landscape.
Compliance with ethical standards
The author declares that no copyright norms have been violated, and the study has no conflict of interest.
Disclosure statement
No potential conflict of interest was reported by the author(s).
References
- Agarwal, C. S. (1998). Study of drainage pattern through aerial data in Naugarh area of Varanasi district, U.P. Journal of the Indian Society of Remote Sensing, 26(4), 169–175. https://doi.org/10.1007/BF02990795
- Agarwal, K. K., Bali, R., Kumar, M. G., Srivastava, P., & Singh, P. V. (2009). Active tectonics in and around Kimin-Ziro area, Lower Subansiri District, Arunachal Pradesh, NE India. Zeitschriftfür Geomorphologie, 53, 109–120.
- Agarwal, K. K., Bali, R., & Singh, P. V. (2008). Morphometric analysis for the neotectonic evaluation of the Pein River Basin, Lower Subansiri district, Arunachal Pradesh. Indian Jounal Engineering Geology, 35(1–4), 163–170.
- Agarwal, K. K., & Sharma, V. K. (2011). Quaternary tilt-block tectonic in parts of Eastern Kumaun Himalaya, India. Zeitschriftfür Geomorphologie, 55(1), 1–12.
- Bali, R., Agarwal, K., Ali, S. N., Rastogi, S., & Krishna, K. (2012). Drainage morphometry of Himalayan glacio-fluvial basin, India: Hydrologic and neotectonic implications. Environmental Earth Sciences, 66(4), 1163–1174. https://doi.org/10.1007/s12665-011-1324-1
- Bali, R., Agarwal, K. K., Patil, S. K., Ali, S. N., Rastogi, S. K., & Krishna, K. (2011). Record of neotectonic activity in the Pindari Glacier valley: Study based on glacio-geomorphic and AMS fabric evidences. Earth Science India, 4, 1–14.
- Bates, R. L., & Jackson, J. A. (1980). Glossary of geology (2nd ed.). American Geological Institute.
- Biswas, S., Sudhakar, S., & Desai, V. R. (1999). Prioritization of sub-watershed based on morphometric analysis of drainage basin: A remote sensing and GIS approach. Journal of the Indian Society of Remote Sensing, 27(3), 155–166. https://doi.org/10.1007/BF02991569
- Bull, W. B., & McFadden, L. (1977). Tectonic geomorphology north and south of the Garlock fault, California. In Geomorphology in Arid Regions (pp. 115–128).
- Burbank, D. W., & Fort, M. (1985). Bedrock control on glacial limits: Examples Born the Ladakh and zanskar Ranges, north-western Himalaya, India. Journal of Glaciology, 31(108), 143–149. https://doi.org/10.1017/S0022143000006389
- Chopra, R., Raman, D. D., & Sharma, P. K. (2005). Morphometric analysis of sub-watersheds in Gurudaspur district, Punjab using remote sensing and GIS techniques. Journal of the Indian Society of Remote Sensing, 33(4), 531–539. https://doi.org/10.1007/BF02990738
- Chorley, R. J., Schumm, S. A., & Sugden, D. E. (1985). Geomorphology. Methuen and Co. Ltd.
- Chow Ven, T. (1964). Handbook of applied hydrology (ed). McGraw Hill Inc.
- Clarke, J. J. (1966). Morphometry from maps, essays in geomorphology. Elsevier Publishing Company.
- Das, A. K., & Mukherjee, S. (2002). Study of weathering and erosional status of basaltic rocks using remote sensing data. Journal of the Indian Society of Remote Sensing, 30(3), 149–156. https://doi.org/10.1007/BF02990647
- Faniran, A. (1968). The Index of Drainage Intensity—A Provisional New Drainage Factor. Australian Journal of Science, 31, 328–330.
- Fort, M., Burbank, D. W., & Freytet, P. (1989). Lacustrine sedimentation in a semi-arid alpine setting: An example from Ladakh, northwestern Himalaya. Quaternary Research, 31(3), 332–350. https://doi.org/10.1016/0033-5894(89)90041-0
- Gottschalk, L. C. (1964). Reservoir Sedimentation. In V. T. Chow (Ed.), Handbook of Applied Hydrology. McGraw Hill Book Company, (pp. 111–21).
- Gravelius, H. (1914). Grundrifi der gesamten Gewcisserkunde. Band I: Flufikunde (Compendium of Hydrology, Vol. I. Rivers, in German). Goschen.
- Haghipour, N., Burg, J.-P., Kober, F., Zeilinger, G., Ivy-Ochs, S., Kubik, P. W., & Mohammadi, F. (2012). Rate of crustal shortening and non-Coulomb behaviour of an active accretionary wedge: The folded fluvial terraces in Makran (SE Iran). Earth and Planetary Science Letters, 5(355–356), 187–198. https://doi.org/10.1016/j.epsl.2012.09.001
- Horton, R. E. (1932). Drainage basin characteristics. Transactions of American Geophysics Union, 31, 350–361. https://doi.org/10.1029/TR013i001p00350
- Horton, R. E. (1945). Erosional development of streams and their drainage basins: Hydro-physical approach to quantitative morphology. Geological Society of America Bulletin, 56(3), 275–370. https://doi.org/10.1130/0016-7606(1945)56[275:EDOSAT]2.0.CO;2
- Joji, V. S., Nair, A. S. K., & Baiju, K. V. (2013). Drainage basin delineation and quantitative analysis of Panamaram watershed of Kabani River Basin, Kerala using remote sensing and GIS. Journal of the Geological Society of India, 82(4), 368–378. https://doi.org/10.1007/s12594-013-0164-x
- Joshi, K. L. (1984). Geography of Himachal Pradesh. National Book Trust.
- Kanth, T. A., & ul Hassan, Z. (2012). Morphometric analysis and prioritization of watersheds for soil and water resource management in Wular catchment using geo-spatial tools. International Journal of Geology, Earth and Environmental Sciences, 2, 30–41.
- Keller, E. A. (1986). Investigation of active tectonics: Use of surficial earth processes. In R. E. Wallace (Ed.), Active tectonics, studies in geophysics (pp. 136–147). National Academy Press.
- Khan, I., Bali, R., Agarwal, K. K., Kumar, D., & Singh, S. K. (2021). Morphometric Analysis of Parvati Basin, NW Himalaya: A Remote Sensing and GIS Based Approach. Journal of the Geological Society of India, 97(2), 165–172. https://doi.org/10.1007/s12594-021-1648-8
- Krishnamurthy, J., Srinivas, G., Jayaram, V., & Chandrasekhar, M. G. (1996). Influence of rock type and structure in the development of drainage networks in typical hard rock terrain. ITC Journal, 4(3), 252–259.
- Langbein, W. B. (1947). Topographic Characteristics of Drainage Basins. USGS Water Supply Paper, 947-C (pp. 157).
- Magesh, N. S., Chandrasekar, N., & Soundranayagam, J. P. (2011). Morphometric evaluation of Papanasam and Manimuthar watersheds, parts of Western Ghats, Tirunelveli district, Tamil Nadu, India: A GIS approach. Environmental Earth Sciences, 64(2), 373–381. https://doi.org/10.1007/s12665-010-0860-
- Markose, V. J., Dinesh, A., & Jayappa, K. (2014). Quantitative analysis of morphometric parameters of Kali River basin, southern India, using bearing azimuth and drainage (bAd) calculator and GIS. Environmental Earth Sciences, 1–17.
- Melton, M. A. (1957). An analysis of the relations among the elements of climate, surface properties and geomorphology. Technical report 11. Department of Geology, Columbia University.
- Melton, M. A. (1958). Correlation Structures of Morphometric Properties of Drainage Systems and Their Controlling Agents. The Journal of Geology, 66(4), 442–460. https://doi.org/10.1086/626527
- Miller, V. C. (1953). A quantitative geomorphologic study of drainage basin characteristics in the Clinch Mountain Area, Virginia and Tennessee. Technical Report 3. Department of Geology Columbia University.
- Misra, D. K., & Tewari, V. C. (1988). Tectonics and Sedimentation of the rocks between Mandi and Rohtang, Beas Valley, Himachal Pradesh, India. Geoscience Journal, IX(2), 153–172.
- Molin, P., Pazzaglia, F.J., Dramis, F. (2004) Geomorphic expression of active tectonics in a rapidly deforming forearc, sila massif, Calabria, southern Italy.American Journal of Science,304(7), 559–589.
- Nag, S. K. (1998). Morphometric analysis using remote sensing techniques in the Chaka sub basin Purulia district, West Bengal. Journal of the Indian Society of Remote Sensing, 26(1–2), 69–76. https://doi.org/10.1007/BF03007341
- Nautiyal, M. D. (1994). Morphometric analysis of a drainage basin, district Dehradun, Uttar Pradesh. Journal of the Indian Society of Remote Sensing, 22(4), 251–261. https://doi.org/10.1007/BF03026526
- Necea, D., Fielitz, W., Matenco, L. (2005). Late Pliocene-Quaternary tectonics in the frontal part of the SE Carpathians: insight from tectonic geomorphology. Tectonophysics,410(1–4), 137–156.
- Pareta, K., & Pareta, U. (2011). Quantitative Morphometric Analysis of a Watershed of Yamuna Basin, India Using ASTER (DEM) Data and GIS. International Journal of Geomatics and Geosciences, 2, 248–269.
- Patton, P., & Baker, V. (1976). Morphometry and Floods in Small Drainage Basin Subject of Diverse Hydrogeomorphic Controls. Water Resources Research, 12(5), 441–952. https://doi.org/10.1029/WR012i005p00941
- Rai, P. K., Chaubey, P. K., Mohan, K., & Singh, P. (2017). Geoinformatics for assessing the inferences of quantitative drainage morphometry of the Narmada Basin in India. Applied Geomatics, 9(3), 1–23. https://doi.org/10.1007/s12518-017-0191-1
- Rai, P. K., Mishra, V. N., & Mohan, K. (2017). A study of morphometric evaluation of the son basin. India Using Geospatial Approach Remote Sens Appl: Society and Environ, 7, 9–20.
- Rai, P. K., Singh, R. C., Mishra, V. N., & Singh, P. (2018). Hydrological inferences through morphometric analysis of lower Kosi river basin of India for water resource management based on remote sensing data. Applied Water Science, 8(1), 15. https://doi.org/10.1007/s13201-018-0660-7
- Schumm, S. A. (1956). The evolution of drainage systems and slopes in bad lands at Perth, Amboi, New Jersey. Geological Society of America Bulletin, 67(5), 597–646. https://doi.org/10.1130/0016-7606(1956)67[597:EODSAS]2.0.CO;2
- Sharma, S., & Sarma, J. N. (2013). Drainage analysis in a part of the Brahmaputra valley in Sivasagar district, Assam, India, to detect the role of nontectonic activity. Journal of the Indian Society of Remote Sensing, 41(4), 895–904. https://doi.org/10.1007/s12524-013-0262-7
- Singh, S. (1992). Quantitative geomorphology of the drainage basin. In T. S. Chouhan & K. N. Joshi (Eds.), Readings on remote sensing applications (pp. 11–24). Scientific Publishers.
- Singh, S. (1995). Quantitative analysis of watershed geomorphology using remote sensing techniques. Annals of Arid Zone, 34(4), 243–251.
- Singh, S., & Dubey, A. (1994). Geo-environmental planning of watersheds in India. Chugh Publications.
- Singh, S., & Singh, M. B. (1997). Morphometric analysis of Kanhar river basin. National Geographic Journal India, 43(1), 31–43.
- Smith, K. G. (1950). Standards for grading textures of erosional topography. American Journal of Science, 248(9), 655–668. https://doi.org/10.2475/ajs.248.9.655
- Strahler, A. N. (1957). Quantitative analysis of watershed geomorphology. Transactions, American Geophysical Union, 38(6), 913–920. https://doi.org/10.1029/TR038i006p00913
- Strahler, A. N. (1958). Dimensional analysis applied to fluvialy eroded landforms. Geological Society of America Bulletin, 69(3), 279–300. https://doi.org/10.1130/0016-7606(1958)69[279:DAATFE]2.0.CO;2
- Strahler, A. N. (1964). Quantitative geomorphology of drainage basins and channel networks. In V. T. Chow (Ed.), Handbook of applied hydrology (pp. Section 4–11). McGraw Hill Book Company.
- Sübner, K., Grujic, D., Dunkl, I., Thiede, R., & Eugster, P. (2018). Pliocene episodic exhumation and the significance of the Munsiari thrust in the northwestern Himalaya. Earth and Planetary Science Letters, 481, 273–283. https://doi.org/10.1016/j.epsl.2017.10.036
- Thiede, R. C., Arrowsmith, J. R., Bookhagen, B., McWilliams, M. O., Sobel, E. R., & Strecker, M. R. (2005). From tectonically to erosionally controlled development of the Himalayan orogen. Geology, 33(8), 689–692. https://doi.org/10.1130/G21483AR.1
- Thomas, J., Joseph, S., & Thrivikramaji, K. P. (2010). Morphometric aspects of a small tropical mountain river system, the southern Western Ghats, India. International Journal of Digital Earth, 3(2), 135–156. https://doi.org/10.1080/17538940903464370
- Valdiya, K. S. (2001). Reactivation of terrane-defining boundary thrusts in central sector of the Himalaya. Current Science, 81, 1418–1431.
- Verstappen, H. T. H. (1983). Applied geomorphology:Geomorphological surveys for environmental development. Elsevier
- Wakode, H. B., Baier, K., Jha, R., & Azzam, R. (2013). Analysis of urban growth using Landsat TM/ETM data and GIS—a case study of Hyderabad, India. Arabian Journal of Geosciences, 7(1), 109–121. https://doi.org/10.1007/s12517-013-0843-3
- Webb, A. A. G., Yin, A., Harrison, T. M., Célérier, J., Gehrels, G. E., Manning, C. E., & Grove, M. (2011). Cenozoic tectonic history of the Himachal Himalaya (Northwestern India) and its constraints on the formation mechanism of the Himalayan orogen. Geosphere, v.4, 1013–1061. https://doi.org/10.1130/GES00627.1
- Whipple, K. X. (2009). The influence of climate on the tectonic evolution of mountain belts. Nature Geoscience, 2(2), 97–104. https://doi.org/10.1038/ngeo413
- Yangchan, J., Jain, A. K., Tiwari, A. K., & Sood, A. (2015). Morphometric analysis of drainage basin through GIS: A case study of Sukhna Lake Watershed in Lower Shiwalik, India. International Journal of Scientific and Engineering Research, 6(2), 25–73.
- Yin, A. (2006). Cenozoic tectonic evolution of the Himalayan orogen as constrained by along-strike variation of structural geometry, exhumation history, and foreland sedimentation. Earth-Science Reviews, 76(1–2), 1–131.