
 ?Mathematical formulae have been encoded as MathML and are displayed in this HTML version using MathJax in order to improve their display. Uncheck the box to turn MathJax off. This feature requires Javascript. Click on a formula to zoom.
ABSTRACT
Surface water change is a very important indicator for environmental, climatic, and anthropogenic activities. The sediment brought by the stream into the reservoir starts settling down and gets deposited on the bed of the reservoir at all levels. The finer particles are carried in suspension and settle down on the reservoir floor while some of these are passed over the spillway towards the downstream of a dam. If the concentration is high, density current occurs along the floor of the reservoir. The purpose of this study is to assess the sedimentation of the Poondi Reservoir using Satellite Remote-Sensing (SRS). This helps in providing full utilization capacity of reservoir by providing more storage and supply of fresh water to the catchment area. The sedimentation assessment was carried out using satellite data and reservoir water level data from 2000 to 2020. Water spread area was analyzed from satellite data. The NDWI has been used to delineate open water features and to enhance the presence of water surface and linear interpolation/extrapolation technique has been applied for water spread area at different elevation. Further, these areas were used to compute live storage capacity of reservoir between two elevations by Prismoidal formula.
1. Introduction
Water is very essential for all the living organisms and most of the civilizations and developments were along the water resources in ancient history. Monitoring of changes using remote-sensing technology is widely used in different applications such as land use/cover change, disaster monitoring, forest and vegetation change urban sprawl and hydrology. Remote-sensing satellites at different spatial, spectral, and temporal resolutions provide an enormous amount of data that have become primary sources, being extensively used for detecting and extracting surface water and its changes in recent decades. Remote-sensing is the effective method to monitor the larger areas in short duration, and this method will be very useful to find the changes in area and volume (Ninija Merina et al., Citation2016).
Soil loss due to erosion is a global problem, especially affecting natural resources and agricultural production (Tung Gia Pham, et.al). Sediments carried by rivers are an important component in the natural geochemical cycle and the movement of material from the land to the oceans. River reaches a state of equilibrium, where the sediment inflow on average balances the sediment outflow. Reservoirs can upset this equilibrium by slowing or halting the movement of water and allowing sediment to settle, thereby preventing the movement of sediment downstream. All the rivers naturally transport sediment. However, when the flow velocity and energy of the water is reduced as the river enters a reservoir, most of this sediment settles along the bottom of the reservoir where it becomes trapped, rather than continuing downstream. Reservoir sedimentation is the gradual accumulation of the incoming sediment load from a river.
Reservoir sedimentation begins with soil erosion caused by rain and wind and with runoff that transports sediment particles into streams (Ongley, Citation1996). Researchers have developed many tools for estimating soil loss, such as the Soil and Water Assessment Tool (SWAT), the Water Erosion Prediction Project (WEPP), the Universal Soil Loss Equation (USLE), the Revised Universal Soil Loss Equation (RUSLE; Gia Pham et al., Citation2018). Among the different methods USLE will be more suitable for the study area. The present paper discusses the novel method to assess the sedimentation of the reservoir using the geoinformatics technique.
2. Study area
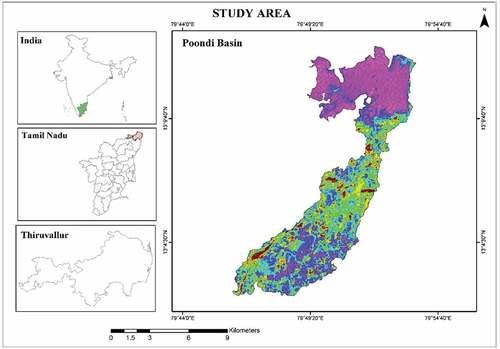
Poondi Reservoir (later named as Sathyamoorthy Sagar) was constructed in 1944 across the Kosathalaiyar River or Kotralai River in Thiruvallur district with a capacity of 2573 Mcft and placed in service for intercepting and storing Kosathalaiyar River water. Surplus water flows down the river which is again intercepted by Tamaraipakkam Anicut and diverted to Sholavaram Lake and Puzhal Lake. The study area has been shown in the .
Figure 1. Study area.
3. Data used
Landsat data during the period January 2010, February 2015 and March 2020 using multi-temporal Landsat ETM+, TM, and OLI sensors for different date of pass of water level variation for different dates were collected for the dam site. It was observed from near FRL to MDDL. DEM data of Cartosat from NRSC website were acquired. Rainfall and Climate station data were acquired for the microbasin area from GRDH, PWD, Tiruvallur. Soil Erodibility Index Data were collected from Agricultural Department, Tiruvallur, Tamil Nadu. Daily reservoir water level, Inflow and out flow data are collected for calculating water quantity and for validation of arrived results. Climatic and rainfall data were also collected from state Ground and Surface Water Resources Data Centre, Chennai.
4. Methodology
4.1. Normalized Difference Water Index (NDWI)
The Normalized Difference Water Index (NDWI) was first proposed by McFeeters in 1996 to detect surface waters in wetland environments and to allow for the measurement of surface water extent (Stuart, Citation2013). NDWI help in identification on water pixel at a micro-level that in turn help in accurate pixel extraction. The NDWI can be calculated with the help of following formulae.
Where, NIR = Near Infrared
4.2. Water pixel extraction and capacity change estimation
To calculate the reservoir capacity between two elevations, we can use trapezoidal, modified prismoidal formula. The computation of this is carried to through prismoidal formulae as per several references made for exact results.
where, = Volume between elevation E2 and E1;
(E2> E1); = Water spread areas at elevation E1 and E2;
Respectively, .
4.3. Universal soil loss equation
The USLE, proposed by Wischmeier and Smith (Citation1978), is applied in many areas worldwide (Gia Pham et al., Citation2018). To equation represent the USLE is as follows:
where A = potential long-term average annual soil loss (tons ha1 year1);
R = rainfall erosivity (mm ha1 year);
K = soil erodibility factor (tons ha1 R unit1);
LS = slope length-gradient factor;
C = crop/vegetation and management factor;
P = support practice factor.
R (rainfall erosivity) factor,
where Rn = average annual rainfall of year (mm)
5. Result and discussion
5.1. Normalized Difference Water Index (NDWI)
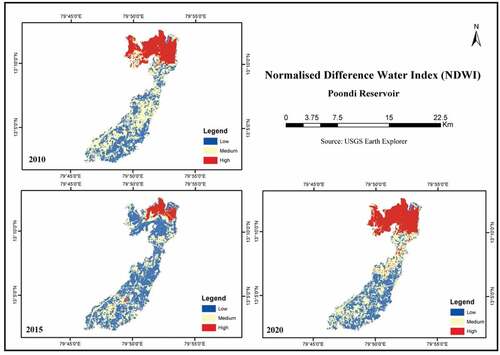
NDWI is based on the fact that water has strongest absorption while vegetation has strongest reflectivity at near infrared. It is used to classify the water pixel from optical satellite image and extract the water surface to estimate area. The NDWI has been calculated with the help of EquationEq. (1)Eq. (1)
Eq. (1) for the 3 years, i.e., 2010, 2015, 2020, respectively, as shown in . But the water feature extracted using the extracted using the NDWI include false-positives from built-up land.
Figure 2. NDWI.
5.2. Capacity change estimation and water pixel extraction
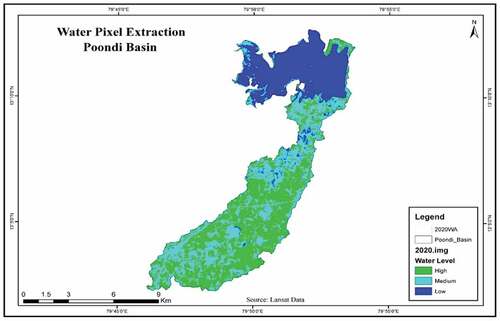
Water Pixel from the satellite imagery is extracted and volume was calculated. Linear interpolation/extrapolation technique was used to assess these areas. The overall reduction in capacity between the lowest and the highest observed water levels were obtained by adding the reduced capacities at all levels. The reservoir capacity between two elevations was computed with the EquationEq. (2)Eq. (2)
Eq. (2) using water spread areas (Moore et al., Citation1991).
The NDWI was carried for detection of water and thus would be efficient for extraction of water pixel. Thresholding the NDWI values eliminated rooftop pixels and other non-water surfaces from the areas contained within the residential parcels themselves. The use of the maximum NDWI value to select parcels resulted in few errors (Stuart, Citation2013). Water pixels are extracted with referencing on digital elevation and acquired. FRL level capacity is calculated and change in volume EquationEq. (2)Eq. (2)
Eq. (2) . With change in capacity, the sediment deposited is estimated and calculated in Tonnages as shown in .
Table 1. Change in capacity.
As per the study, it is observed that 3.42% is the rate of sedimentation per year that occurs in Poondi Reservoir, Thiruvallur, which in turn reduces the storage capacity of reservoir making the reservoir deficit of fresh water supply to Chennai city.
Figure 3. Water pixel extraction – 2020.
5.3. De-silting the reservoir
Sedimentation occurs when the eroded material that is being transported by water, settles out of the water column onto the surface, as the water flow slows. The sediments that form a waterway’s bed, banks, and floodplain have been transported from higher elevation in the catchment and deposited there by the flow of water. To understand this process, it has to start from the sources of the deposited sediments in a lake and it must take into account the two forms of solid contribution, namely: the dragged solid flow and the suspended solid flow (Marcu & Iancu, Citation2013).
The sediment already deposited in a reservoir may be removed either by excavation, dredging, etc., or by scouring through sluices in the dam. The removal of the deposited sediment by excavation, dredging, etc., is however not feasible in most of the cases except in the case of some very small reservoirs. There are certain limitations in the use of sluices for removing the deposited sediment.
For scouring the deposited sediment, the sluices are to be provided near the bottom of the dam which involves a lot of structural problem and hence except for some small dams such sluices are usually not provided. Moreover, for scouring of the deposited sediment through sluices considerable amount of water is lost. Further, it is also found that the sluices are not much effective in the removal of the deposited sediment because the water flowing through the sluice scoops out a narrow channel for itself on the upstream side of the sluice and leaves the bulk of the deposited sediment undisturbed.
However, to some extent the scouring action may be made more effective if simultaneously with scouring the deposited sediment is loosened and pushed toward the sluices by mechanical means. The sluices are therefore generally used for allowing the flood.
Waters to escape to the downstream with minimum detention in the reservoir so that much deposition of sediment does not take place.
The de-silting reservoir would give sustainable storage of fresh water (Van Arun Babu et al., Citation2014). As shown in the , if we compare de-silting cost using machinery and using human resource, it was found that only a marginal difference in the cost exists . There is no need to allocate funds on de-silting too as there is previous MGNREGA scheme, which can be used for de-silting reservoir economically and store water efficiently.
Table 2. Cost of de-silting using machinery.
Table 3. Cost of de-silting using human resource.
5.4. Universal soil loss equation
On undergoing theoretical approach to find the rate of soil loss occurring in the particular study area considering several parameters like rainfall, soil type, practice factor, soil erodibility and LS factor (Balasubramani et al., Citation2019).
5.4.1. Rainfall erosivity factor (R)
The rainfall and runoff factor are the number of rainfall erosion index units (Wischmeier & Smith, Citation1978). Calculation of R factor is a complex process and involves long-term data collection (Gia Pham et al., Citation2018). The Thiruvallur District receives 1152.8 mm rainfall per year. By applying the EquationEq. (4)Eq. (4)
Eq. (4) , the Rn value has been calculated.
where the Rn value is 497.4.
5.4.2. Soil erodibility factor (K)
The soil erodibility factor (K) plays an important role in the soil conservation strategies and it represents the effect of soil properties and soil profile characteristics on soil loss (Gia Pham et al., Citation2018). So, the K factor has been calculated from the soil profile and the K value is the 0.67 for the study area.
5.4.3. Slope length gradient factor (LS)
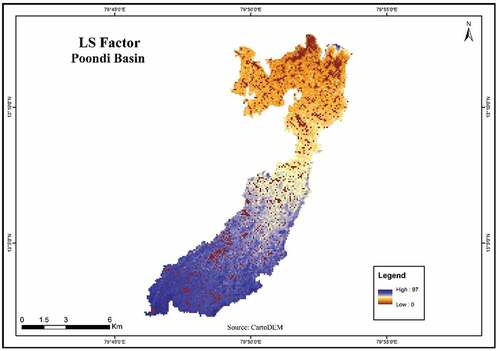
The slope and length are substantially affecting the rate of soil erosion by water (Wischmeier & Smith, Citation1978). For the study area, the maximum and minimum slopes are 0 to 143, which is shown in the . For the calculation of slope and length remote-sensing and GIS tools has been used (Panagos et al., Citation2015). The LS factor value for the study area is 0.20.
Figure 4. LS factor of Poondi basin.
5.4.4. Crop management factor (C)
The C factor is the second-most important factor that controls soil erosion risk, and the value of C mainly depends on the vegetation’s cover percentage and growth stage (Van der Knijff et al., Citation2000). For this, study field was visited to identify the majority crop type. The C Factor is obtained from the crop type factor () and the tillage method factor (), respectively (Universal Soil Loss Equation Fact sheet, Ontario) and cross-verified with Agricultural Department, Thiruvallur District. So, for the study area the C factor will be 0.4.
Table 4. Crop Type Factor
Table 5. Tillage Method Factor
5.4.5. Support practice factor (P)
The P factor is the ratio of soil loss with a support practice like contouring, strip cropping, or terracing to that with straight row farming up and down the slope (Wischmeier & Smith, Citation1978). The mostly used supporting cropland practices are cross-slope cultivation, contour farming, and strip cropping. In this research, the P factor is calculated by the cultivation and slope based on land use map (Gia Pham et al., Citation2018). So, the P factor for the study area is 0.75.
The average annual soil loss has been calculated with the help of the EquationEq. (3)Eq. (3)
Eq. (3) in accordance with above-cited parameters.
The quantitative approach by the USLE model has shown that the average annual loss in the evaluated watershed is 0.918 kg acre–1 day–1. This soil loss quantity would be favoured by the erosion factors controlling soil loss, such as steep slopes (nearly 40% of the total surface area of the watershed showed a slope value less than 20%), moderately erodible lands (57% of lands showed a K-factor between 0.5 and 0.75), and degraded plant cover.
6. Conclusion
From the above study, we may conclude that the Poondi Reservoir had reduced the live storage capacity by 3231 MMCF to 2792 MMCF showing 8.01% of loss in its original capacity.
On the other hand, sedimentation rate in the Poondi Reservoir seems to be on higher side. Moreover, in order to get true picture of sediment deposition in reservoir, the integrated hydrographic survey should be carried out below MDDL and multispectral analysis from MDDL to FRL would be more appropriate. By de-siltation process, we can attain sustainable storage of fresh water that is major constituent of life. USLE model is very helpful to determine the soil condition and its effect toward the environment. The Universal Soil Loss Equation was computed using various factors like rainfall erosivity, soil erodibility, slope length gradient factor, crop management factor, and support practice factor. The quantitative approach of the model has shown an annual loss of around 0.918 kg acre−1 day−1. The soil loss was found to be favoured by erosion factors controlling soil loss. The result showed steep slopes and moderately erodible lands and degraded plant cover.
From the result, it shows that the conditions are favourable for excessive soil loss. This could be controlled by taking various control measures. Vegetation screens may be developed by promoting the growth of vegetation in the catchment as well as at the entrance to the reservoir. The vegetation screens would trap a large amount of sediment if flood waters passed through them before entering the reservoir and hence help in reducing the sediment inflow.
Acknowledgments
We thank Centre for Water Resources (CWRM), University of Madras, Chennai for providing the necessary requirements for the research. We also thank Agricultural Department, Tiruvallur, Tamil Nadu for providing the soil related data and GRDH, PWD, Tiruvallur for providing reservoir related data.
Disclosure statement
No potential conflict of interest was reported by the author(s).
References
- Balasubramani, K., Gomathi, M., Bhaskaran, G., & Kumaraswamy, K. (2019). GIS-based spatial multi-criteria approach for characterization and prioritization of micro-watersheds: A case study of semi-arid watershed, South India. Applied Geomatics, 11(3), 289–307. https://doi.org/10.1007/s12518-019-00261-y
- Gia Pham, T., Degener, J. F., & Kappas, M. (2018). Integrated universal soil loss equation (USLE) and Geographical Information System (GIS) for soil erosion estimation in A Sap basin: Central Vietnam. International Soil and Water Conservation Research, 6(2), 99–110. https://doi.org/10.1016/j.iswcr.2018.01.001
- Marcu, B., & Iancu, I. (2013). Research on silting and de-silting of reservoirs (artificial lakes). UPB Scientific Bulletin, 75(2), 187–194. https://www.scientificbulletin.upb.ro/rev_docs_arhiva/fulle88_451295.pdf
- Merwade, V. (2019), “Creating SCS curve number grid using land cover and soil data”. Second International Conference on Science, Engineering & Environment, Osaka City, Japan, Nov.21-23.
- Moore, D., Grayson, R. B., & Ladson, A. R. (1991). Digital terrain modelling: A review of hydrological, geomorphological, and biological applications. Hydrological Processes, 5(1), 3–30. https://doi.org/10.1002/hyp.3360050103
- Ninija Merina, R., Sashik Kumar, M. C., Rizvana, N., & Adlin, N. (2016). Sedimentation study in a reservoir using remote sensing techniques. Journal of Applied Ecology and Environmental Research, 14(4), 296–304. https://doi.org/10.15666/aeer/1404_296304
- Ongley, E. D. (1996). Control of water pollution from agriculture- FAO irrigation and drainage paper 55, Food and Agriculture Organization of the United Nations, ISBN 92-5-103875-9.
- Panagos, P., Borrelli, P., & Meusburger, K. (2015). A new European slope length and Steepness factor (LS-factor) for modelling soil erosion by water. Journal of Geosciences, 5(2), 117–126. https://doi.org/10.3390/geosciences5020117
- Stuart, K. M. (2013). Using the Normalized Difference Water Index (NDWI) within a geographic information system to detect swimming pools for mosquito abatement: A practical approach. Remote Sensing, 5(7), 3544–3561. https://doi.org/10.3390/rs5073544
- van Arun Babu, E., Seetharaman, R., & Paulraj, S. (2014). Sedimentation and internal phosphorous loads in Krishnagiri reservoir, India. Journal of Lakes and Reservoirs: Research and Management, 19(3), 161–173. https://doi.org/10.1111/lre.12069
- van der Knijff, J. M., Jones, R. J. A., & Montanarella, L. (2000). Soil erosion risk assessment in Europe. European Commission Directorate General JRC, Joint Research Centre, Space Applications Institute, European Soil Bureau, 19044, 1–34. https://www.unisdr.org/files/1581_ereurnew2.pdf
- Wischmeier, W. H., & Smith, D. D. (1978). Predicting rainfall erosion losses - a guide to conservation planning. U.S. Department of Agriculture . Agriculture Handbook No. 537,1–60. https://naldc.nal.usda.gov/download/CAT79706928/PDF